
OVERVIEW
POPULAR ARTICLES
Published on: 4 Jan, 2019
The extent of competitive advantage possessed by a firm can fluctuate as the sector in which the firm operates grows (from niche to nationwide). The aggregation of this phenomenon across the entire stockmarket results in the BSE500 demonstrating twice as much churn as the Sensex. In fact, no other broadbased equity index in a major stockmarket displays as much as churn as the BSE500.
“A simple example should help explain why small markets are more hospitable than larger ones for attaining competitive advantages. Consider the case of an isolated town in Nebraska with a population of fifty thousand or less. A town of this size can one large discount store. A determined retailer who develops such a store should expect to enjoy an unchallenged monopoly. If a second store were to enter the town, neither would have enough customer traffic to be profitable. Other than things being equal, the second entrant could not expect to drive out the first, so its best choice is to stay away…At the other extreme…is downtown New York City. This large market can support many essentially similar stores. The ability of even a powerful, well-financed incumbent to prevent entry by a newcomer will be limited. It cannot…establish effective barriers to entry based on economies of scale…” – Bruce Greenwald & Judd Kahn in “Competition Demystified: A radically simplified approach to business strategy” (2005)
The enigma of “churn” in the Indian market
The uneven manner in which in which the Indian stockmarket churns has puzzled us for several years. To be specific, churn in the Sensex has been around 25-30% for the past decade i.e. over a ten year period, around 7-9 companies exit the Sensex (and an equally number enter). In contrast, churn in the BSE500 has been around 50-60% implying that over the course of a decade, between 250-300 companies exit the index (with an equivalent number entering). In fact, there is no other broadbased index in any other major stockmarket which churns anything as much as the BSE500. To date we had failed to understand why the BSE500 churns twice as much as the Sensex.
Competitive advantage fluctuates as a company grows
Now, however, we believe we have a cogent theory for why churn is so much higher in the BSE500 than in the Sensex. Basically, we are seeing Indian companies’ moats go through various stages of waxing and waning as these companies grow and as the sectors in which operate grow as well.
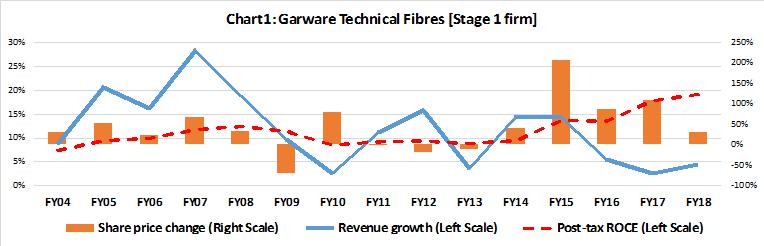
Stage 1 – Inception: A niche market emerges and a firm which is dominant in that niche prospers as other players in that niche either don’t have a quality product and/or have higher total cost/unit produced. The market leader establishes its dominance in the niche (which can be geographic niche or a niche in the product space) and spreads outwards. Garware Technical Fibres is an example of a firm currently in Stage 1 – see Chart 1.
The fact that the market leader has a cost advantage can be easily demonstrated. Suppose, the fixed costs of setting up operations (legal costs, capex for a factory, paying for the packaging & branding) are Rs 10 crores and suppose that the variable costs (raw materials & fuel primarily) are very low in comparison. Assuming that the market size is Rs 100 crores, if the market leader has 50% market share (which is the not unusual when a sector is in its infancy), the fixed costs form only 20% of its revenues. In contrast if the other players have each around 10% market share, their revenues are barely enough to cover their fixed costs. Thus the barriers to entry appear to be relatively high at this stage of the sector’s evolution.
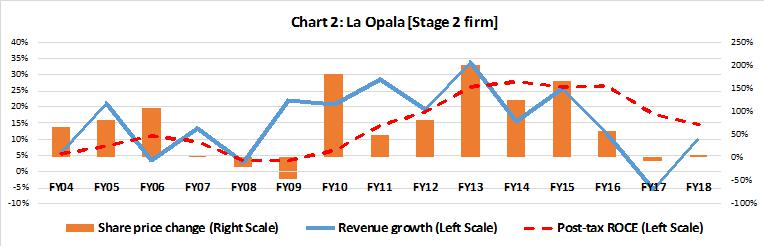
Stage 2 – Rapid new entry: As the niche market grows, the cost advantage of the largest player is narrowed down at a per unit level (as fixed costs can be defrayed across a wider revenue base). So the competitive disadvantage reduces for the non-leading players. As result, operating margins start coming under pressure for the leader. Markets grow rapidly by attracting new customers who are by definition non captive. These customers provide a viable base for new entrants. Additionally, what also tends to happen is the success of the market leader draws new entrants into the market. La Opala is an example of a firm currently in Stage 2 – see Chart 2.
So, let’s assume that the Rs 100 crore market we saw in Stage 1 grows 10x over the course of a decade and becomes a Rs 1000 crore market. Assume further that our market leader still has 50% market share and that the laggards still have around 10% market share each. However, the laggards’ revenues are now comfortably in excess of their fixed costs (of Rs 10 crores) and this attracts lots of new entrants. In fact, the laggards are now likely to have free cash flow which they will spend on heavy marketing & advertising. Such spend will force the market leader to also spend on marketing which will drag down the market leaders’ margins.
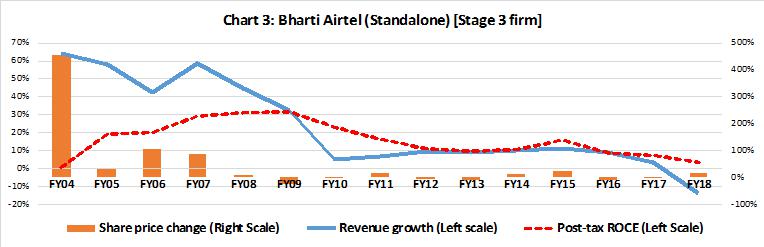
Stage 3 – Intense competition: Now there are several players in the burgeoning market and although the market leader still has the best operating margins, there are other profitable and increasingly sizeable players in a large and highly competitive market. Operating efficiency is now a critical driver of success in this stage of a sector’s evolution. Eg. mobile telephony or vehicle financing today.
The big risk for the market leader at this stage – bigger than the more obvious risk of rising competitive intensity- is that it tries to deal with slowing earnings growth by entering new markets or new industries. If he does so then the leader’s ability to deal with intense competition in his core business is diluted and with that dilution in focus goes his chances of improving operating efficiency. Bharti’s entry into Africa in 2009 is an example of a less than ideal response to rising competitive intensity in its core market. In contrast, HDFC Bank’s and Gruh Finance’s obsessive focus on expanding inside their core market allowed them to reinforce their leadership even as an increasing number of challengers entered their market. Bharti is an example of a business currently in Stage 3 – see Chart 3.
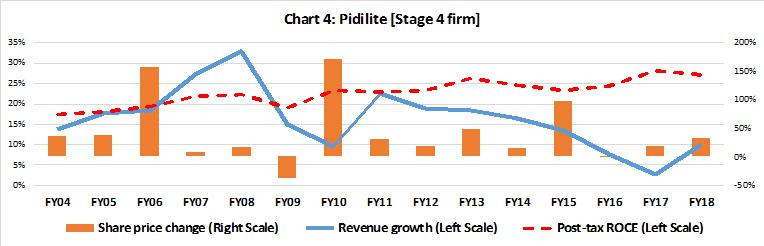
Stage 4 – The leader consolidates: In the final stage in a sector’s evolution one or two players create very powerful moats (not just around efficiency but also around customer captivity and around favourable access to lower cost inputs). These players then drive everybody else out of the industry by not hiking prices which hampers the ability of the less efficient players to hike prices and stay profitable. For example, Dr Lal Pathlabs has not hiked prices in the last two years whilst Asian Paints’ ten year price hike CAGR is just 2%. In short, these companies are the Consistent Compounders who are the stars of Saurabh’s bestselling book “The Unusual Billionaires” (Penguin, 2016) – firms like Pidilite, HDFC Bank, Asian Paints, ITC and Marico.
Not only is the road to stage 4 via stage 3, even more specifically, a market leading firm only makes it to stage 4 if it works hard on improving efficiency and staying focused in stage 3. If a firm loses focus in stage 3 then stage 4 – and Consistent Compounding – proves elusive for it as Bharti Airtel, Tata Steel and numerous other large Indian companies have discovered over the past decade.
Investment implications
- As the Indian economy gets networked with better roads, low cost flights (along with several smaller airports) and widely available broadband, it is increasingly becoming possible to discover “niche” markets which can catered to on a regional or national basis (whereas in the past these markets were each a little island in small town or village with poor connectivity to the next town or village).These niche opportunities are what’s creating lots of stage 1 and stage 2 firms. For example, over a decade ago, La Opala focused on a niche segment in the tableware market – opalware. Around this, the firm first built a franchise in eastern India and then across India. Its market cap went from being around Rs 150 crores ten years ago to around Rs 2500 crores now. La Opala’s success has now attracted Borosil and Cello (Wimplast) into the opalware market.
- Competitive intensity is relatively low in stages 1 & 2, peaks in stage 3 and moderates somewhat in 4. Share price growth for market leading firms is therefore likely to following the same path.
- Stage 3 usually comes when a company has broken into a the BSE500 after a good run lasting at least five years. This is when the average fund manager in India and the typically sellside analyst in Mumbai “discovers” a stock. Because stage 3 is toughest of the four stages, it also helps us understand why companies who have just entered the BSE500 find it so hard to sustain earnings growth and share price momentum.
- Companies which seem to be in stage 4 are “Consistent Compounders” like Relaxo, Page Industries, Dr Lal’s Pathlabs, Asian Paints, HDFC Bank, Gruh Finance, Pidilite, Nestle, etc. Once a company has nailed down its moats in stage 4, it is very hard to dislodge. This explains why churn in the Sensex is so much lower than churn in the BSE500.
- Investors are far more likely to make healthy returns (due to the spread between Return on Capital and cost of capital being juicy) from stage 1 & 4 companies. Stage 4 are likely to multi-billion $ market caps. Stage 1 are likely to have market cap below $0.5bn.
- Smart investors focus on stages 1 & 4. The lazy money chases stocks in stage 3. Thanks to the lure of the rear view mirror the temptation to invest in stage 3 stocks tends to be very high.
If you want to read our other published material, please visit https://marcellus.in/pms-investment-blog/
Saurabh Mukherjea is the author of “The Unusual Billionaires” and “Coffee Can Investing: the Low Risk Route to Stupendous Wealth”.
Note: the above material is neither investment research, nor investment advice. Marcellus does not seek payment for or business from this email in any shape or form. Marcellus Investment Managers is regulated by the Securities and Exchange Board of India as a provider of Portfolio Management Services and as an Investment Advisor.
Copyright © 2018 Marcellus Investment Managers Pvt Ltd, All rights reserved.