OVERVIEW
POPULAR ARTICLES

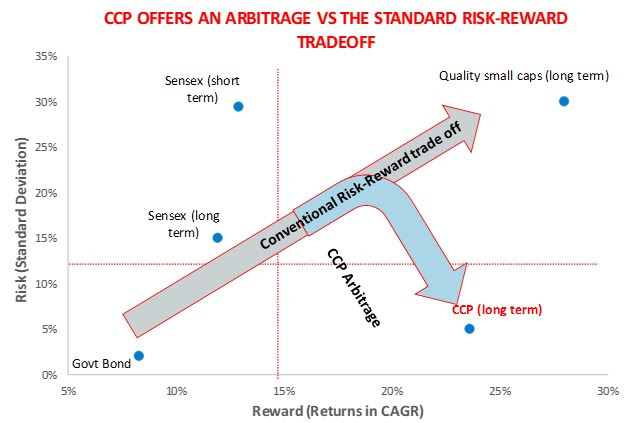
The Capital Asset Pricing Model clearly does not work in India – neither in theory nor in practice – because in the Indian market, risk & return are negatively correlated i.e. lower risk leads to higher returns.
Sophisticated investment theories can be damaging for your wealth
Amongst the more delusional theories in Finance is the Efficient Markets Hypothesis (EMH), which contends that since stock prices efficiently discount all the available information in the market, it is impossible to beat the market. An extension of this lunacy is the Capital Asset Pricing Model (CAPM), which claims that the returns from a stock will be directly proportional to the systematic risk (or beta) represented by the stock.
Whilst Warren Buffett’s rubbishing of the EMH is well-known, CAPM is still taught in classrooms across the world, including in India, a country where CAPM is even less applicable than it is in America.
So, what is CAPM and just why is it so damaging? As explained by Investopedia: “The Capital Asset Pricing Model (CAPM) describes the relationship between systematic risk and expected return for assets, particularly stocks. CAPM is widely used throughout finance for pricing risky securities and generating expected returns for assets given the risk of those assets and cost of capital.
The formula for calculating the expected return of an asset given its risk is as follows:
ER i = R f + β i (ER m − R f)
where
ER i =expected return of investment
R f =risk-free rate
β i =beta of the investment
(ER m − R f) =market risk premium
Investors expect to be compensated for risk and the time value of money. The risk-free rate in the CAPM formula accounts for the time value of money. The other components of the CAPM formula account for the investor taking on additional risk.
The beta of a potential investment is a measure of how much risk the investment will add to a portfolio that looks like the market. If a stock is riskier than the market, it will have a beta greater than one. If a stock has a beta of less than one, the formula assumes it will reduce the risk of a portfolio.
A stock’s beta is then multiplied by the market risk premium, which is the return expected from the market above the risk-free rate. The risk-free rate is then added to the product of the stock’s beta and the market risk premium. The result should give an investor the required return or discount rate they can use to find the value of an asset.”
Following CAPM in India leads investors to cause self-damage. The investor ends up believing that higher returns are proportional to higher risk (measured in CAPM by higher beta). This simply is not true. Consider the evidence:
a. If you take the top ten return generating stocks from the Nifty50 over the last 20, 10, 5 and 3 years, the average beta of these stocks is between 0.8 and 0.9 i.e. clearly below the market beta of 1. This is in spite of the fact that each of these groups of top ten stocks drawn from the Nifty50 (as it stood 20, 10, 5 and 3 years ago) has significantly outperformed the index.
b. Within these four groups of ten stocks for each of the Nifty50 cohorts (from 20, 10, 5 and 3 years ago), the correlation between beta and returns is either mildly positive (0.22 correlation between beta & returns from the Nifty of 20 years) or strongly negative (-0.45 and -0.47 correlation between beta & returns for the Nifty as it stood 3 and 5 years ago respectively). In no cohort do we find tangible evidence that higher beta leads to higher returns.
c. If you take the ten Nifty50 stocks with highest beta as of 31st March 2020 (Axis Bank, Bajaj Finance, Hindalco, ICICI Bank, IndusInd Bank, JSW Steel, M&M, Maruti Suzuki, Tata Motors, UPL), their average beta is 1.4 i.e. well above the market beta of 1. And yet, over 3, 5, 10 & 20 years these stocks – as a group – have underperformed the index significantly suggesting that higher beta actually leads to lower returns.
d. Finally, if you study the correlation between beta and returns inside this group of the highest beta stocks in the Nifty (as of 31st March 2020), you find that over 20, 10, 5 & 3 years, the correlation is negative, usually strongly so (-0.35 and -0.39 correlation between beta & returns for the Nifty over the past 3 and 5 years respectively) suggesting that higher beta actually leads to lower returns.
In short, not only is there NO POSITIVE relationship between beta and stock level returns, there also seems to be strong evidence that lower beta leads to higher returns. This finding also holds if rather than using beta as a proxy for risk, one uses share price volatility (as measured by standard deviation of monthly returns / CAGR of returns over the corresponding time period). In fact, there is a STRONG NEGATIVE correlation between share price volatility and returns i.e. companies whose share prices are less volatile, give significantly better returns over 20, 10, 5 and 3 years.
The data therefore shows that CAPM is completely useless in India i.e. NOT only do the highest risk stocks (high beta stocks) NOT deliver the highest returns, the stocks which do deliver the best returns are actually low risk stocks (i.e. low beta stocks with low share price volatility).
So why doesn’t CAPM work in India? Because the assumptions underlying CAPM are unrealistic even in a developed market like the US. In an Emerging Market like India, these assumptions verge on the delusional. For example, CAPM assumes that all investors have free access to all information at no cost. This obviously makes no sense in a market like India where even institutional investors have little or no idea of the extent of accounting fraud that most companies engage in (see the next section below as well as Chapter 10 of our book ‘The Unusual Billionaires’ for more details). Another example of a nonsensical assumption embedded in CAPM is that there are no taxes and there are no transaction costs. In reality, short-term capital gains tax is 15% and even for Nifty50 stocks, brokerage costs plus price impact costs are around 0.5% for institutional investors.
So if CAPM does not work in India what does? Crushing risk works in India.
Crushing risk is the key to generating higher returns in India
Our decade of working and investing in India has led us to conclude that you need to minimise four types of risks if you want to generate steady & healthy investment returns in the Indian stock market:
- Accounting risk: We all now know how prominent public and private sector banks in India fudged their NPA figures for years on end until the RBI’s Asset Quality Review forced them to come clean. The same problem exists with several housing finance companies (who don’t come under the RBI’s purview). The accounts of a leading cement manufacturer don’t stack up. Neither does the annual report of high-flying retailer make sense. Ditto with a prominent petchem company and a prominent pharma company. In fact, many companies in the BSE500 have annual reports which do not pass scrutiny. Using a few accounting ratios and a financial model which contains time series data on 1300 of India’s largest listed companies, we seek to identify that 20% of listed Indian companies whose books can be readily relied upon.
- Topline risk: At US$2,000, India’s per capita income is still very low (less than half the level of Sri Lanka and a quarter of the level of South East Asian countries like Thailand and Malaysia). As a result, beyond the basic essentials of life – FMCG products, pharma products, basic apparel – most other products in India are luxury items for most Indians. As a result, even for small cars or entry-level two-wheelers, demand in India fluctuates wildly. E.g. Maruti Suzuki typically experiences 5-6 years of strong demand growth (growth well above 15% per annum) followed by 3-4 years of famine (growth well below 5% per annum). Whilst its cross-cycle average growth tends to be around 12%, the stock price volatility reflects the volatility of Maruti’s top-line growth. In contrast, a company selling essential products like Asian Paints or Marico, tends to see steady revenue growth – between 10-20% per annum – pretty much every year. Investing in companies selling essential products in India therefore reduces risk.
- Bottomline risk: As the cost of capital is still pretty high in India, it is rare to find Indian companies who spend heavily on genuine R&D. Understandably therefore, the Indian economy is characterized by rapid imitation – a company spots a niche (say, gold loan finance) and within a decade it has 100 imitators. This rapid new entry squeezes the profitability of the first mover and thus creates risk for its shareholders. In order to reduce such risk, we look for sectors where over extended periods of time, 1 or 2 companies cumulatively account for 80% of the sector’s profit pie. Such monopolies have lower volatility in their profit margin.
- Liquidity risk: India is the least liquid of the world’s top ten stock markets largely because promoters own more than half of the shares outstanding. As a result of this, beyond the top 30 odd stocks, liquidity – measured by average daily traded volume (ADV) – drops rapidly. By the time you are in the lower reaches of the BSE100, ADV is well below $5m per day. Such low liquidity creates stock price gyrations as investors go through their cycles of euphoria and panic. Tilting the portfolio towards liquid stocks reduces this risk.
Disclaimer: Asian Paints and Maruti Suzuki are stocks which can be found in portfolios managed or advised by Marcellus.
Saurabh Mukherjea and Harsh Shah are part of the Investments team at Marcellus Investment Managers. Saurabh is the the co-author of ‘The Victory Project: Six Steps to Peak Potential’ and ‘Coffee Can Investing: the Low Risk Route to Stupendous Wealth’.