OVERVIEW
POPULAR ARTICLES

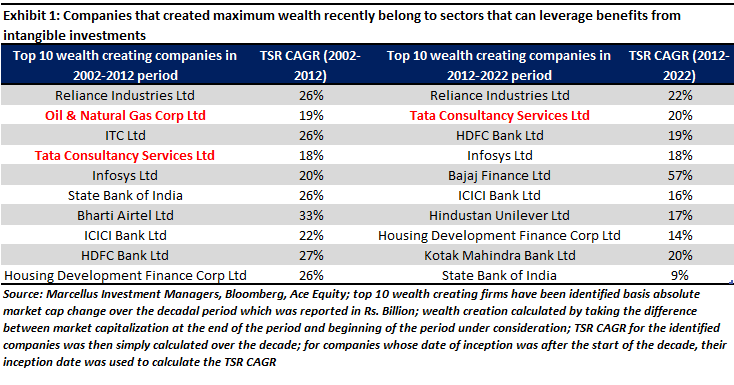
Great franchises in modern India are increasingly defined not by their physical capex & infra investments; rather they are determined by how much and how well they invest in intangible assets and reap non-linear benefits thereof. In the decade ending 2012, approximately 50% of the ten biggest wealth creators in the Indian stock market belonged to industries and sectors that require heavy investment in physical capital. Fast forward to the decade ending 2022 and we see that almost 80% of the top 10 wealth generators were companies that are low on heavy capex in physical assets (firms like TCS, Infosys, HDFC Bank, etc). These companies are plays not on “tangible” assets, but on “intangible” assets – they are plays on intellectual property, on network effects, and on smartly crafted business processes which in turn are increasingly automated.
“Capitalism subordinates men to machines instead of using machines to liberate men from the burden of mechanical and repetitive work.” – Ernest Mandel in ‘Capital: A Critique of Political Economy’, Volume 1 (1867).
TCS vs ONGC: A study in contrast
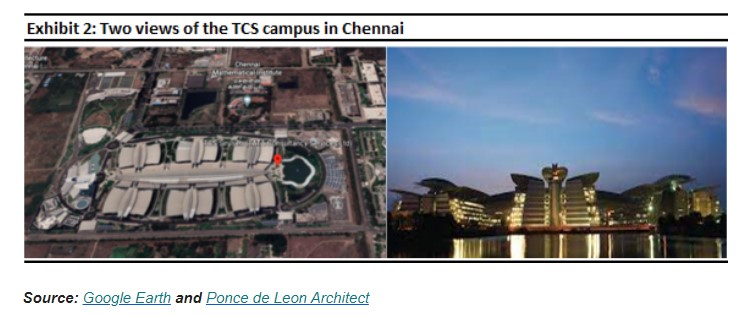
Tata Consultancy Services’ (or TCS’) largest office in India is situated in a sprawling 5.2 million sq ft campus in Chennai. That is an area equal to the size of ~100 football fields. If you happen to stand outside this massive campus during the morning rush hour, you’ll see close to approximately 20,000 people filing into work in spite of around one-third of the employees working from home. TCS Techno Park, as this campus is called, is Asia’s largest such IT facility. With ~600,000 employees on its roll, TCS is arguably India’s largest private sector employer. The firm generated ~ Rs. 11 trillion of wealth for its shareholders in the decade ending 2022, making it the second highest contributor to stock market wealth creation in all of India!
Over the past decade, TCS’ Total Shareholder Return (TSR) has compounded at a CAGR of 20% whilst its net fixed assets, EBIT, and Free Cashflows have grown by roughly 12%, 14%, and 22% p.a. over the same period respectively. If we look at TCS’ asset turnover (revenue/average net fixed assets and capital work in progress), it has averaged at around 8x in the last 10 years.
As a result, TCS’ Return on Capital Employed (ROCE) has risen from 51% in FY12 to 62% in FY22 with the 10-year average ROCE being upwards of 50%. Given that the typical large cap company in India does not even get close to hitting 15% ROCE over a typical decadal cycle (15% being our estimate of the cost of capital in India), what explains TCS’ sustained success on such a large scale?
Our research shows that TCS’ relentless rise over the past forty years has been underpinned by:
1) Unmatched muscle in skilling and training programs – especially for “freshers” (TCS was the first to do something of this sort) which leads to the build-up of human capital on a mammoth scale.This is evidenced by TCS’ cost structure – the firm has the highest profit margins amongst the leading IT Services companies (around 20% as of FY22) whilst having the lowest attrition rate (17.4% in FY22) in its peer group. TCS’ unmatched capabilities in mass hiring, training, and deployment has allowed the firm to out-muscle its competition over the past couple of decades. On the training front, TCS was one of the early players to recognize the importance of training fresh graduates and had started planning for a training campus in Trivandrum as early as 1993. The first batch of trainees joined in 1997. To put this context, Infosys’ Mysore training campus started in 2002. Learning and training today is a continuous process at TCS. Its HR policies on continuous learning, lateral movement, and growth planning drive high employee retention i.e., low attrition. At senior levels, the scope of responsibilities and autonomy are the key incentives. Lower attrition means lesser costs of hiring, training, and retraining, which have a direct impact on the firm’s profitability. The stability at the top level also drives strong comfort on succession planning. The median time spent by the C-Suite with TCS is 20 years and in its history of 50+ years, the firms has had just four CEOS – all of them were internally selected and groomed over multiple decades before ascending to the top job.
2) Robust processes for timely and accurate execution of projects:In the 1990s, TCS created an automated fix for correcting the Y2K bug. This was easy to plug and play in TCS’ applications/software, which helped TCS rectify the situation faster than its competitors could. This further established its stronghold as one of the innovators/leaders in the IT space. Another point worth mentioning is how TCS created a Data Dictionary called ADDICT (later named CASEPAC). This was a centralized repository of data and information with standardized definitions to be used by everyone, no matter where they were physically situated, in order to create coherence in the work done. The data dictionary, therefore, became a tool to dispel ambiguity and doubt about the definitions that the team had to work with. This was crucial for forging technology and learnings that supported its process approach and had a deep impact on many software project managers in TCS, some of whom occupy key positions today in the organization. This standardization and automation of processes gave TCS an operational excellence that their competitors lacked.
3) Superior intellectual property creation along with productizing its service and making it fungible across domains: TCS has typically invested ahead of the curve – whether in setting up India’s first IT fresher training campus, setting up offices in non-US geographies, investing in new business segments, etc. Some of these initiatives do not payoff, but the ones which payoff give the company a long-term edge in that space. For instance, TCS’ focus on IP creation is evident with ~2,300 patents to its credit. TCS has ‘productized/platformized’ many services (like TCS ADD which is a data handling platform for life sciences organizations and TCS HOBS which is a fully automated device management platform) and the share of platforms and products in its total revenues is substantial (~10% of revenues or US$ 3 bn – read more here). In many cases, the mundane job of coding has also been productized – smaller and generic chunks of codes are saved in a common repository, to be utilized in larger projects efficiently without reinventing the wheel. This process of investing in IP creation and productization helps TCS drive non-linear growth in revenues (which in turn drives superior profit margins) as initial spends on creating the IP or the product can be monetized across multiple clients’ projects. TCS has products and platforms in the BFSI space, retail, medical trials, blockchain, etc.
In stark contrast to TCS stands Oil and Natural Gas Corporation (or ONGC), which was the second largest wealth creator in the Indian stock market in the decade ending 2012 (ONGC’s market cap addition in that decade was ~Rs. 2 trillion i.e., less than a fifth of the value that TCS created in the decade ending 2022).
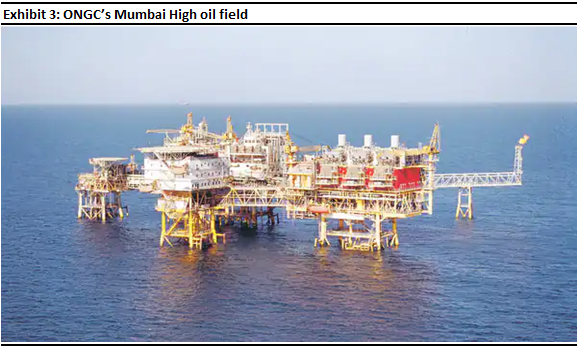
ONGC is primarily in the business of upstream crude extraction and operates large oil rigs both onshore and offshore. Just 87 nautical miles (or ~160 km) to the northwest of India’s financial capital, Mumbai, is ONGC’s crowning glory, the Mumbai High Field. Situated in the middle of the Arabian sea, sits India’s largest oil field which is operated by ONGC. Furthermore, on this site, ONGC has also constructed live-able apartments for its employees who have to operate from here.
Source: Livemint
ONGC’s multiple oil rigs play a critical role when it comes to crude extraction in India. As impressive as these feats of engineering are, ONGC’s financial statements remind us that the era of traditional capitalism (i.e. deploying ever larger sums of capital to a fixed body of intangible assets) has now passed in India. ONGC’s growth in TSR in the decade ending 2022 has been negative 1%, meaning that the firm has destroyed shareholder value instead of creating it. This value destruction has happened even as the firm’s net fixed assets and EBIT compounded at 8.5% and 1% respectively. (ONGC has given a paltry Free Cashflow growth of 5% over the last 10 years).
ONGC’s net fixed assets growing far faster than its profits imply that on the incremental assets that the firm has built over the past decade, it has not been able to generate any incremental value. Asset turnover for ONGC has been a meagre 1.16x over the last 10 years. The firm’s ROCE in the last decade has struggled to even beat the cost of capital, let alone create value for the company (average 10-year pre-tax ROCE for ONGC in the decade ending 2022 is barely 14%).
The rise of ‘Capitalism Without Capital’
“Investment is one of the most important activities in the economy. But over the past thirty years, the nature of investment has changed…The type of investment that has risen inexorably is intangible: investment in ideas, in knowledge, in aesthetic content, in software, in brands, in networks and relationships.” – Jonathan Haskel and Stian Westlake in their book Capitalism without Capital: The Rise of the Intangible Economy (2018)
Investments by companies has dramatically changed over the course of the last 40 years, especially in the developed world. As explained in one of our previous notes Three distinct layers of polarization in the Indian stock market, “corporate investments, in the past 40 years especially, have become increasingly intangible rather than tangible. Aggregating data for the developed world, the authors show that around the turn of the century, the developed economies started investing more in intangibles (which traditional accounting techniques do NOT capture as Capex) and less in tangibles (like factories & machines) … The pre-eminence of intangible investing has brought to the fore four effects that intangible assets showcase:
- Scale (intangibles are easily scalable to any length once developed initially)
- Sunk costs (intangibles have sunk costs tied to them i.e., costs that cannot be recovered),
- Spillovers (a company that makes an investment in intangibles may not be the only one, or not even the one to reap its benefits fully later; they are more often than not reaped by others), and
- Synergies (multiple intangible assets may collectively produce even higher returns than what they would produce individually).
These four effects are crucial for a company to become a consistent compounder because once a company scales using intangibles assets (such as a proprietary database), it can then extract spillovers from other companies’ investments in intangibles (such as a third party software platform like SAP), and then create synergies between intangible investments (the proprietary database feeds the SAP with big data) which can potentially help the company corner the entire industry (first in its home market and then in the global market).”
This essentially means that the incremental capex in intangibles that firms are undertaking is not getting recorded as capex yet has a powerful bearing on their profitability. In fact, this effect has played out even in the Indian context.
Over the past decade as the Indian economy has become increasingly networked and formalised (see our blog India’s Moment After a Decade of Structural Reforms, 2022), the traditional type of capitalism – the capitalism that Karl Marx wrote about in 1867 – has created very little shareholder value. The traditional construct of capitalism hinged on the idea that physical labour and capital are the essential drivers of a capitalist economy. In this traditional construct, because the supply of labour is assumed to be fixed in the short run, it is essentially the supply of capital that drives production – the more a company invests in physical capital, higher the production it can undertake until a certain limit post which diminishing returns effect kicks in. That’s how India was in the preceding century – a century in which the biggest wealth creators in India were traditional capital-intensive enterprises like Tata Steel, Grasim and ONGC.
In contrast, the unusual rise of modern India is predicated on intellect and intellectual property, on business networks and, more generally, on investment in intangible assets such as software, training, on unique business processes, on product innovation and marketing & branding – which showcase increasing returns.
In the decade ending 2022, TCS’ free cashflow growth and shareholder value creation growth of 18% and 20% CAGR respectively far outstrips ONGC’s -7% and -1% CAGR respectively. This trend and this contrast are not just limited to these two companies. By comparing the top 10 wealth creating companies in the decade ending 2012 versus the decade ending 2022, we can see the changing nature of Indian capitalism.
In the decade ending 2012, approximately 50% of the companies in the list typically belonged to industries and sectors that require heavy investment in physical capital i.e., companies like ONGC). Fast forward to the decade ending 2022 and we see that almost 80% of the top 10 wealth generators were companies that are low on heavy capex in physical assets (firms like TCS, Infosys, HDFC Bank, etc). These companies are plays not on “tangible” assets, but on “intangible” assets – they are plays on intellectual property, on network effects and on smartly crafted business processes which in turn are increasingly automated (see exhibit 1).
Firms like TCS, Infosys and HDFC Bank are likely to be even more dominant in the wealth creation stakes in the decade ending 2022 because capitalism without capital is characterized by increasing returns to scale i.e., increasingly modest amounts have to be spent on fixed assets as these firms grow. This implies rising ROCEs (or ROEs in the case of lenders) as these firms scale further. It also implies rising Free Cashflow generation as these firms scale. The spread of this dynamic in the broader Indian stock market can be seen in the exhibits below wherein we have stratified the Indian stock market by sector and then, within each sector, separated the firms by their propensity to generate Free Cashflow i.e., the companies which generate Free Cashflow most frequently are in the top row of the table and the companies which rarely generate Free Cashflow are in the bottom row of the table.
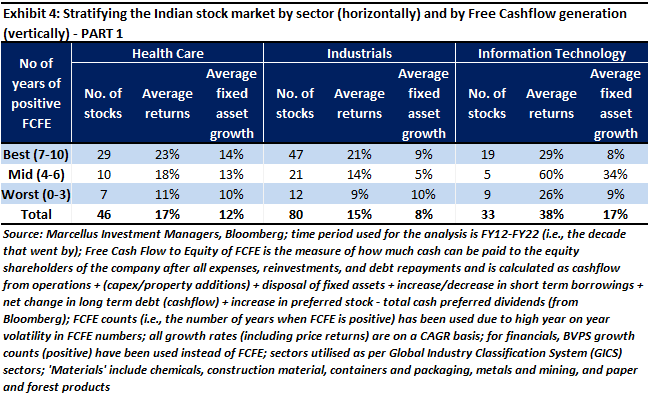
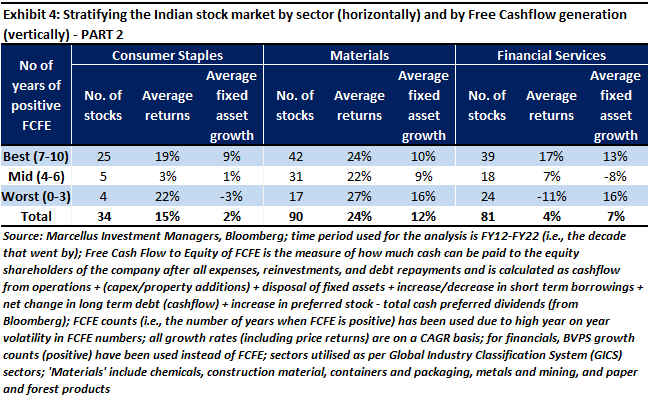
The above exhibits (both PART 1 and 2) demonstrate the ‘capitalism without capital’ dynamic which is now utterly central to shareholder value creation in India:
- Companies that generate Free Cashflow more frequently create more shareholder value. One can see this by comparing the “average returns” of the companies in the top row of the table with the companies in the bottom row – in 4 out of 6 sectors the top row companies generate far more returns that the bottom row companies.
- Companies that grow their fixed assets the most are NOT the companies which generate Free Cashflow most frequently. If one looks at the top row of the table above (i.e., the companies with the most frequent Free Cashflow generation), fixed asset growth is not particularly high for these companies – most of champion Free Cashflow generators have fixed assets growth either in the low teens or in single digits (implying that fixed assets are growing slower than the profits which in turn implies rising ROCEs).
There are primarily three underlying forces that are driving this trend seen across most sectors:
1) Fixed asset growth is increasingly not driving price returns for stocks.If we look at Information Technology (IT) or Consumer Staples sectors and focus on the top row of the above exhibits (both part 1 and 2 of exhibit 4), the fixed asset growth of the leading firms is at best in high single digits. Yet the share prices of these Tech and FMCG firms have compounded consistently at a healthy rate of high teens or early 20% CAGRs.
2) Consistent share price compounding is increasingly attributable to the free cashflows that firms generate.If we look at the top row (i.e., the most reliable free cashflow generators) in exhibit 4 part 1 and 2, returns of these reliable free cashflow generators have consistently been healthy, vis-à-vis the bottom two rungs.
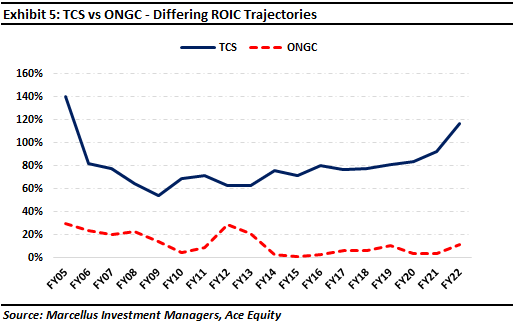
3) Free cashflows are increasingly not explained by fixed assets;they are explained by companies’ investments in intangibles (like incremental investment in Research and Development or R&D, upskilling and training, creating positive feedback loops leading to network effects and so on). Companies that invest in intangibles like these usually end up creating far more wealth than what they invest, which results in superior free cashflow generation as well as profitability. If we look at the TCS and ONGC example once again, their Return on Invested Capital (using ROIC, rather than ROCE, to exclude the impact of cash) differ massively. This massive gap in ROIC is a manifestation of the non-linear benefits accruing to the company that invests heavily in intangibles vis-à-vis one that invests in largely tangible assets (see exhibit below).
Let’s take two more case studies which illustrate beautifully, in the Indian context, how the three underlying forces of the new age capitalism are shaping and helping great franchises steer leaps and bounds ahead of their peers.
Case in point #1: Asian Paints
In 1970, Asian Paints invested Rs 8 crores in the first supercomputer to be purchased by a private-sector enterprise in India. That is the ‘sunk cost’ in this instance. Asian Paints then used this computer to collect detailed data on paint demand – across its vast dealer network, for every colour, for every truckload delivered to every dealer. As a result, Asian Paints’ management developed greater familiarity with understanding and managing data than any other paint company in India. Through the 1980s, 90s, and through to the current day, they fed this data into increasingly sophisticated software platforms such as SAP which helped them predict demand, time their raw material purchases, and manage their inventory and production cycles such that the company’s working capital cycle in its decorative business (i.e., receivables + inventory – trade payables – other current liabilities calculated as days of sales for standalone business) shrank to a mere six days in FY19 from a hundred days 25 years ago. In the last two years, this cycle has increased to about 20-25 days mainly due to higher raw material inventory than normal to address global supply chain disruptions and slightly relaxed credit terms to dealers during covid.
A super crunched working capital cycle gave Asian Paints a massive competitive advantage and far superior free cashflows (7-14x more) compared to its competitors. Asian Paints re-invested these cashflows in expanding capacity (which has grown 15-fold in the last 25 years) and in further technology investments. A case study by BlueYonder (click here), explains how Asian Paints has been using technology to improve various aspects of the business. More recently, the company has forayed into the larger Home Décor space through its home décor stores called ‘Beautiful Home stores’ where it is attempting to use 3D visualization technology as a differentiator vis-à-vis regular home décor stores to help customers make a more informed choice through visualisation.
This dynamic creates a synergistic spiral which makes it impossible for Asian Paints’ competitors to compete with the firm (i.e., Asian Paints has better tech and more data and hence better cashflows which in turn leads to greater tech investments from Asian Paints which in turn leads more cash flow and so on). Thanks to having grown Free Cashflows from Equity (FCFE) by 70x in the last 20 years (i.e., 24% CAGR), Asian Paints has been able to grow TSR by 30% p.a. over that period. Those who don’t understand how tech works in the modern economy won’t understand how Asian Paints drives massive wealth creation. Those investors will continue waiting for the “right entry point” into Asian Paints.
Case in point #2: Bajaj Finance
Fifteen years ago, when most large private sector banks were focused on underwriting only the top of the pyramid customers for unsecured loans, Bajaj Finance started using bureau data, data from other credible sources, and mashing the same with their own proprietary underwriting standards to underwrite small ticket consumer loans.
Bajaj Finance’s competitive advantage now arises from the richness of customer data that it possesses (no other NBFC has data at this scale and with comparable detail), the depth in which the firm’s senior management understand that data (a skill notably lacking in the NBFC sector) and the manner in which the firm’s rigorously groomed middle management takes calibrated judgement calls (which are then automated) in underwriting large sets of customers prudently over the years.
Today, 60-65% of new loans booked by Bajaj Finance are towards its own existing customers. The secret to disproportionately higher profitability is selling multiple products to customers which result in materially lower operating expenses (with customer acquisition expense being zero) and lower credit costs (thanks to learning from the first underwriting experience on a smaller pool of customers). Bajaj Finance has now mastered the art of cross selling and offers more than 40 products catering to almost all the demands of a consumer.
This flywheel of acquiring customers through small ticket consumer loans and then gradually cross selling more products has made Bajaj Finance one of the largest and most diversified NBFCs in India, catering to over 65 mn customers. Over the last 15 years, assets under management, PAT, and TSR have compounded at 35%, 51%, and 42% p.a. respectively, whilst RoEs have remained upwards of 20%.
In contrast, there are several successful companies in India such as ITC which are no longer part of Marcellus’ portfolios, partly because their capital allocation strategy hasn’t created enough space for capitalism without capital to pan out.
Nandita Rajhansa and Saurabh Mukherjea work for Marcellus Investment Managers (www.marcellus.in). Saurabh and Nandita’s families, Saurabh personally and Marcellus’ clients are shareholders in Tata Consultancy Services, Asian Paints, Berger Paints, Divi’s Laboratories, Dr. Lal’s PathLabs, Nestle India, Page Industries, Pidilite Industries, Titan Company, ICICI Bank, HDFC Bank, Bajaj Finance, and Kotak Mahindra Bank.
If you want to read our other published material, please visit https://marcellus.in/blog/
Note: the above material is neither investment research, nor investment advice. Marcellus does not seek payment for or business from this material/email in any shape or form. Marcellus Investment Managers Private Limited (“Marcellus”) is regulated by the Securities and Exchange Board of India (“SEBI”) as a provider of Portfolio Management Services. Marcellus is also a US Securities & Exchange Commission (“US SEC”) registered Investment Advisor. No content of this publication including the performance related information is verified by SEBI or US SEC. If any recipient or reader of this material is based outside India and USA, please note that Marcellus may not be regulated in such jurisdiction and this material is not a solicitation to use Marcellus’s services. This communication is confidential and privileged and is directed to and for the use of the addressee only. The recipient, if not the addressee, should not use this material if erroneously received, and access and use of this material in any manner by anyone other than the addressee is unauthorized. If you are not the intended recipient, please notify the sender by return email and immediately destroy all copies of this message and any attachments and delete it from your computer system, permanently. No liability whatsoever is assumed by Marcellus as a result of the recipient or any other person relying upon the opinion unless otherwise agreed in writing. The recipient acknowledges that Marcellus may be unable to exercise control or ensure or guarantee the integrity of the text of the material/email message and the text is not warranted as to its completeness and accuracy. The material, names and branding of the investment style do not provide any impression or a claim that these products/strategies achieve the respective objectives. Further, past performance is not indicative of future results. Marcellus and/or its associates, the authors of this material (including their relatives) may have financial interest by way of investments in the companies covered in this material. Marcellus does not receive compensation from the companies for their coverage in this material. Marcellus does not provide any market making service to any company covered in this material. In the past 12 months, Marcellus and its associates have never i) managed or co-managed any public offering of securities; ii) have not offered investment banking or merchant banking or brokerage services; or iii) have received any compensation or other benefits from the company or third party in connection with this coverage. Authors of this material have never served the companies in a capacity of a director, officer or an employee.
This material may contain confidential or proprietary information and user shall take prior written consent from Marcellus before any reproduction in any form.