
OVERVIEW
POPULAR ARTICLES
As per data from the Income Tax department, of all Indian companies that filed non-zero tax returns for FY22, only 17% saw growth in PAT in real terms over the preceding ten years. And these 17% accounted for 98% of corporate India’s PAT. Furthermore, data from the CMIE shows that the prospect of upward mobility (in terms of companies moving from a lower profit decile into a higher decile) has diminished steadily over the past decade. However, both datasets show that the fastest growing profit generators in India are NOT in the top 800 companies; instead, it is the 5000 companies BELOW the top 800 which grew profits the fastest between FY13-23 . As the Indian economy stabilizes after successive reform-related and external shocks, these ‘Challenger’ companies are the ones which seem to have adapted most efficiently to the new realities of a networked, consolidated, formalized & competitive free market economy.
“The churning of the ocean of milk, in Hinduism, is one of the central events in the ever-continuing struggle between the devas (gods) and the asuras (demons).
The gods…invited the asuras to help them recover the elixir of immortality, the amrita, from the depths of the cosmic ocean…In the churning of the ocean many wonderful treasures that became the prototypes for their earthly and heavenly counterparts were brought up from the depths: Chandra, the moon… Kamadhenu, the cow of plenty, Madira, the goddess of wine,…Kalpavriksha, the wish-fulfilling tree,…the goddess Lakshmi and Dhanvantari, the physician of the gods, who rose up out of the waters carrying in his hands the supreme treasure, the amrita.” – ‘Sagar Manthan’ as described in ‘Britannica’ (source: https://www.britannica.com/topic/churning-of-the-ocean-of-milk)
Introduction
The pounding of small and medium-sized enterprises in India
The term creative destruction was coined by Austrian economist Joseph Schumpeter in 1942. Schumpeter saw creative destruction as innovations in the manufacturing process that increase productivity. He described it as the “process of industrial mutation that incessantly revolutionizes the economic structure from within, incessantly destroying the old one, incessantly creating a new one.”
As Schumpeter explained in his book ‘Capitalism, Socialism & Democracy’, the theory of creative destruction assumes that long-standing arrangements and assumptions must be destroyed to free up resources and energy to be deployed for innovation. In this mental model of how capitalism works to create a more efficient economy, economic development is the natural result of forces internal to the market and is created by the opportunity to seek profit. If Schumpeter were alive, he would say that what has transpired in corporate India over the past decade is the epitome of creative destruction.
If we were to look at the data regarding corporate income taxes paid by Indian companies from FY12 to FY22, the latest year for which stratified income data from the Income Tax department is available:
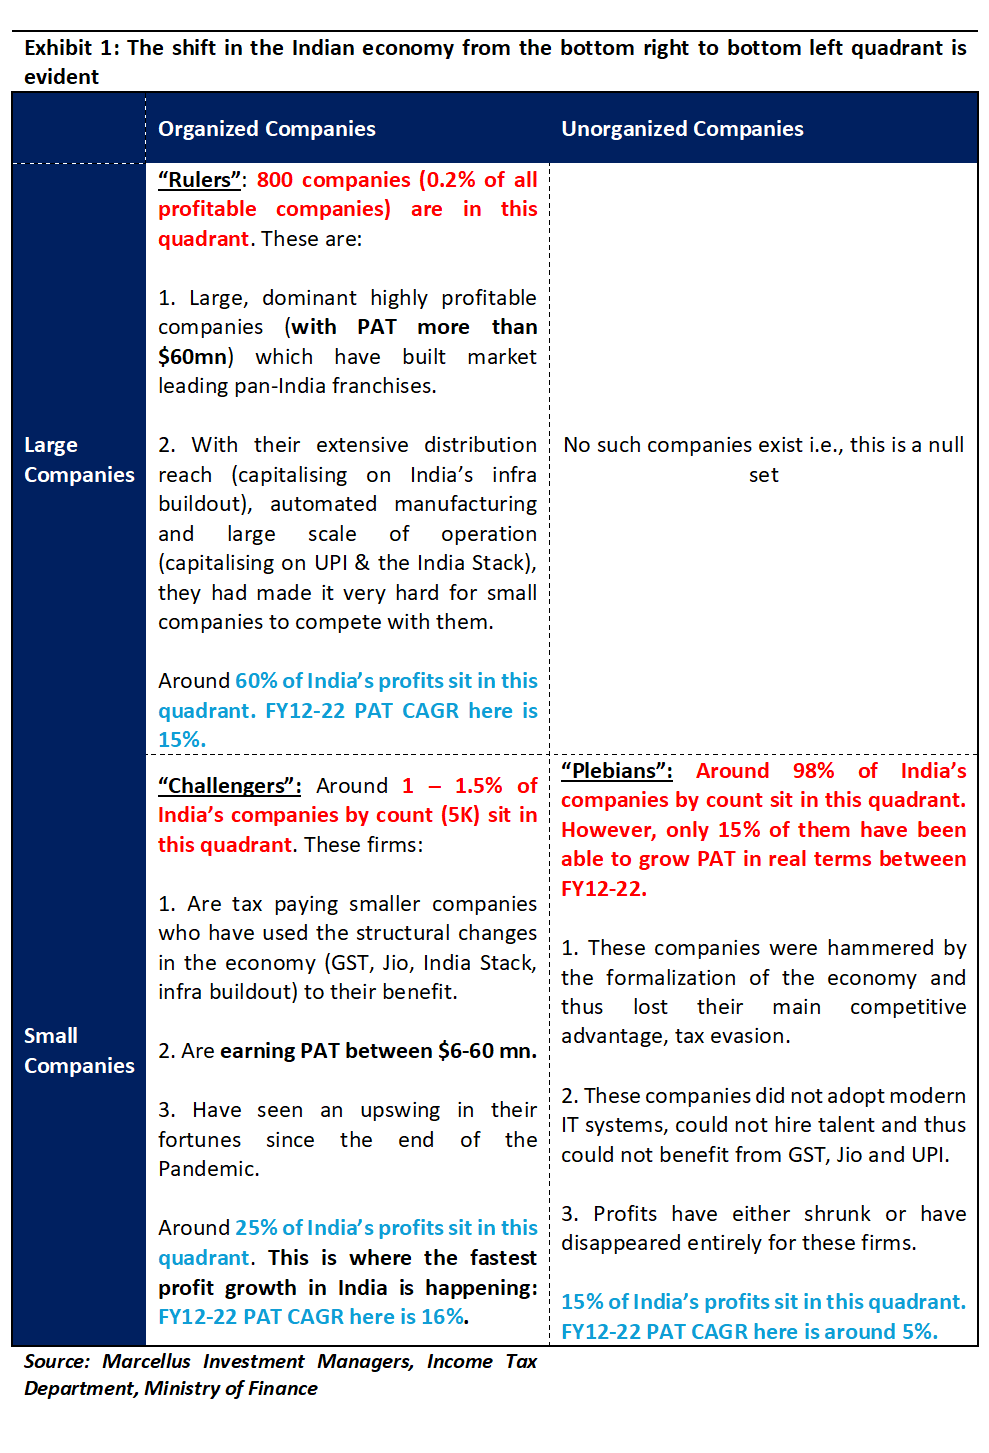
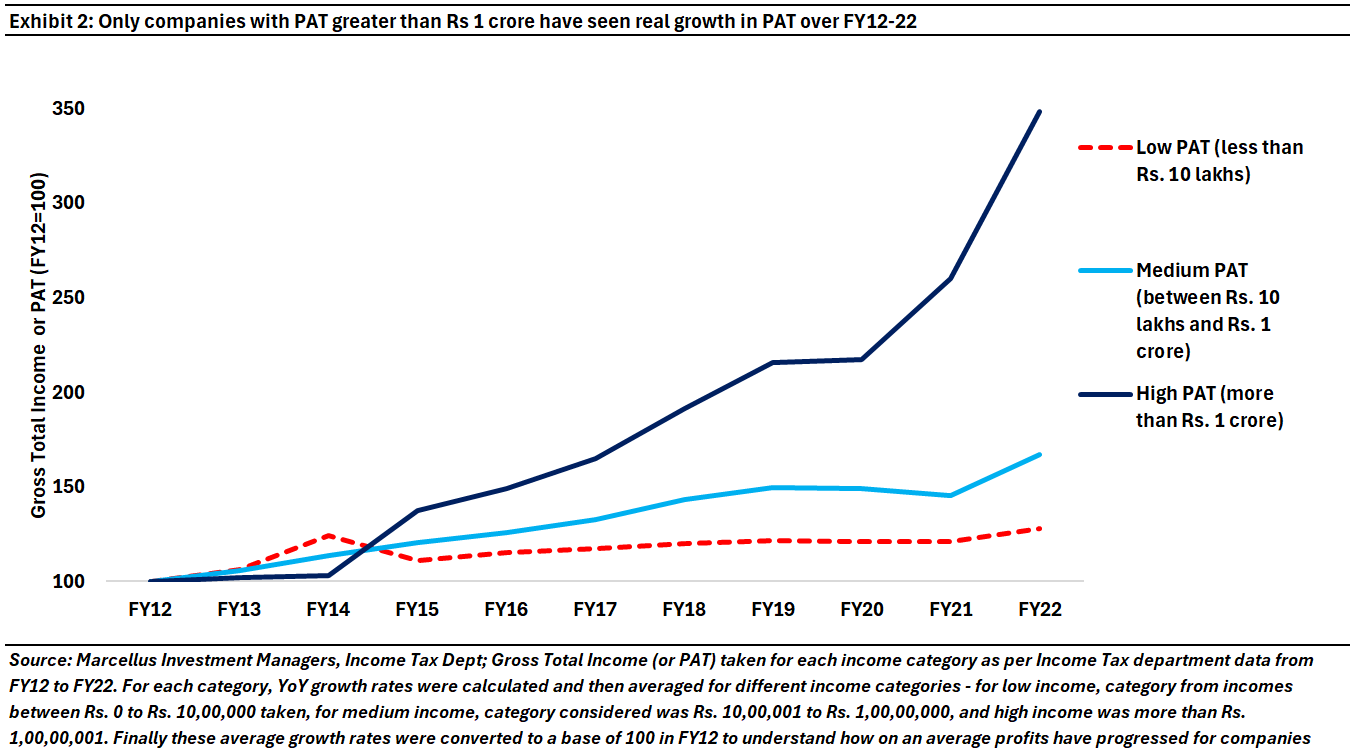
- The highest profit generators in the country i.e., companies with average PAT of Rs. 1 crore or more have been able to grow their profits the fastest over the last decade (see exhibit below). Profit growth for such companies between FY12-22 has been at a CAGR of 13%. Around 17% of India’s non-zero tax filing companies fall in this bucket, and they account for 98% of the country’s profit pie as of FY22. [In exhibit 1 this includes the Rulers, the Challengers and the top 15% of the Plebians.]
- Mid-sized companies i.e., companies with average PAT between Rs. 10 lakhs – 1 crore have done worse. Their profits grew at a CAGR of just 5% between FY12-22 implying that in real terms (i.e., after adjusting for inflation), these companies did not any growth in profitability over the ten year period. Around 28% of India’s non-zero tax filing companies fall in this bucket, and they account of 1.4% of the country’s profit pie as of FY22. [In exhibit 1 these companies account for 30% of the Plebians.
- Small companies i.e., those generating PAT of less than Rs. 10 lakhs p.a. have fared the worst. Their profits grew by a mere 2% over FY12-22 (see appendix for more details on this) implying that in real terms their profits shrank dramatically over the course of the decade. Around 55% of India’s non-zero tax filing companies fall in this bucket, and they account of 0.2% of the country’s profit pie as of FY22. [In exhibit 1 these companies account for the bottom 50% of the Plebians.](The source of the underlying data is Income Tax Department, Ministry of Finance, Government of India)
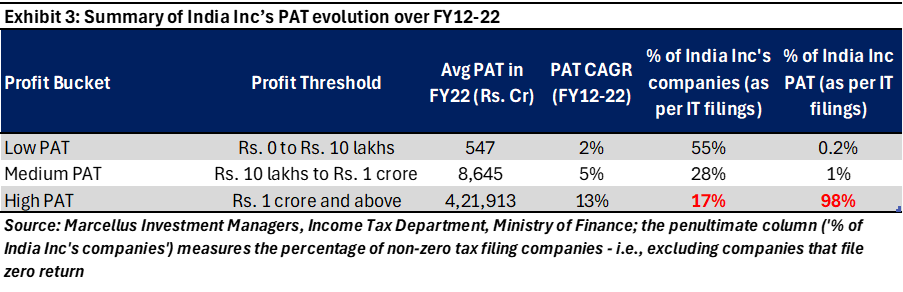
In short, the Income Tax department data suggests that only the most profitable 17% of India’s 4.25 lakh companies which filed non-zero tax returns in FY22 saw growth in PAT in real terms over the preceding ten years.
However, the Income Tax data has several limitations, not least that over time, companies are bound to move across profit buckets. Hence comparing profit growth in any of the buckets over time is not an apples vs apples comparison. For example, the list of companies in the “high PAT” bucket (Rs 1 crore or more) in FY22 could be very different to what it was in FY19. Hence the fact that the high PAT bucket line is soaring could be a result of the survivorship bias inherent in the way such exercises are conducted rather than genuinely strong PAT growth in the ‘high PAT’ bucket.
To mitigate this bias, we looked for other ways to understand how India Inc has fared with the most recently available data. This search led us to a dataset provided by the Centre for Monitoring Indian Economy (CMIE). To be specific, this CMIE dataset has data on approximately 30K active companies in India on an average for each of the past ten years up to FY23. By construction therefore, the CMIE database has survivorship bias in its lowest deciles i.e., smaller companies who have fallen behind in profitability over the past decade are unlikely to be captured fully in the CMIE dataset. However, since this is the only time series dataset we could find on how India Inc’s profits have evolved over the past decade, we decided to proceed further with analysis on the CMIE database.
We began by deciling these 30K companies into 10 buckets according to their PAT, with D1 containing the highest profit earners and D10 the worst loss makers. Then we looked at the probability of upward movement (i.e., improvement in decile ranking, for instance, the probability of companies categorized as D8 shifting to any decile above D5). To minimize year-to-year noise in the data, we conducted this analysis of upward movement by using rolling three-year time periods i.e., FY13-16, FY14-17 and so on.
We found that notwithstanding the massive survivorship bias in the lower deciles (on account of many companies shuttering in the country each year ), the probability of upward mobility in terms of profit deciles reduced over the years secularly for most deciles. To be specific, for most deciles in the latest 3-year iteration (FY20-23 i.e., the post Covid period in which the Indian economy has recovered strongly), the probability of a company in a lower decile moving into a higher decile over a three year period is in single digits (see exhibit below). As the exhibit below shows, if one ignores decile 9 & 10 (given that these are the deciles most likely to be characterized by survivorship bias), for all the other deciles the prospect of upward mobility (in terms of moving into a higher profitability decile) has diminished steadily over the past decade.

Dawn of a new, more Schumpeterian era for India Inc
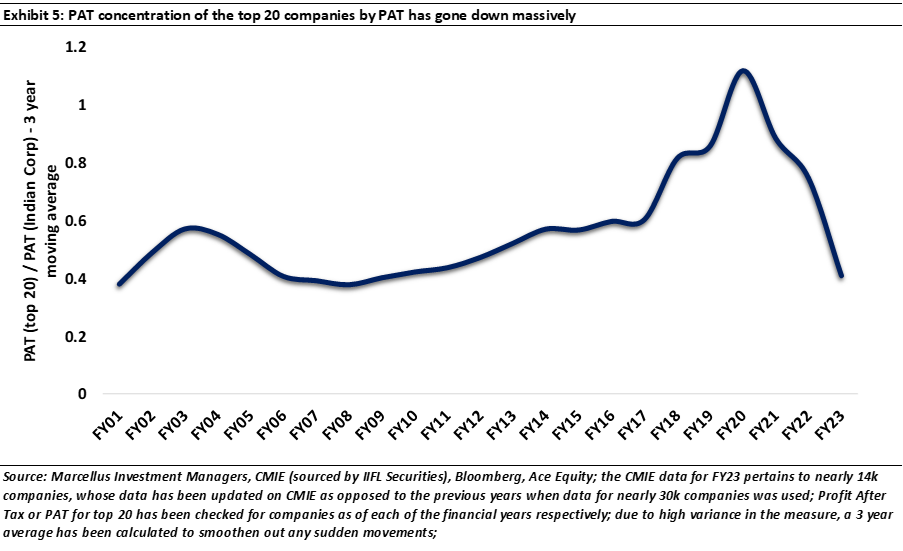
In many ways, the Income Tax department data and the CMIE data are consistent with what we have found from our previous number crunching exercises. To be specific, a decade ago, the 20 most profitable companies in India accounted for nearly 70% of the entire profit pool in the country, up from just 14% thirty years ago (see https://marcellus.in/blogs/behold-the-leviathan-the-remaking-of-indian-capitalism/ ). In fact, as we moved forward in time from FY09 onwards, the profit share of the 20 most profitable companies in India, rose from 40% to north of 100% at the height of the Covid-crisis. This trend of the “large getting larger” is now corroborated by our findings from the CMIE data crunch which shows that it has become progressively harder for smaller companies to move upwards in terms of profitability.
However, there is a silver lining in this. As can be seen in the exhibit below, in the post-Covid world, the profit share of the 20 most profitable companies has dropped from 100%+ to 40% implying that smaller companies have successfully pulled away profits from the top 20 giants of India Inc. This raises two questions:
- Does the CMIE data corroborate this finding of smaller companies doing better in post-Covid India?
- Why are smaller companies doing better in terms of demonstrating upward mobility on profitability in post-Covid India?
In the rest of this blog, we have focused on answering these two questions.
To answer the first question, we conducted a final layer of analysis. We looked at companies at intervals of three years and kept the deciles basis PAT constant for those 3 years. This essentially means that corporate mobility across PAT deciles is NOT allowed within the 3-year period. So, for example, if a company is in decile 7 at the beginning of the 3-year period, then it is tagged as a “decile 7” company for the entirety of the three-year crunch [even though by the third year the company might have graduated to a higher (or lower) decile].
This analysis showed that:
- Decile 2, i.e., the companies one rung below the most profitable decile have performed the best in terms of profit growth (see exhibit below).
- Beyond decile 4, there are not enough observations due to the companies in those deciles clocking up incremental losses (and therefore sliding rapidly down the profitability pecking order).
- Life in Deciles 3 and 4 is also tough. In fact, profits in these deciles appear to have halved over the previous decade pointing to severe churn in the ranks of corporate India.
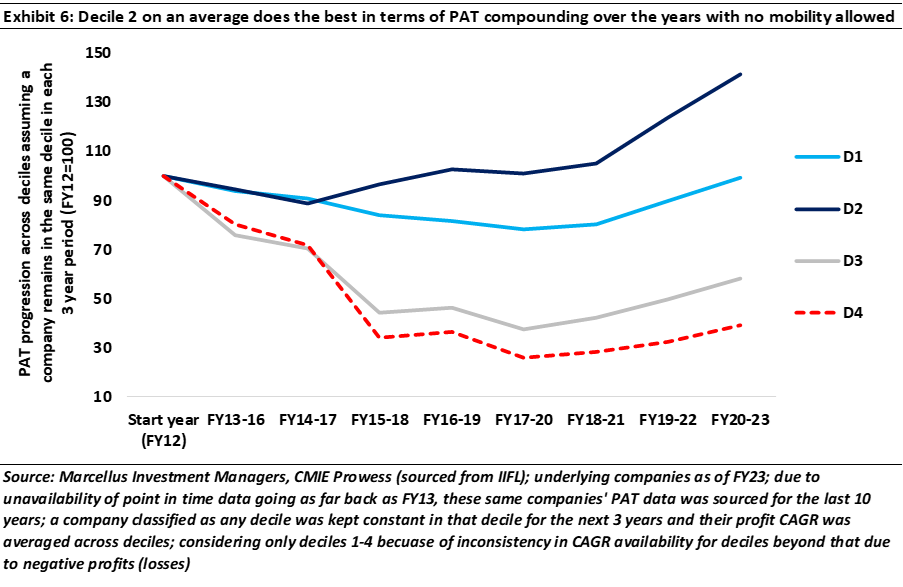
What exhibit 6 shows is that the best companies are rising through the ranks and making their mark felt. In a development which would have delighted Joseph Schumpeter, the most efficient, the most hardworking of the smaller companies appear to be ascending towards the higher PAT deciles. On the other hand, most of the smaller companies are being left as the Indian economy becomes larger, more efficient and more competitive. That leads us to the question of what is going on in the underlying economy to create these divergent trends.
The “joining up” of India has created opportunities for the best vs stress for the rest
Imagine a village economy cut off from the whole world with no road or telecom connectivity to the rest of the world. In such a village, a range of smaller businesses such as the barber, the greengrocer, the butcher, the blacksmith, the moneylender, etc will build profitable local monopolies.
Now imagine that one fine day this village gets road & telephone connectivity to the nearest large city which is ten kilometers away. What is likely to happen now is:
- The most profitable and most enterprising companies in the village will set up branch operations in the large city and if they prosper there, they will repatriate some profits back to the native village to scale-up the village enterprise thereby grabbing profit share in their native village
- Aggressive companies from the large city will enter the village and offer lower prices alongside better products to the villagers. This will lead to many of the village enterprises shuttering down as they won’t have the technology, the expertise and the scale of the big city competitors.
- Over time, the number of companies in the village will shrink both due: (a) consolidation in each sector in the village as the smaller village enterprises struggle to survive; and (b) due to exports from the big city of many of the products that the villagers need for their lives.
In very simple terms, this is what has happened in India over the past decade. The nation has gone from being a village-like economy (with poor connectivity and lots of small enterprises) to a big-city integration with the village (or invasion of the village, depending on your point of view) as connectivity improved and on a bigger, pan-India canvas more efficient companies grabbed profit share and, in doing so, decimated the profits of their less efficient competitors.
The joining up of India took place digitally (through the advent of Jan Dhan bank accounts, Aadhaar, Jio and UPI) which in turn made accessibility to markets, payment systems and information less asymmetric. Post-2017 this intertwined with GST and with the doubling of the national highway network to deliver a transformational change in the economic landscape, one which a few companies were able to seize but most were overwhelmed by (see https://marcellus.in/blogs/the-underdog-ascends-the-rise-of-a-new-indian-elite/).
A set of three effects has driven this rise in democratization of profits
The improvement in the fortunes of the small yet efficient companies has been a relatively recent phenomenon which has emerged over the past decade. As with any economic reform, it takes time before the fruits of the policy change start showing impact in the broader economy. We reckon, this has started happening, especially in the post-Covid era when the tumult created by economic reforms (banking sector cleanup in 2015-17, GST implementation in 2018 and so on) largely dissipated, paving way for a golden era for smaller companies. More specifically, there have been three distinct effects that have emerged in the last decade which has ushered in this new era of increased efficiency for small companies (“the Challengers”) and rising competition for large companies (“the Rulers”).
Effect #1: The fall of the tax evading and inefficient small companies
With the onset of banking system cleanup triggered by the then RBI governor Raghuram Rajan in 2015 via the Asset Quality Review, followed by the introduction of the Insolvency & Bankruptcy Code (IBC) in 2017 and implementation of GST in 2018, many small tax evading, and inefficient companies got decimated. The adverse situation of such companies was further exacerbated by Covid related lockdowns and disruptions. This cocktail of adversities hammered the bottom 50% of “the Plebians”.
This cleanup of the system was brutal and yet essential for the dawn of an era where the next effect started playing out.
Effect #2: The rise of the nimble and efficient small companies
As the country’s inefficient smaller companies got battered on account of structural economic reforms, a breed of companies within this cohort not only survived this pounding, but emerged in the past-Covid world with sparkling growth in profits. These companies – the 5,000 “Challengers” companies in our analysis – invested in modern technology, went online, embraced UPI & the India Stack, improved their product quality and their efficiency and have managed to become profitable in the new and increasingly formalized Indian economy.
This robust effect #2, we reckon, is a precursor to a larger effect #3 which could prove to be transformational over the coming years.
Effect #3: Challenging the existing behemoths
As these small, fast growing, efficient “Challengers” keep growing, they are creating intense competition for the larger competitors who have enjoyed a position of sustained power in the economy for decades now. In the years to come, these smaller companies with their superior business models and greater operational efficiency are likely to challenge the market leaders and seek to grab significant profit share.
To summarize the three effects and understand how the changes have played out, let’s look at a 2×2 matrix, where on one axis we have size of companies (large & small), and on the other their nature of business (organized & unorganized) – see exhibit below.
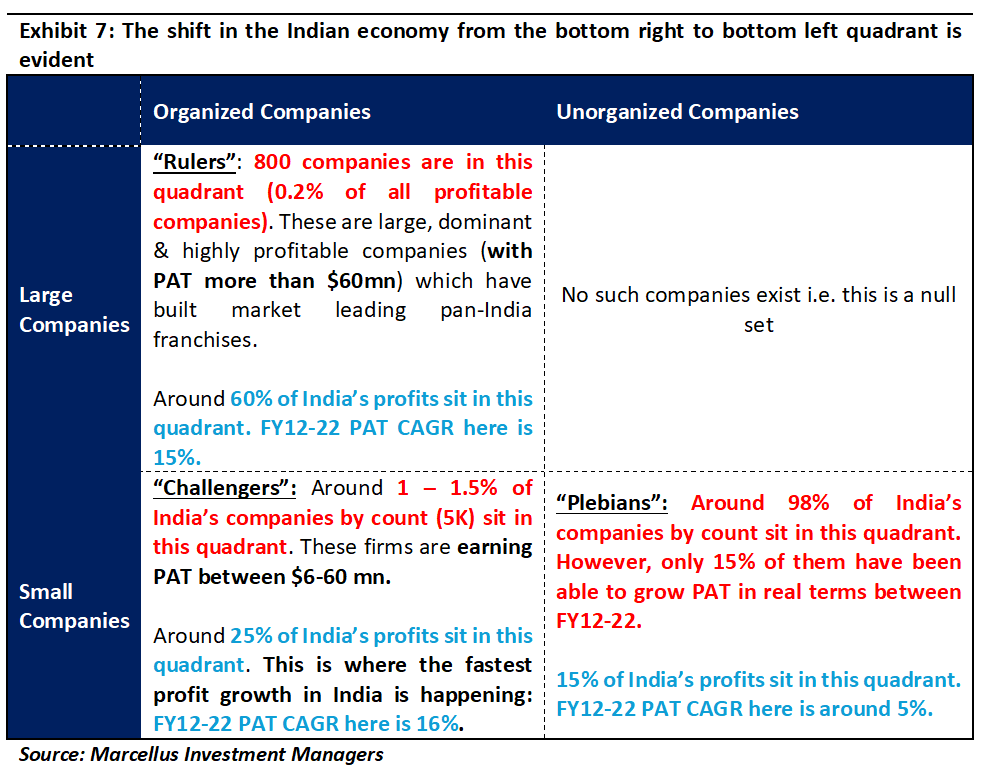
A simple way to understand the transition underway in the Indian economy is to see how corporate realities have changed in context of the above matrix. Most Indian companies started off in the bottom right quadrant (effect #1), and have now shifted to the bottom left quadrant (effect #2). The next step will be a shift of the fittest smaller companies from the bottom left to the top left quadrant (effect #3). Two cases studies help contextualize how these effects are playing out in contemporary India.
Case study #1 of a “Challenger” ecosystem: Tamil Nadu – a microcosm of modern India’s changing fortunes
Roughly 500 km southwest of Chennai is the thriving city of Coimbatore. Coimbatore is large enough to be called a city, yet not large enough to be a Tier 1 city. Yet what distinguishes Coimbatore from other major cities in north India and perhaps even in Tamil Nadu’s neighboring states is its thriving industry ranging from spinning mills to engineering goods (from castings, textile machinery and auto components to pump sets and wet grinders). Started by the local Kammavar Naidus, these industries have become quite entrenched in the local fabric of this city, making it a buzzing hub of entrepreneurial and industrious activity.
However, what is even more interesting is that Coimbatore isn’t the only such city or town in the state that showcases entrenched entrepreneurial values and resultantly, thriving industries. Nearby towns of Tirupur, Erode, Salem, Namakkal, Karur etc. also have industry and small capitalist clusters of the Kongu Vellalar or Gounders. In fact, the Kammavar Naidus own companies like Suguna Foods, Elgi Equipment, and Lakshmi Machine Works, names that resonate not just within Tamil Nadu but pan India.
Successful small-medium sized businesses (of the bottom left quadrant variety), as opposed to colossal conglomerates (from the top left quadrant) found in Mumbai, have become the mainstay of the Tamil Nadu economy. As a result, the contributors of Gross Valued Added (GVA) for Tamil Nadu are more broad-based and diversified than rest of India. For instance, GVA from Industry contributes roughly 23% to Tamil Nadu’s total GVA while employing 18% of the total workforce of the state. The same figures for India are 19% and 12%, respectively. (to read more about this, see https://indianexpress.com/article/explained/explained-economics/explained-tamil-nadus-decentralised-industrialisation-model-9272702/).
Case study #2 of a “Challenger”: A startup in suburban Mumbai which moved from the bottom right to the bottom left quadrant
Emblematic of the changes that are sweeping across India, is the rise of a small company situated in the semi-industrial Mumbai suburb of Andheri East. Founded in 2018 with a paid-up capital of Rs 8 crores (or $1 mn) and loss of Rs. 1.5 crores in its first year of operation, this company focused on providing Portfolio Management Services to affluent Indian families spread across India’s metros and Tier 1 & 2 cities. With 400+ companies operating in the Portfolio Management industry, this start-up had its work cut out for it given that it takes decades to build a brand & a good reputation amongst affluent Indian families.
Cut to the present day, as of FY24, this firm has Assets Under Management of US$ 1 billion and PAT of Rs. 30 crores. The name of the start-up as many of you would have guessed is Marcellus Investment Managers, a company founded with its shareholders’ lifetime’s savings. Early investments in talent (rank holding Chartered Accountants & Engineers, award winning analysts), in state-of-the-art technology (Salesforce for CRM, WealthSpectrum for Fund Operations, Bloomberg for trading) and in IP (bestselling books, proprietary forensic databases) helped Marcellus overcome formidable challenges and go from losses in its first couple of years to strong profitability from its third year onwards. It is this combination of capital and knowhow that tens of thousands of small businesses in India need to shift from the bottom right to the bottom right left quadrant in Exhibit 7.
Nandita Rajhansa and Saurabh Mukherjea work for Marcellus Investment Managers (www.marcellus.in).
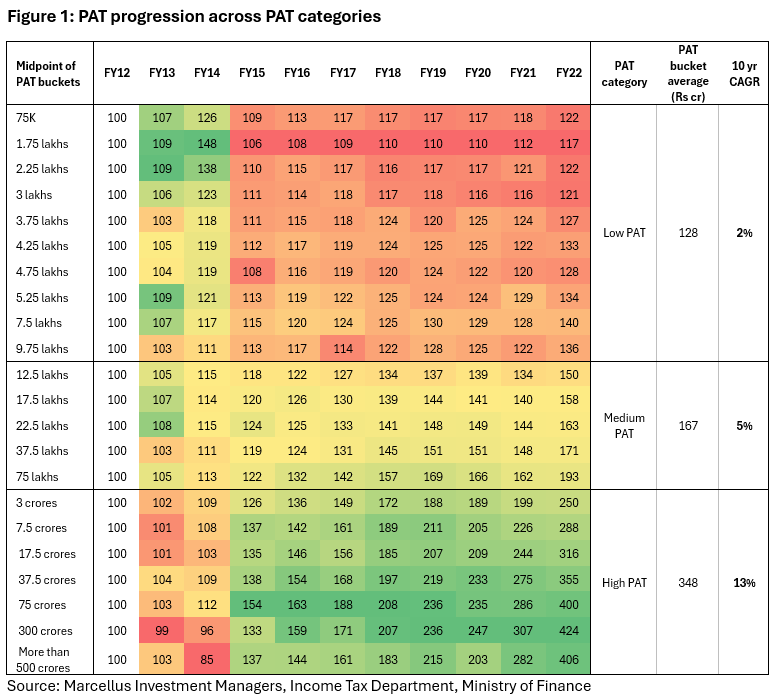
Method to read Figure 1
- Midpoint of PAT buckets refer to the central point of each of the income buckets as reported by the Income Tax Department. For instance, the midpoint of Rs. 75k refers to the bucket of Rs. 0 to Rs. 1.5 lakhs.
- The first column (FY12) is when the data begins and has been normalized to 100. Subsequently the entries are just the growth over this normalized figure. The underlying data is sum of gross total income (or PAT) for each PAT bucket as reported by the Income Tax Department. Underlying data as per Income Tax Department was stated in Rs. Crores.
- We then classified each of the income or PAT buckets into 3 super segments basis a simple heuristic – PAT from Rs. 0 to Rs. 10 lakhs is low PAT, from Rs. 10 lakhs to Rs. 1 crore is medium PAT, and Rs. 1 crore onwards is high PAT.
- The indexed numbers (starting from 100 in FY12) are then averaged across these 3 super segments in FY22. These are used to calculate the 10-year CAGR for each super segment, assuming the starting point is the same (100) for all.
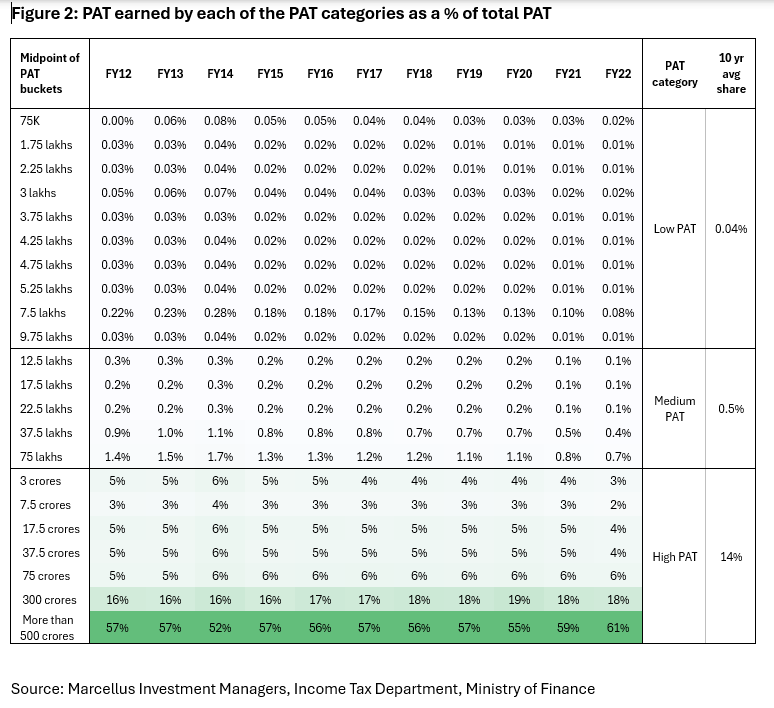
Method to read Figure 2
- Midpoint of PAT buckets refer to the central point of each of the income buckets as reported by the Income Tax Department. For instance, the midpoint of Rs. 75k refers to the bucket of Rs. 0 to Rs. 1.5 lakhs.
- The columns named FY12 to FY22 are simply the summation of gross total income (or PAT) in each bucket (as reported by the Income Tax Department) as a percentage of the total gross income for each year across buckets. For example, the cell of Rs. 75k in FY12 is just the summation of PAT in that bucket as a percentage of the total PAT in FY12 column.
- Using the same labelling for PAT buckets as mentioned in the method for Figure 1, an average across the percentages for the last 10 years was calculated, presented in the right most column of the table.
Note: the above material is neither investment research, nor investment advice. Marcellus does not seek payment for or business from this material/email in any shape or form. Marcellus Investment Managers Private Limited (“Marcellus”) is regulated by the Securities and Exchange Board of India (“SEBI”) as a provider of Portfolio Management Services. Marcellus is also a US Securities & Exchange Commission (“US SEC”) registered Investment Advisor. No content of this publication including the performance related information is verified by SEBI or US SEC. If any recipient or reader of this material is based outside India and USA, please note that Marcellus may not be regulated in such jurisdiction and this material is not a solicitation to use Marcellus’s services. All recipients of this material must before dealing and or transacting in any of the products and services referred to in this material must make their own investigation, seek appropriate professional advice. This communication is confidential and privileged and is directed to and for the use of the addressee only. The recipient, if not the addressee, should not use this material if erroneously received, and access and use of this material in any manner by anyone other than the addressee is unauthorized. If you are not the intended recipient, please notify the sender by return email and immediately destroy all copies of this message and any attachments and delete it from your computer system, permanently. No liability whatsoever is assumed by Marcellus as a result of the recipient or any other person relying upon the opinion unless otherwise agreed in writing. The recipient acknowledges that Marcellus may be unable to exercise control or ensure or guarantee the integrity of the text of the material/email message and the text is not warranted as to its completeness and accuracy. The material, names and branding of the investment style do not provide any impression or a claim that these products/strategies achieve the respective objectives. Further, past performance is not indicative of future results. Marcellus and/or its associates, the authors of this material (including their relatives) may have financial interest by way of investments in the companies covered in this material. Marcellus does not receive compensation from the companies for their coverage in this material. Marcellus does not provide any market making service to any company covered in this material. In the past 12 months, Marcellus and its associates have never i) managed or co-managed any public offering of securities; ii) have not offered investment banking or merchant banking or brokerage services; or iii) have received any compensation or other benefits from the company or third party in connection with this coverage. Authors of this material have never served the companies in a capacity of a director, officer, or an employee. This material may contain confidential or proprietary information and user shall take prior written consent from Marcellus before any reproduction in any form.