
OVERVIEW
POPULAR ARTICLES
Whilst capitalism without capital, i.e., the growing prominence of companies who are plays on intellectual rather than physical assets, became established in the developed economies a generation ago, it’s now increasingly prominent amongst Indian companies, both large and small. Specifically, the fastest growth in PAT in the last 10 years has been in decile 2 companies in India Inc (where deciles are created basis level of PAT), whilst the fastest growth in capex has been observed in decile 1 companies. More interestingly, the gap between the two deciles, both on capex and PAT growth has been widening, suggesting that decile 2 companies are demonstrating the classic ‘capitalism without capital’ trait of increasing returns to scale.
“…the owners of tangible capital, such as real estate companies and vehicle lessors, no longer derive control of business from that ownership…The twenty-first-century corporation is defined by these human capabilities, not its physical capital. The successful firm builds distinctive capabilities and distinctive collections and combinations of capabilities – capabilities such as supplier or customer relationships, technical and business process innovations, brands, reputations and user networks. These things can only be – at most – approximately replicated by competitors” – John Kay in his book The Corporation in the Twenty First Century: Why (almost) everything we are told about business is wrong (2024).
An introduction to the changing nature of capitalism
‘Capitalism Without Capital’ became the dominant corporate paradigm in the developed economies around a generation ago. Given that India’s per capita income is 1/20th that of the advanced economies, a generation on “Capitalism Without Capital” is on its way to becoming the dominant corporate paradigm in India.
In the decade ending FY14, approximately 50% of the ten biggest wealth creators in the Indian stock market belonged to industries and sectors that require heavy investment in physical capital (see the left column of Exhibit 2).
Fast forward to the decade ending FY24 and we see that 70% of the top 10 wealth generators in the BSE500 are companies that are low on capex in physical assets (firms like TCS, Infosys, HDFC Bank, ICICI Bank, Bajaj Finance etc). These companies are plays not on “tangible” assets, but on “intangible” assets such as intellectual property embedded in their software and in their smartly crafted business processes aided by network effects.
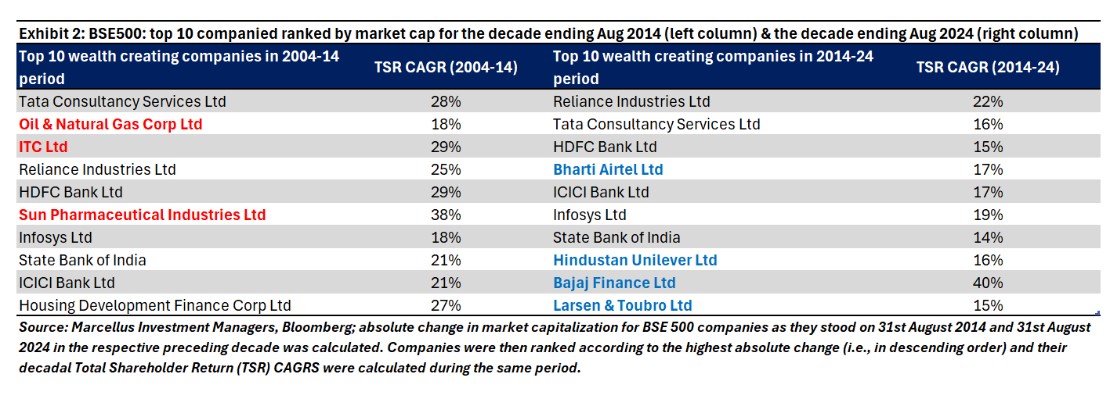
Even as the Indian stock market has become the best performing large stock market in the world over the last two decades (with 20 year US$ returns for the Nifty50 being around 13%), the nature of Indian capitalism has changed radically. The most visible manifestation of this is the leaderboard of the Indian stock market as shown in the exhibit above If you compare the ten largest generators of shareholder wealth (as measured in Rs mn) in the decade ending in 2014 vs the corresponding leaders for the decade ending in 2024, three clear messages jump out:
- Firstly, two companies in the ‘top 10’ which exemplify classical capitalism – ITC and ONGC – exited the top 10 list. In the context of the Indian economy, both companies remain dominant in their core activity – selling cigarettes in ITC’s case and drilling for oil & gas in ONGC’s case. However, the Indian stock market no longer gives generous valuations to such activities given the finite nature of the returns associated with such activities.
- Secondly, amongst the four entrants into the top 10 – Bharti Airtel, Bajaj Finance, Hindustan Unilever, and L&T – whilst Bharti Airtel is the biggest generator of shareholder wealth in absolute terms, the star by far is Bajaj Finance with 40% compounded annual growth in total shareholder value. As we discuss in our podcast for Spotify , the rise of a Bajaj Finance and the dominance of TCS, underpinned as it is by the clever use of technology & talent, exemplifies the changing construct of Indian capitalism. All the entries and exits in the above table are marked in boldface.
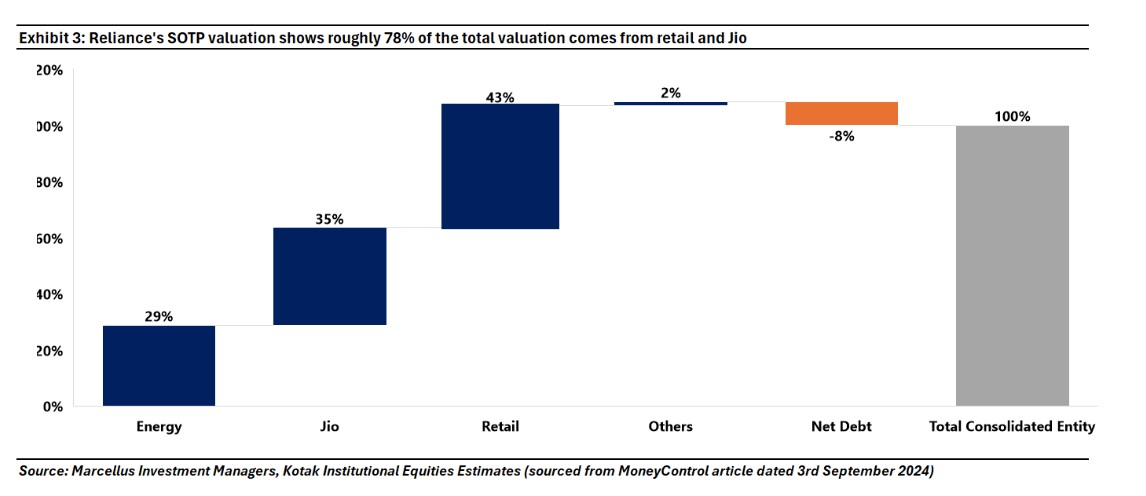
- Thirdly, even as Reliance Industries (RIL) features in the upper echelons of the “top 10” tables in both decades, the behemoth has seen dramatic changes in its business over the past decade, changes which exemplify the broader change in the nature of Indian capitalism. In 2014, RIL’s entire valuation was driven by its refining & petrochemicals business. As shown in Exhibit 3, more than a third of RIL’s valuation in 2024 is driven primarily by its investment in Jio, its tech & telecoms network.
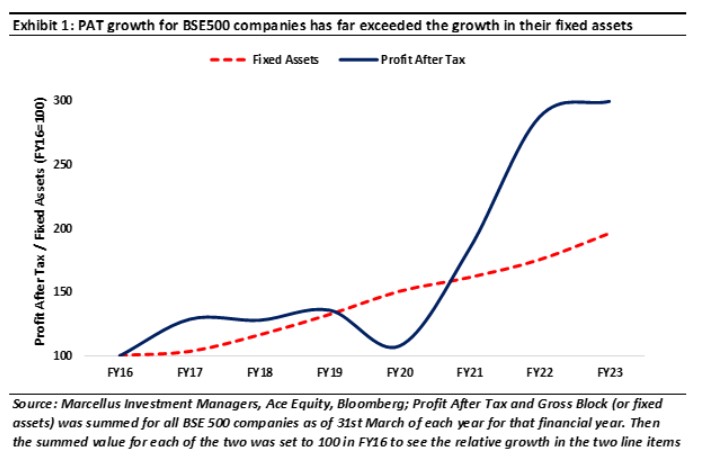
More generally, leaving aside the top 10 and focusing on the broader listed space, the combined net profit of listed non-Financials companies has witnessed a CAGR of 32.4% since FY20 (compared to 7.4% CAGR between FY14-19). On the other hand, the corresponding growth in corporate investment in fixed assets for the same set has grown at a CAGR of 8.6% during FY20-24, almost at the same level as the CAGR between FY14-19 of 8.5%
Interestingly, not only has “Capitalism Without Capital” taken root in the largest Indian corporates but also in smaller firms. As per data from the Income Tax department, of all Indian companies that filed non-zero tax returns for FY23, only 17% saw growth in PAT in real terms over the preceding ten years. And these 17% accounted for more than 98% of corporate India’s PAT. Furthermore, data from the CMIE shows that the prospect of upward mobility (in terms of companies moving from a lower profit decile into a higher decile) has diminished steadily over the past decade. However, both datasets show that the fastest growing profit generators in India are NOT in the top 900 companies; instead, it is the 6000 companies BELOW the top 900 which grew profits the fastest between FY13-23.
However, if we were to look at the CMIE data for growth in profits and in fixed investment (as a proxy for capex) for ~40K companies that they have data for, a very different trend emerges. We have deciled companies by the level of their PAT across the years (~2.5-3K companies in each decile) and then looked at: (a) their PAT growth according to these deciles; and (b) the growth in their fixed assets using the same deciles.
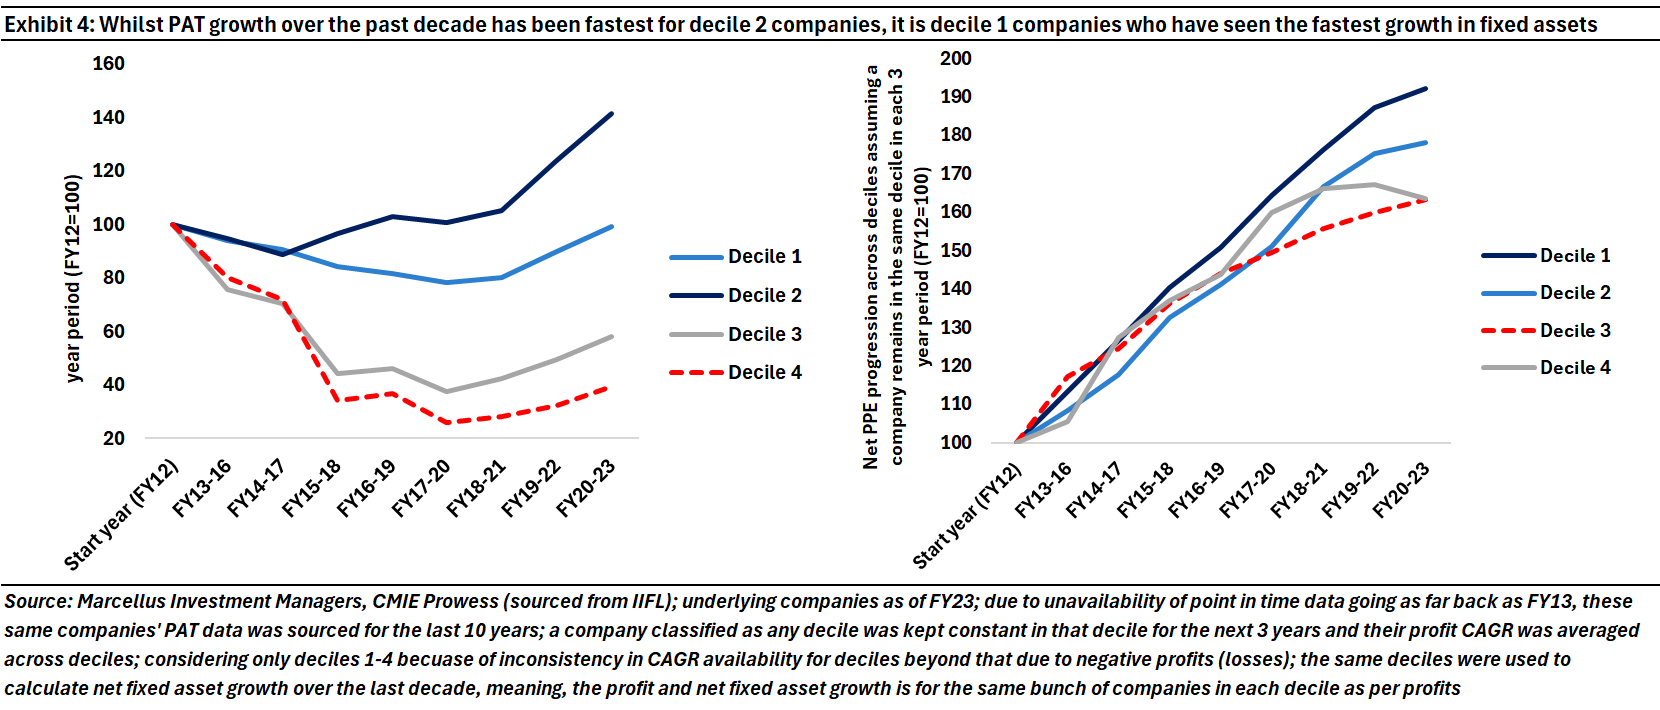
The two charts above show that in India today, capex in the traditional sense (or investment in tangible assets) does not translate into higher profit growth or conversely, higher profit growth does not necessarily lead to higher investment in tangible assets.
So, what exactly has led to the emergence of this trend in India – in both large & small companies – of outsized growth in profits relative to more modest growth in fixed assets?
The rise of ‘Capitalism Without Capital’ in India
“Investment is one of the most important activities in the economy. But over the past thirty years, the nature of investment has changed…The type of investment that has risen inexorably is intangible: investment in ideas, in knowledge, in aesthetic content, in software, in brands, in networks and relationships.” – Jonathan Haskel and Stian Westlake in their book Capitalism Without Capital: The Rise of the Intangible Economy (2018)
Sunk costs drive industry concentration
In 1991, John Sutton of the London School of Economics wrote a prescient book titled ‘Sunk Costs and Market Structure’ which foresaw how the application of modern marketing techniques, of R&D, and of technology was going to lead to polarisation of profits. Sutton said that companies which invest in brand building and in R&D – basically, invest in intangible assets which are critical sources of competitive advantage – go on to dominate that industry, provided intangible assets are a source of competitive advantage in that industry i.e., this theory is not applicable to sectors like cement and steel where intangibles confer little by way of competitive advantage. The technical name of such investments in intangibles is “Endogenous Sunk Costs” (ESC) and Sutton said that in in absence of ESC, an industry would see tough price-based competition [which is exactly what we see in sectors like steel, cement, construction, and wherever else intangibles don’t matter].
Companies that invest in technology benefit from increasing returns to scale
Sutton’s book was followed by a remarkable paper published in 1996 in the Harvard Business Review by Brian Arthur. Titled ‘Increasing returns and the new world of business’, Arthur highlighted that the conventional idea of diminishing returns to scale is being replaced by businesses that are generating increasing returns to scale. Increasing returns basically mean the tendency of returns (on the goods produced or the services provided) to keep increasing as output increases whereas diminishing returns imply the opposite. In Arthur’s words: “As the economy shifts steadily away from the brute force of things into the powers of mind, from resource-based bulk processing into knowledge-based design and reproduction, so it is shifting from a base of diminishing returns to one of increasing returns. A new economics—one very different from that in the textbooks—now applies, and nowhere is this more true than in high technology. Success will strongly favor those who understand this new way of thinking.”
Tying this idea to what Sutton had said in 1991, several management gurus then pointed out in the years that followed that the nature of goods that are produced has changed radically from being bulk-produced and process-driven to increasingly being technology driven and customized to a greater extent. This enables a positive feedback loop in the economy where one set of, say algorithms, once developed by someone can be applied to numerous other functions by tweaking them slightly at no extra cost, essentially making the idea of marginal cost of production (the cost to produce one additional unit) redundant. Therefore, once returns start accruing for such companies, they continue to grow over time at an increasing rate. Microsoft’s Windows operating system became the classic example of this sort of product. Because of the ease of use and sheer computational power of the operating system, a lot of people end up using it. Because they use it, the people who interact with them would also want to use it for seamless collaboration. This creates a positive feedback loop which feeds into itself and creates strong network effects that results in Windows being the most preferred operating system.
Growth in profitability is increasingly NOT related to traditional capex.
Jonathan Haskel & Stian Westlake then developed this line of thinking further in their 2017 book “Capitalism Without Capital”. The central theme of the book is that corporate investments, in the past 40 years especially, have become increasingly intangible rather than tangible. Aggregating data for the developed world, the authors show that around the turn of the century, the developed economies started investing more in intangibles (which traditional accounting techniques do NOT capture as capex) and less in tangibles (like factories & machines). The pre-eminence of intangible investing according to the authors have brought to the fore four effects that intangible assets showcase:
Scale: intangibles are easily scalable to any length once developed initially,
· Sunk costs: intangibles have sunk costs tied to them i.e., costs that cannot be recovered),
· Spillovers: a company that makes an investment in intangibles may not be the only one, or not even the one to reap its benefits fully later; they are more often than not reaped by others, and
· Synergies: multiple intangible assets may collectively produce even higher returns than what they would produce individually.
These four effects are crucial for a company to become a consistent compounder because once a company scales using intangibles assets (such as a proprietary database), it can then extract spillovers from other companies’ investments in intangibles (such as a third party software platform like SAP), and then create synergies between intangible investments (the proprietary database feeds the SAP with big data) which can potentially help the company corner the entire industry (first in its home market and then in the global market). This essentially means that the incremental capex in intangibles that firms are undertaking is not getting recorded as capex yet has a powerful bearing on their profitability. In fact, this effect has played out even in the Indian context.
In India these four economic changes have been catalyzed through introduction of GST in 2017, massive build out of infrastructure like road networks and highways, incremental financialization of households’ savings, and rise of mobile broadband. What’s even more interesting is that these changes have occurred in India in the space of a decade and have helped create a cohort of well-managed, increasingly high-tech listed Indian companies which are investing heavily in intangible assets (R&D, networks, training, branding, databases, etc.).
Over the past decade as the Indian economy has become increasingly networked and formalised the traditional type of capitalism – the capitalism that Karl Marx wrote about in 1867 – has created very little shareholder value. The traditional construct of capitalism hinged on the idea that physical labour and capital are the essential drivers of a capitalist economy. In this traditional construct, because the supply of labour is assumed to be fixed in the short run, it is essentially the supply of capital that drives production – the more a company invests in physical capital, higher the production it can undertake until a certain limit post which diminishing returns effect kicks in. That’s how India was in the preceding century – a century in which the biggest wealth creators in India were traditional capital-intensive enterprises like Tata Steel, Grasim and ONGC.
In contrast, the unusual rise of modern India is predicated on intellect and intellectual property, on business networks and, more generally, on investment in intangible assets such as software, training, on unique business processes, on product innovation and marketing & branding – which showcase increasing returns.
Let’s now consider a case study of two firms – from exhibit 1 itself – one which exited the top 10 list and another which has stayed in it over the last 2 decades. This case study illustrates the altered nature of Indian capitalism.
TCS vs ONGC: A study in contrast
“The Industrial Revolution of the eighteenth century led to the emergence of production lines facilitating repetitive manufacturing processes. In the Global North, the economic role of such manufacturing peaked in the mid-twentieth century. Thereafter, business increasingly provided services rather than goods, and manufactured products became knowledge-intensive rather than resource-intensive. Business organisation and business finance evolved in line with these changes in the nature of production.” – John Kay in ‘The Corporation in the Twenty-First Century: Why (almost) everything we are told about business is wrong’ (2024)
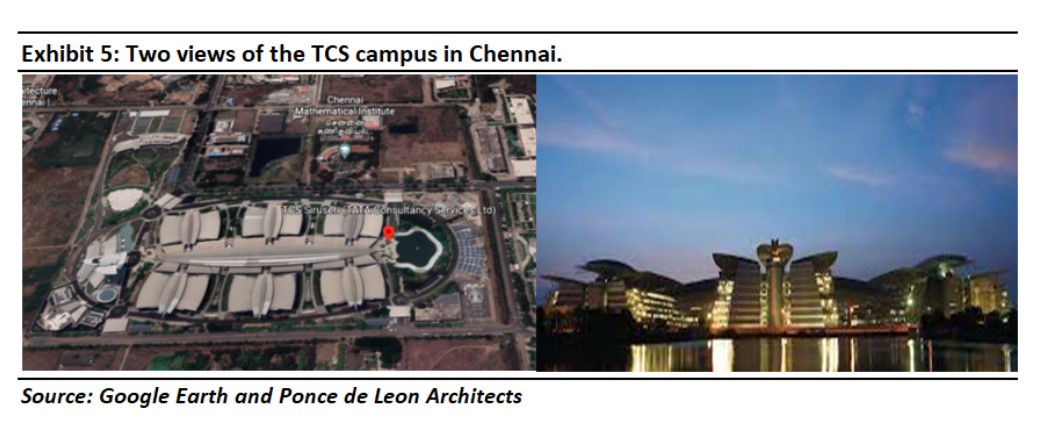
Tata Consultancy Services’ (or TCS’) largest office in India is situated in a sprawling 5.2 million sq ft campus in Chennai. That is an area equal to the size of ~100 football fields. If you happen to stand outside this massive campus during the morning rush hour, you’ll see close to approximately 20,000 people filing into work in spite of around one-third of the employees working from home. TCS Techno Park, as this campus is called, is Asia’s largest such IT facility. With ~600,000 employees on its roll, TCS is arguably India’s largest private sector employer. The firm generated ~ Rs. 12 trillion of wealth for its shareholders in the decade ending August 2024, making it the second highest contributor to stock market wealth creation in all of India!
Over the past decade, TCS’ Total Shareholder Return (TSR) as of 31st August 2024 has compounded at a CAGR of 16% whilst its net fixed assets, EBIT, and Free Cashflows have grown by roughly 7%, 10%, and 14% p.a. over the same period respectively (FY14 to FY24). If we look at TCS’ asset turnover (revenue/average net fixed assets and capital work in progress), it has averaged at around 9x in the last 10 years.
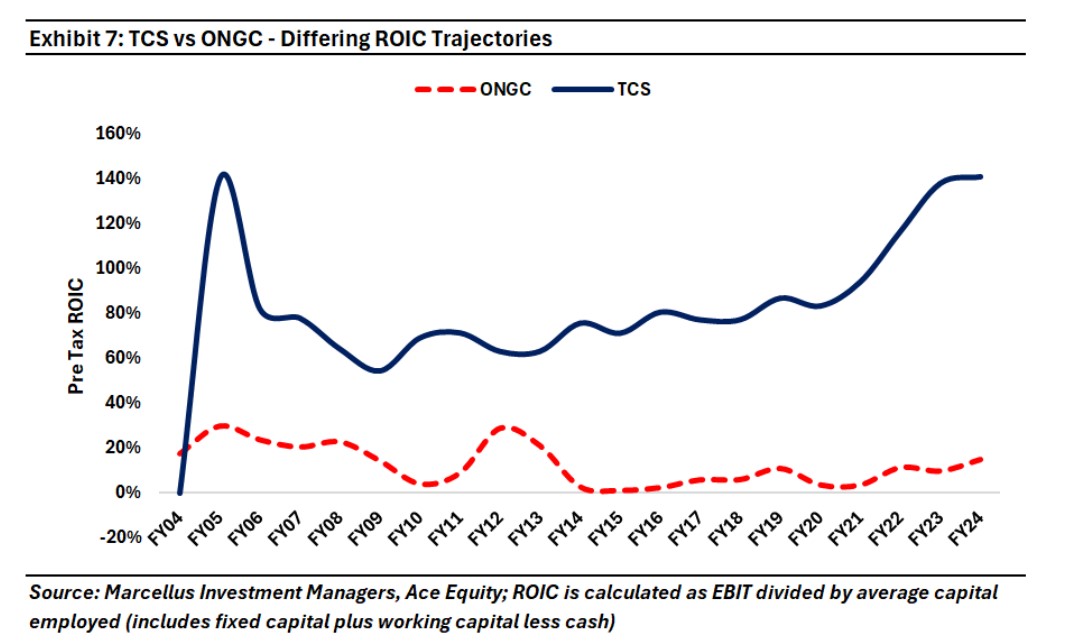
As a result, TCS’ Return on Capital Employed (ROCE) has risen from 52% in FY14 to 62% in FY24 with the 10-year average ROCE being close to 55%. Given that the typical large cap company in India does not even get close to hitting 15% ROCE over a typical decadal cycle (15% being our estimate of the cost of capital in India), what explains TCS’ sustained success on such a large scale?
Our research shows that TCS’ relentless rise over the past forty years has been underpinned by:
A. Unmatched muscle in skilling and training programs – especially for “freshers” (TCS was the first to do something of this sort) which leads to the build-up of human capital on a mammoth scale: This is evidenced by TCS’ cost structure – the firm has the highest profit margins amongst the leading IT Services companies (close to 20% as of FY24) in the country whilst having the lowest attrition rate (12.5% in FY24) within its peer group.
On the training front, TCS was one of the early players to recognize the importance of training fresh graduates and had started planning for a training campus in Thiruvananthapuram (then Trivandrum) as early as 1993. The first batch of trainees joined in 1997. To put this in context, Infosys’ Mysore training campus started in 2002, 5 years after TCS started. Lower attrition means lesser costs of hiring, training, and retraining, which have a direct impact on the firm’s profitability. The stability at the top level also drives strong comfort on succession planning. The median time spent by the C-Suite with TCS is 20 years and in its history of 50+ years, the firms has had just five CEOS – all of them were internally selected and groomed over multiple decades before ascending to the top (source: Ace Equity and company Annual Reports).
B. Robust processes for timely and accurate execution of projects: In the 1990s, TCS created an automated fix for correcting the Y2K bug. This was easy to plug and play in TCS’ applications/software, which helped TCS rectify the situation faster than its competitors could. This further established its stronghold as one of the innovators/leaders in the IT space. Another point worth mentioning is how TCS created a Data Dictionary called ADDICT (later named CASEPAC). This was a centralized repository of data and information with standardized definitions to be used by everyone, no matter where they were physically situated, in order to create coherence in the work done. The data dictionary, therefore, became a tool to dispel ambiguity and doubt about the definitions that the team had to work with. This was crucial for forging technology and learnings that supported its process approach and had a deep impact on many software project managers in TCS. This standardization and automation of processes gave TCS an operational excellence that their competitors lacked.
C. Superior intellectual property creation along with productizing its service and making it fungible across domains: TCS has typically invested ahead of the curve – whether in setting up India’s first IT fresher training campus, or setting up offices in non-US geographies, or investing in new business segments. Some of these initiatives do not payoff, but the ones which do give the company a long-term edge in that space. For instance, TCS’ focus on IP creation is evident with ~4,150 patents to its credit. TCS has ‘productized/platformized’ many services (like TCS ADD which is a data handling platform for life sciences organizations and TCS HOBS which is a fully automated device management platform) and the share of platforms and products in its total revenues is substantial (~10% of revenues or US$ 3 bn – source: channel checks). In many cases, the mundane job of coding has also been productized – smaller and generic chunks of codes are saved in a common repository, to be utilized in larger projects efficiently without reinventing the wheel. This process of investing in IP creation and productization helps TCS drive non-linear growth in revenues (which in turn drives superior profit margins)(source: TCS annual report FY24).
In stark contrast to TCS stands Oil and Natural Gas Corporation (or ONGC), which was the second largest wealth creator in the Indian stock market in the decade ending August 2014 (ONGC’s market cap addition in that decade was ~Rs. 2.7 trillion i.e., roughly a fifth of the value that TCS created in the decade ending August 2024).
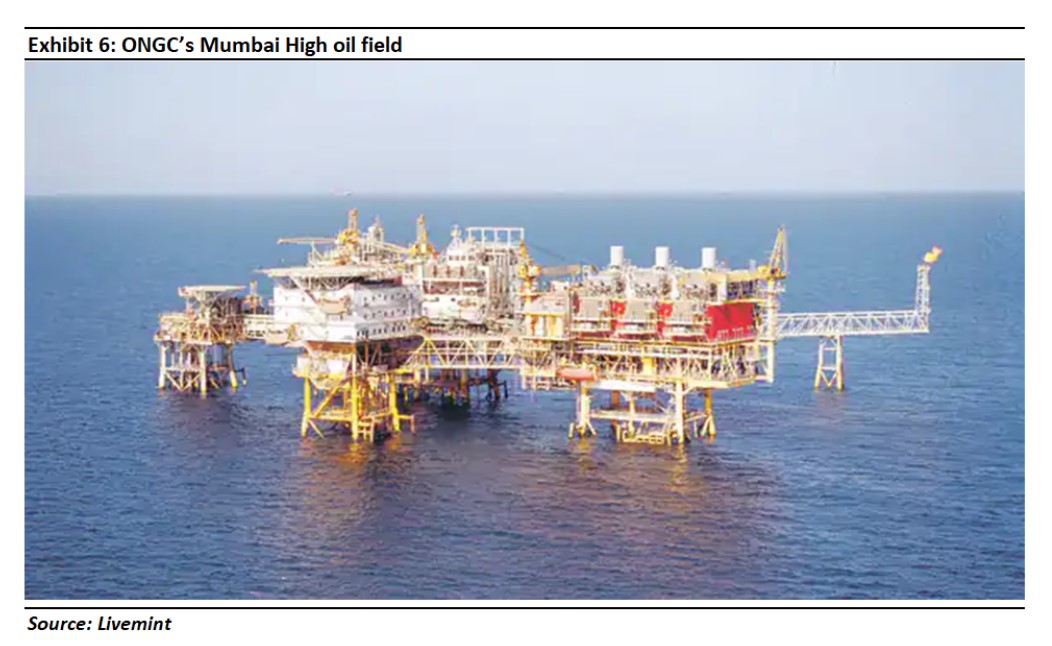
ONGC is primarily in the business of upstream crude extraction and operates large oil rigs both onshore and offshore. Just 87 nautical miles (or ~160 km) to the northwest of India’s financial capital, Mumbai, is ONGC’s crowning glory, the Mumbai High Field. Situated in the middle of the Arabian sea, sits India’s largest oil field which is operated by ONGC. Furthermore, on this site, ONGC has also constructed live-able apartments for its employees who have to operate from here.
ONGC’s multiple oil rigs play a critical role when it comes to crude extraction in India. As impressive as these feats of engineering are, ONGC’s financial statements remind us that the era of traditional capitalism (i.e., deploying ever larger sums of capital to a fixed body of intangible assets) has now passed in India. ONGC’s TSR in the decade ending August 2024 has been 6.4%, meaning that the firm has barely created any value in real terms. This value stagnation has happened even as the firm’s net fixed assets and EBIT compounded at 6.7% and 27% respectively. (ONGC has produced paltry Free Cashflow growth of 5% over the last 10 years)(source: Ace Equity).
ONGC’s net fixed assets growing far faster than its profits imply that on the incremental assets that the firm has built over the past decade, it has not been able to generate any incremental value. Asset turnover for ONGC has been a meagre 1.32x over the last 10 years. The firm’s ROCE in the last decade has struggled to even beat the cost of capital, let alone create value for the company (average 10-year pre-tax ROCE for ONGC in the decade ending FY24 is barely 13%).
The journey that ONGC and TCS have seen in the last decade exemplifies the previously rising and now dominant trend of companies that incrementally invest in intangibles in a highly networked economy earning outsized profits and those who do not, getting left behind.
Nandita Rajhansa and Saurabh Mukherjea work for Marcellus Investment Managers (https://marcellus.in/). Amongst the companies mentioned in this note, Microsoft, Bajaj Finance, TCS, HDFC Bank, ICICI Bank, and Infosys are part of Marcellus’ portfolios. Nandita and Saurabh may be invested in these companies and their immediate relatives may also have stakes in the described securities.
Note: the above material is neither investment research, nor investment advice. Marcellus does not seek payment for or business from this material/email in any shape or form. Marcellus Investment Managers Private Limited (“Marcellus”) is regulated by the Securities and Exchange Board of India (“SEBI”) as a provider of Portfolio Management Services. Marcellus is also a US Securities & Exchange Commission (“US SEC”) registered Investment Advisor. Marcellus Investment Managers Private Limited (“Marcellus”) is regulated by the International Financial Service Centre Authority (Fund Management) Regulations, 2022 (“IFSCA”) as Fund Management Entity – Non retail, rendering Portfolio Management Services No content of this publication including the performance related information is verified by SEBI or US SEC. If any recipient or reader of this material is based outside India and USA, please note that Marcellus may not be regulated in such jurisdiction and this material is not a solicitation to use Marcellus’s services. All recipients of this material must before dealing and or transacting in any of the products and services referred to in this material must make their own investigation, seek appropriate professional advice. This communication is confidential and privileged and is directed to and for the use of the addressee only. The recipient, if not the addressee, should not use this material if erroneously received, and access and use of this material in any manner by anyone other than the addressee is unauthorized. If you are not the intended recipient, please notify the sender by return email and immediately destroy all copies of this message and any attachments and delete it from your computer system, permanently. No liability whatsoever is assumed by Marcellus as a result of the recipient or any other person relying upon the opinion unless otherwise agreed in writing. The recipient acknowledges that Marcellus may be unable to exercise control or ensure or guarantee the integrity of the text of the material/email message and the text is not warranted as to its completeness and accuracy. The material, names and branding of the investment style do not provide any impression or a claim that these products/strategies achieve the respective objectives. Further, past performance is not indicative of future results. Marcellus and/or its associates, the authors of this material (including their relatives) may have financial interest by way of investments in the companies covered in this material. Marcellus does not receive compensation from the companies for their coverage in this material. Marcellus does not provide any market making service to any company covered in this material. In the past 12 months, Marcellus and its associates have never i) managed or co-managed any public offering of securities; ii) have not offered investment banking or merchant banking or brokerage services; or iii) have received any compensation or other benefits from the company or third party in connection with this coverage. Authors of this material have never served the companies in a capacity of a director, officer, or an employee. This material may contain confidential or proprietary information and user shall take prior written consent from Marcellus before any reproduction in any form.