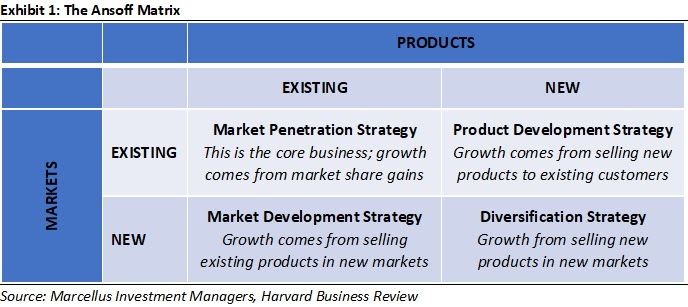
Take the example of Nirma, makers of the popular detergent and soap brand. The founder of Nirma formulated a detergent powder in his backyard, and started selling it door-to-door. There is an obvious limitation in the size of the market one can cater to by selling door-to-door. The natural extension for Nirma was to then expand locally, then regionally and then nationally. This was Nirma’s Market Development strategy, as represented in the bottom-left quadrant of the Ansoff matrix. They rapidly exploited the available growth opportunities in detergents, surpassing the market share of the then reigning leader, Surf. Nirma then adopted the Product Development Strategy (top-right quadrant), by venturing into bathing soaps and trying to exploit growth opportunities in the new segment.
Market expansions can be done organically or inorganically. Pidilite, the adhesives major, after achieving dominance in the white glue market through its Fevicol brand, successfully implemented a Product Development strategy through the inorganic route. Between 1999 and 2005, Pidilite acquired brands such as Mr. Fixit, Ranipal, M-Seal, Roff and Steelgrip, all in the wider adhesives segment. As Pidilite expanded its channel and intermediary influence through these acquisitions, it went on to dominate these newer sub-segments too. In the decade since completing these acquisitions the company continued to earn handsome RoCEs, averaging 34% over FY00-10.
In contrast to Pidilite, Page Industries has followed a largely organic route to Product Development. After dominating the mid-premium segment of the men’s innerwear market, Page expanded (in phases) in to women’s inner wear, then kids wear, lounge wear and sports/leisure clothing, among others. All these product segments were developed and marketed in-house by the company. In the last ten years, while Page pursued these growth opportunities, its continued to earn RoCEs far higher than its cost of capital, averaging 61% over FY11-20.
The success of any growth strategy will depend more on how well it is executed. Unfortunately, the success, or lack thereof, in executing a growth strategy is not easy to forecast. Whilst the past track record of the management is the most comforting indicator investors can draw upon, that may not have predictive capabilities for the success of a new strategy in the future. Therefore, it is also important to juxtapose the strategy against the quantum of capital or other resources the management is allocating towards it. A calibrated capital commitment would mean the ability to reverse tack in time, without doing too much damage to the overall financial health of the company.
Let us take an example to understand how combining the Ansoff Matrix with the quantum of capital commitment can be useful in assessing capital allocation decisions. Consider Tata Steel’s acquisition of steel companies in South East Asia in 2004/2005 (NatSteel and Millennium Steel) and in Europe in 2007 (Corus). In a span of 3-4 years, Tata Steel went from a 5 million tons per annum steel capacity in India to a 28 million tons per annum capacity across multiple countries in two continents.
What did these acquisitions achieve for Tata Steel? The company definitely got access to new markets for their products. However, given that the European markets it was entering were fairly mature, with per capita steel consumption 5-10 times that in India, would it not have been more prudent to allocate capital to capacity expansions in India? In the decade since the acquisition, steel consumption in India grew at a 7% CAGR compared to flat or negative growth in its new European markets. The acquisitions then do not seem effective from a Market Development point of view. How then would the acquisition have been from a Product Development strategy? This could have been a justified strategic move, especially considering that a developing country like India was likely to see increased use of high-value steel products, which the European entity was adept at making. In that sense product development scores over market development as far as the Corus acquisition goes.
Finally, let us juxtapose the strategy against the quantum of capital allocated. Between the three overseas acquisitions, Tata Steel spent approximately Rs58,000 crores over FY05-08, when its net worth as of March 2004 was about Rs4,500 crores and its market capitalisation was about Rs14,100 crores. Regardless of what strategic benefits could have been derived from the acquisitions, the quantum of capital allocation alone signifies a high degree of risk. Moreover, the acquisition was not funded from Tata Steel’s free cash flows, but with borrowed money. A leveraged acquisition raises the risks even higher. In the five years following these acquisitions (FY09-13), Tata Steel earned an average RoCE of just 9.4%, compared to an average of 36.9% in the five years preceding the acquisitions (FY03-08). In fact, there has been a structural decline in RoCE for the company, with the average till date since the acquisitions at 8.7% (FY09-20), not even covering the cost of capital.
To be fair, the long-term outcomes of the product and market extension strategies could not have been predicted with certainty back in 2005-07 when Tata Steel made these acquisitions. However, the case provides a good framework to investors for thinking about what risks to evaluate in capital allocation decisions of companies. In particular, investors need to be on their guard against capital allocation decisions which are “betting in the ranch” on a brand-new sector/product/market.
Unrelated diversification poses the biggest risk
It is evident from the Ansoff Matrix that the riskiest strategy is ‘new products in new markets’, and the one that investors should be most wary about. Unrelated diversification not only requires large capital commitments, but also demands a disproportionate share of management bandwidth. The split focus could hurt even the core business, as competitors will exploit the opportunity to weaken the barriers to entry built over the years. Moreover, it is always easier, and more cost-effective for an investor to herself diversify her portfolio (by buying shares in a cement company for example) rather than have a company she is invested in do it for her (eg. Nirma entering the cement business).
In pursuing an unrelated diversification, a company starts off with a double-handicap – they have NO competitive advantages in the new product as well as in the new market. And therefore, it becomes difficult to build sustainable advantages that can allow the company to earn justifiable returns in the new areas of business. For example, Mahindra & Mahindra, the market leader in tractors and one of the leading players in light commercial vehicles and sport utility vehicles, has ventured into businesses as diverse as financial services, IT services, timeshare holidays and logistics. The company’s average consolidated RoCE for the past ten years (FY11-20) has been a reasonable 14%. On the other hand, Maruti Suzuki, focused purely on the passenger vehicles segment of the auto market, has recorded an RoCE of a much higher 21.6% over the same period.
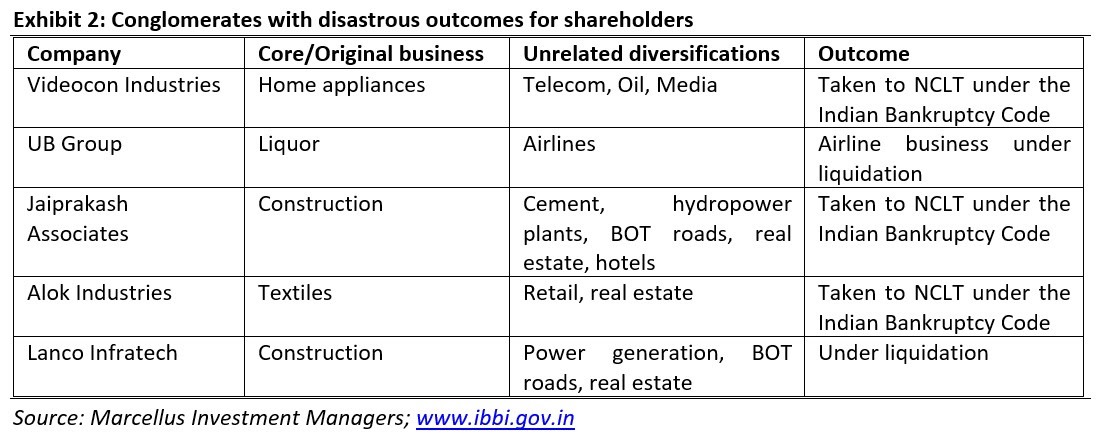
M&M is an example of reasonably well-managed unrelated diversification. On the other hand, examples abound of business expansions that have had disastrous consequences. Consider the cases in Exhibit 2, where the companies have either ceased to exist or the original promoters have had to sell the business to new owners. These companies ventured into businesses where they had limited or no competitive advantage, committed large amounts of capital (mostly borrowed) to these ventures and were eventually forced to pay the price for the poor RoCEs from such ventures.
Conclusion
One criticism of the Ansoff Matrix is that it pre-supposes binary choices for managements in exploring growth opportunities. Bansi Nagji and Geoff Tuff, partners at Monitor Group have developed a refinement of the Ansoff Matrix, which tries to overcome the problems of binary choices with a range of outcomes. Called the Innovation Ambition Matrix, this tool maps the novelty of a company’s offering and the novelty of its customer markets. The choices for managements for business expansions can now be measured in degrees rather than in discrete outcomes.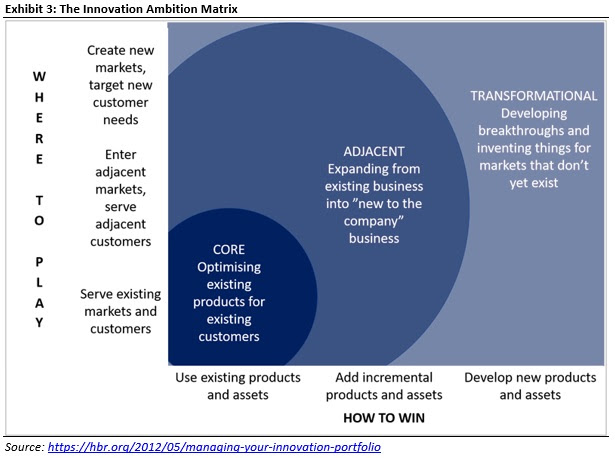
In conclusion, in spite of its few limitations, the Ansoff Matrix continues to be an important tool in assessing business expansion strategies. And, while originally intended for business managers to help them in allocating funds among growth initiatives, it is an equally useful tool for investors and should have wider adoption in analysing the capital allocation decisions of managements.
Disclaimer: Pidilite Industries and Page Industries are part of one or more portfolios managed or advised by Marcellus Investment Managers.
Salil Desai is part of the Investments team at Marcellus Investment Managers (www.marcellus.in).