OVERVIEW
POPULAR ARTICLES

Automation almost always displaces workers but whether it also impoverishes them is a political choice. Post-war America shared the gains from its machines with its workers until the 1970s; since 1979, a typical American worker’s pay has risen 33% while productivity has risen 94%. Germany faced the same situation but gave its workers a legal say over how technology was deployed, unlike what the US did, and today runs 449 robots per 10,000 factory employees (vs 307 in the US) without hollowing out its workforce. India, after 1991, took a third path: it made capital cheap, made permanent hiring expensive, and gave workers no voice over technology at all. The result is that wages have fallen from 29% to 14% of value added in India’s factories, profits have risen from 16% to 43%, and two in every five factory workers are now hired on a contractual basis. The same institutional vacuum now awaits India’s white-collar workers as AI pushes them into gig work. For us the good news is that the gains from India’s productivity boom will keep accruing to the owners of capital rather than to wage-earners. Visit invest.marcellus.in to know more about Marcellus’ journey and our compounding journey.
“Hitherto it is questionable if all the mechanical inventions yet made have lightened the day’s toil of any human being. They have enabled a greater population to live the same life of drudgery and imprisonment, and an increased number of manufacturers and others to make fortunes.”
- John Stuart Mill, Principles of Political Economy, 1848
Exhibit 1: America’s productivity and pay moved together for 25 years — then split
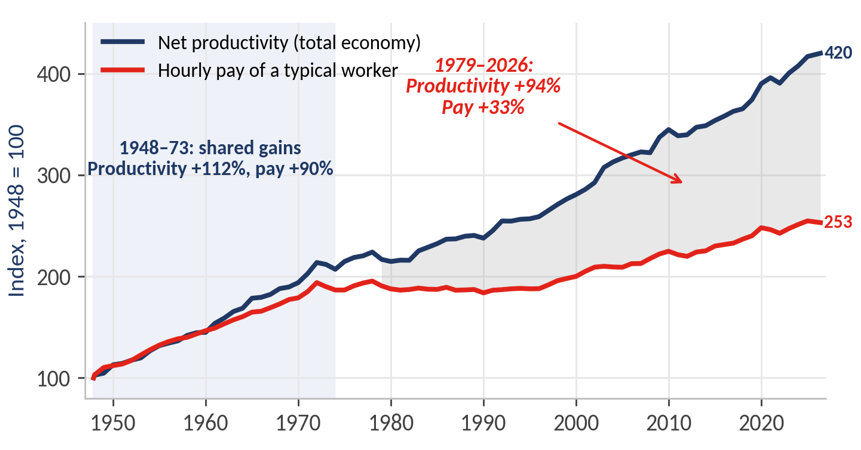
Source: Marcellus Investment Managers; Economic Policy Institute Productivity–Pay Tracker (data to Q2 2026), based on BLS and BEA data. Pay is real hourly compensation (wages and benefits) of private-sector production/nonsupervisory workers; productivity is real net output per hour of the total economy. Q4 values plotted, except 2026 (Q2). The size of the gap is sensitive to the choice of price deflator and pay measure — using the average compensation of all workers narrows it — but no measure closes it completely.
The machines are coming — and we have been here before
In the first half of the nineteenth century, British output per worker surged while real wages barely moved for decades — a stretch economic historians call ‘Engels’ pause’. Carl Benedikt Frey’s The Technology Trap (2019) makes the point beautifully: “technology that replaces workers rather than enabling them produces a long, politically combustible period of stagnant wages and surging profits, and how a society manages that period decides who wins from the technology”.
Economists Daron Acemoglu and Pascual Restrepo frame this as a race between two forces. Automation displaces workers from tasks they used to do; new technologies simultaneously reinstate workers into tasks that did not previously exist. Workers do well when reinstatement keeps pace with displacement. What needs to be tracked is labour’s share of value added: when it falls, wages are growing more slowly than productivity — workers are producing more and keeping less.
There is a benign reading of a falling labour share. Karabarbounis and Neiman (2014) show that cheaper investment goods explain roughly half of the global decline in labour’s share since the 1980s. But capital goods got cheaper everywhere, while labour’s share diverged sharply between countries using the very same machinery and technology. The key variable that changes the course of economic outcomes with falling prices of capital is the set of institutions that decide who gets to be in the room when decisions are being made about the arriving technology.
Same machines, but two very different bargains, and radically different outcomes
Post-war America is the textbook case of shared gains. The Wagner Act of 1935 gave workers the legal right to organise and bargain collectively, and the war effort turned unions into central partners of industry. Unions bargained not only over pay, but also over how new machinery was introduced and whether workers would be trained to run it. The technology of the era cooperated: electrification and mass production automated old jobs but created entire new categories of operator, maintenance and supervisory roles. Between 1948 and 1973, net productivity grew 2.8% a year and a typical worker’s hourly compensation grew 2.9% a year (source: EPI Productivity–Pay Tracker).
From the 1970s, this arrangement reversed. Milton Friedman’s 1970 doctrine that a company’s only social responsibility is to increase its profits became boardroom gospel, and the Reagan administration’s mass dismissal of striking air-traffic controllers in 1981 legitimised union-busting across the private sector. Union membership has halved from 20.1% of workers in 1983 to 10.0% in 2025 — and just 5.9% in the private sector (source: BLS, Union Members 2025). Fiscal policy also lent support to this: Acemoglu, Manera and Restrepo (2020) estimate that the effective tax rate on equipment and software fell from around 15% in the 1990s to about 5% by the 2010s, while labour continued to be taxed at more than 25%. Firms were, in effect, paid to automate. Since 1979, US productivity has risen 94%; a typical worker’s pay, 33%. America lacked neither technology nor growth. What it did lack was a mechanism to share the prosperity arising from them.
Germany faced the same oil shocks, the same robots and the same globalisation — but its trajectory and outcome was as diverse from the US as it could have been. Its Works Constitution Act (Betriebsverfassungsgesetz), first passed in 1952 and strengthened by Willy Brandt’s government in 1972, gave elected works councils co-determination over hiring, job grading and transfers and, critically, over the introduction of technical devices that monitor employees’ behaviour or performance. This effectively gave the workers some control or agency over how technology is deployed and not merely get impacted by its consequences and then adapt. When automation and outsourcing pressure peaked in the 1990s, German employers could not simply lay off workers and had to negotiate. In 1993 Volkswagen’s works council accepted a shorter, more flexible working week in exchange for avoiding mass layoffs, and pacts of this kind traded flexibility and automated assembly for job security and retraining across German industry.
Germany now runs 449 robots per 10,000 manufacturing employees — the third-highest density in the world — against 307 in the US (source: IFR World Robotics 2025). Yet the research summarised by Jäger, Noy and Schoefer (2022) finds that robotisation has not caused net employment declines in Germany; incumbent workers were redeployed rather than discarded, most visibly where unions were strong. German institutions have eroded too — collective bargaining coverage in western Germany fell from 76% in 1998 to 51% in 2023 — but the works-council claim over technology survived. Germany proves that automation does not require labour’s disempowerment; The US shows what happens when institutions meant to protect labour’s interests are dismantled instead. Germany’s experience suggests that automation need not require labour’s disempowerment; the US shows what happens when institutions meant to protect labour’s interests are instead disregarded.
Exhibit 2: Same machines, different bargains — what separated America from Germany
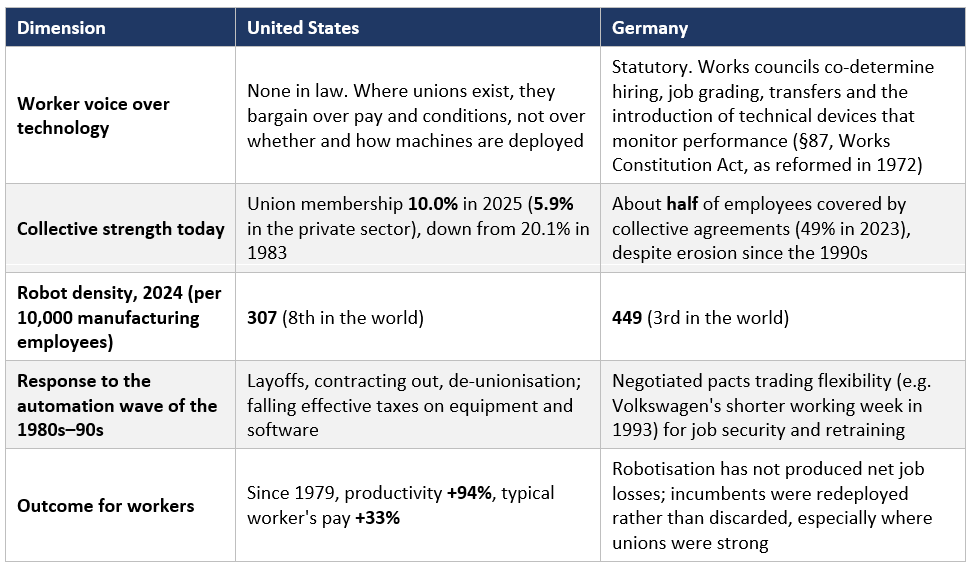
Source: Marcellus Investment Managers; BLS Union Members 2025 (February 2026; 2025 estimates exclude October owing to the federal shutdown); Destatis (collective bargaining coverage, 2023); IFR World Robotics 2025; EPI Productivity–Pay Tracker; Jäger, Noy & Schoefer, “The German Model of Industrial Relations”, Journal of Economic Perspectives (2022), summarising Dauth et al. (2021). Union membership and bargaining coverage are different measures; US bargaining coverage is roughly one in ten workers.
India after 1991: capital became cheap, permanent workers became expensive
So, what did India do at its own critical juncture? The 1991 balance-of-payments crisis forced open an economy that had been closed for 4 decades, and the settlement that followed was lopsided. Tariffs on imported machinery were slashed, foreign investment was welcomed and interest rates eventually fell — all of which made capital dramatically cheaper. Labour law, meanwhile, was left largely as it was. Chapter V-B of the Industrial Disputes Act, 1947 required any factory with 100 or more workers to obtain government permission before laying anyone off or closing down. And, crucially, India built nothing resembling a German works council: there was no legal channel through which workers could influence how technology was deployed.
Indian manufacturers responded exactly as the incentives dictated. They automated, and they staffed their shop floors through contractors who sit outside Chapter V-B. Between 1990-91 and 2009-10, the employment elasticity of organised manufacturing output was a mere 0.05 — output grew, jobs barely moved. And the workers who were hired got a shrinking slice of what they produced. Wages to workers fell from 28.5% of factory gross value added (GVA) in FY81 to 11.0% in FY13, while the profit share rose from 15.7% to 44.1% (source: Abraham & Sasikumar, ILO, 2017). Of every ₹100 of additional value created in India’s factories between FY01 and FY13, about ₹50 went to profits and just ₹10 to wages.
The latest Annual Survey of Industries shows how little has changed. In FY25, India’s registered factories paid ₹3.8 lakh crore in wages to 1.67 crore workers and earned ₹11.6 lakh crore in net profit (source: MoSPI, ASI 2024-25). GVA per worker has more than doubled from about ₹7 lakh in FY09 to ₹16.2 lakh, but wages per worker are just ₹2.3 lakh — a wage share of about 14%. Even counting the salaries and benefits of every employee, managers included, Indian labour takes under 30% of factory GVA, against the 50–65% typical of OECD manufacturing. Productivity has outrun pay in every decade: real GVA per employee grew 7.5%, 5.1% and 5.7% a year in the 1980s, 1990s and 2000s respectively, against real earnings growth of 3.5%, 1.0% and 2.4%. The pattern holds across states, too. Among India’s diversified manufacturing states, the five most productive produce 1.7 times as much per worker as the 5 least productive yet pay a wage share one-third smaller (source: Shukla, Ideas for India, 2026).
Exhibit 3: Post 1991 in India, profits have taken the share of factory value added that wages lost
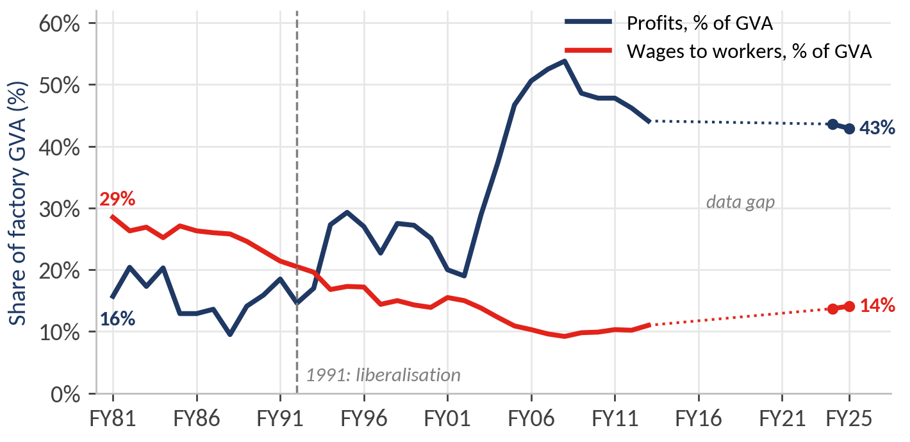
Source: Marcellus Investment Managers; Annual Survey of Industries data compiled by EPWRF, as reported in Abraham & Sasikumar (ILO, 2017) for FY81–FY13; FY24 and FY25 computed by Marcellus from the MoSPI ASI 2024-25 factsheet (wages = wages per worker × workers; profits = net profit). Registered manufacturing only. Wages exclude salaries of supervisory and managerial staff and non-wage benefits; total emoluments to all employees were 29.8% of GVA in FY25. The two sources are not strictly comparable and FY14–FY23 are not plotted, so read the levels on either side of the gap rather than the path across it.
The law that was meant to protect workers ended up taxing their jobs
India’s labour law failed in precisely the opposite way to its reputation. Chapter V-B was meant to protect workers. In practice it functioned as a tax on formal employment — permanent workers hired above the threshold could not be removed later without the state’s permission — while tariff, credit and tax policy subsidised the machines quite materially. As a result, the rational response was to buy equipment and hire contract labour, which sat outside the purview of the law. Contract workers have risen from about 20% of factory workers in FY00 to 42% in FY25 — against roughly 11% in the US and 12% in Europe. According to a study of plant-level ASI data, they earn on average 14.5% less than regular workers (31% less in large firms), receive little training, and have no meaningful bargaining power.
Comparing this with Germany, the Works Constitution Act placed no blanket restriction on layoffs but gave workers a say in how and when technology was getting deployed. India placed blanket restrictions on layoffs but gave workers no say whatsoever over technology. India simply ended up adding protection for workers on paper which did not bear any fruit in reality, as automation due to its cheaper pricing was inevitable, with no way for the workers to adapt and learn to the new reality of the workplace. The workers were instead replaced with contract workers, and the jobs the law was meant to save were never created.
Exhibit 4: Two in five workers in India’s factories are now hired through contractors
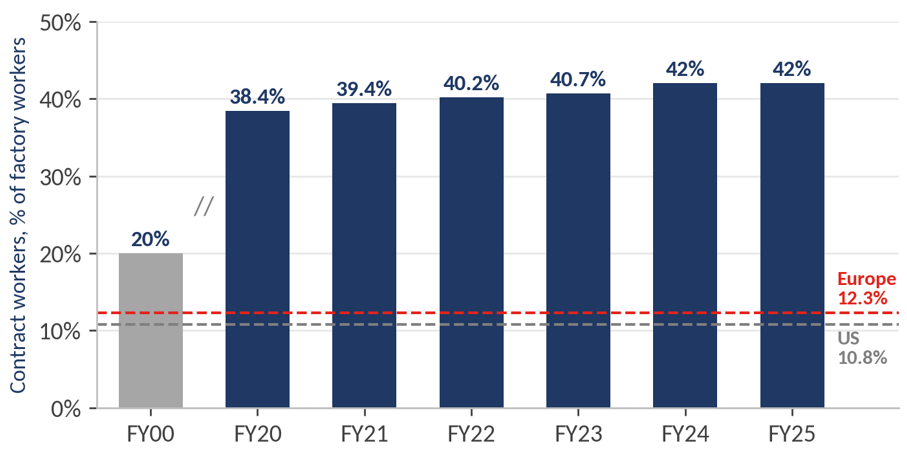
Source: Marcellus Investment Managers; MoSPI Annual Survey of Industries (FY25 ratio of contract to total workers of 0.42 from the ASI 2024-25 factsheet; FY20–FY24 as reported by Business Standard from successive ASI releases; FY00 as cited in the same coverage). US and Europe comparators are from a 2023 study cited by Business Standard and are not defined identically. Axis break between FY00 and FY20.
The reforms of the last few years treat the symptom but not the cause. The Industrial Relations Code, in force since 21 November 2025, raises the Chapter V-B threshold from 100 to 300 workers. That will help some firms scale — but the average Indian factory employs only 76 workers, so the change alters the incentive to stay small rather than the absence of worker representation in decision making about technology. The Code’s Worker Re-skilling Fund requires employers to deposit 15 days’ wages for each retrenched worker: a shock absorber after job loss has occurred, which also is too little too late, with no influence over the automation decision itself. The Production Linked Incentive (PLI) schemes reward incremental sales and investment, not jobs. Against the Budget 2022-23 ambition of 60 lakh new jobs and ₹30 lakh crore of additional production, PLI had delivered 14.4 lakh jobs and ₹20.4 lakh crore of production by December 2025 (source: https://www.pib.gov.in/PressReleasePage.aspx?PRID=2246085). And most manufacturing workers are beyond the reach of any of this: registered factories employ fewer than 30% of India’s roughly 7 crore manufacturing workers, and the rest work in the informal sector, where unionisation is practically impossible.
Exhibit 5: PLI is delivering production far faster than it is delivering jobs
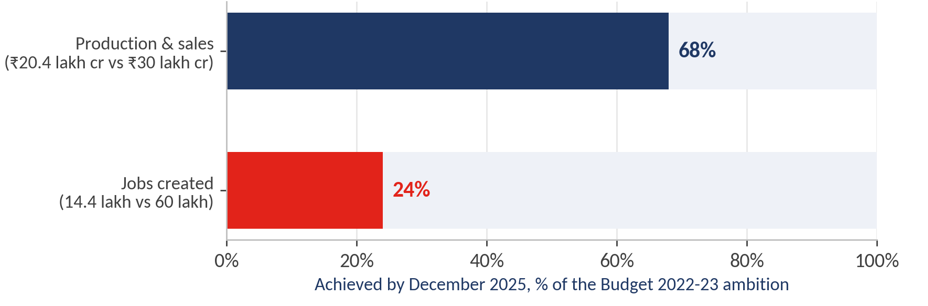
Source: Marcellus Investment Managers; Ministry of Commerce & Industry (PLI progress as on 31 December 2025, released March 2026); Union Budget 2022-23 speech (potential of 60 lakh new jobs and ₹30 lakh crore of additional production over five years). Jobs are direct and indirect. Investment under PLI reached ₹2.16 lakh crore by December 2025, against an approved outlay of ₹1.91 lakh crore
White-collar India is walking into the same trap
If shop-floor automation was India’s first test, generative AI is the second — and the institutional set-up is, if anything, weaker. As we documented in Breakpoint, IT job listings shrank at a 12% CAGR over FY23–25 and BPO listings at 28%, while white-collar listings overall are down about 20% since generative AI arrived at scale in 2022. At the same time, 8 million graduates enter the job market every year, resulting in supply far outstripping the demand.
What is replacing salaried work is gig work. found it estimates that white-collar gig jobs rose from 6.8 million in FY25 to 8.2 million in FY26 and will cross 10 million in FY27, with data, AI and machine-learning roles alone making up 49% of gig hiring in FY26 (source: foundit Insights Tracker, March 2026). At the same time, entry-level hiring (0–3 years’ experience) fell 2% year-on-year in April 2026 — the first annual decline on record — while hiring of professionals with 15-plus years of experience rose 10% (source: foundit Insights Tracker, April 2026). AI is absorbing the routine tasks that used to train juniors and the bottom rung of the white-collar ladder is being sawn off clean.
Now consider the institutions these workers can lean on. For more than a decade, Karnataka — home to India’s largest IT cluster — exempted IT and ITeS firms from the Standing Orders Act that codifies service conditions. The IR Code’s definition of ‘worker’ excludes those employed in a managerial or administrative capacity and supervisors earning above ₹18,000 a month, which covers much of the white-collar workforce. Gig workers now have social-security schemes funded by a levy on aggregators, but as independent contractors they have no collective bargaining over pay, over the algorithms that allocate their work, or over the automation that displaces them. This is the Indian manufacturing story replayed one floor up: displacement without reinstatement or control over decision making, and productivity gains with no institutional route back to the people producing them.
Nor is there an obvious political force to change this. The Indian state’s response to economic distress has been cash transfer rather than building and nurturing institutions: state transfers to women alone reached ₹1.7 lakh crore in FY26. Tight rural labour markets, good harvests and transfers have cushioned rural India while the urban salaried middle class has borrowed head over heels just to survive (see The Most Indebted People in the World – Marcellus). The 2024 general election — in which the ruling party lost its single-party majority amid discontent over youth employment, but welfare cushioned its losses in rural India — showed that this equilibrium can wobble but still hold. Transfers have cushioned households but they still haven’t addressed the core issue: giving workers a say over what the equipment can and cannot do and how to adapt and learn in this context.
Exhibit 6: White-collar work is shifting to gigs — and the entry rung is the first to go
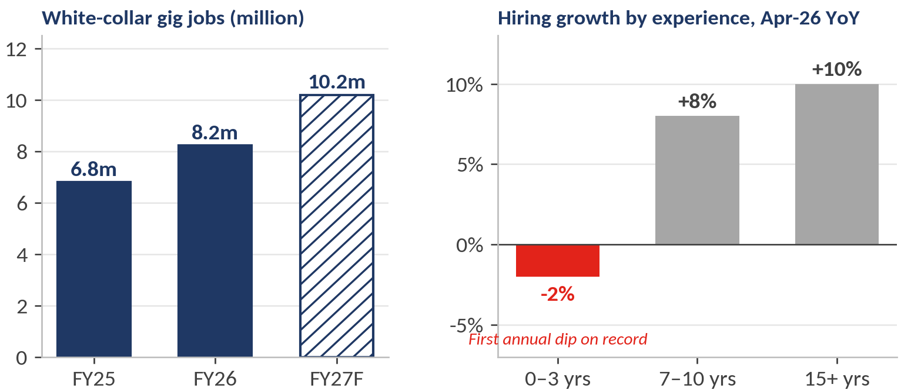
Source: Marcellus Investment Managers; foundit Insights Tracker (white-collar gig job estimates, March 2026; hiring by experience band, April 2026). FY27 is foundit’s forecast. Job-posting data measure demand for roles rather than the number of people employed, and gig estimates are not comparable with official employment surveys.
Investment Implications
What we have seen in India in the last three decades in manufacturing – of factories and employers swapping labour for capital – is now getting replicated in India’s offices (as described by us in our book ‘Breakpoint: The Crisis of the Middle Class & The Future of Work’). If India’s institutions keep channelling productivity gains to capital investors like us could benefit in three different ways:
- Own the owners of productivity. In a system that routes value added to capital, the likely beneficiaries are firms that can grow revenue without growing headcount — well-run, owner-operated manufacturers and service businesses that deploy automation and technology aggressively. A profit share of 43% of factory GVA is not a cyclical peak to fade; it is the structural outcome of India’s institutions set-up and not merely a cyclical peak, although profit shares can still fall with an economic downturn, competition or policy change.
- Be selective about mass-market consumption. If wages keep lagging productivity and salaried white-collar jobs give way to gig work, the income base behind middle-class discretionary spending stays weak. In our view, consumption and volume growth will come from the affluent and from credit rather than from rising wages — as we have discussed at length in Breakpoint (2026).
- Expect exports to drive a larger share of India’s economic growth: As the $400bn per annum of forex inflows which used to accrue to India due to its IT Services industry gradually reduce, India’s currency is likely to depreciate more than the 5% per annum that it has given up since 1991. This in turn in syn with the FTAs and BTAs India is signing will help India’s manufacturers become more competitive in the global market (see our blog India’s Exports Are Rocking and We Are Loading Up, 10 September 2026 for more details). That in turn could support a new wave of prosperity in India’s industrial belts.
Starting next week, we are kicking off a new series of podcasts & blogs regarding the new winners from India’s very specific formula for development (based on relatively cheap capital, onerous rules & regs which disadvantage salaried employment, relative ease of hiring & firing contract labour and an increasingly cheap currency). Beyond exporters, the themes we intend to explore include wholesalers, distributors & franchisees of organised consumer brands, platforms which sell the services of gig workers, brokers, bankers & wealth managers catering to the business class prospering in India.
If you would like to join us in knowing how we help compound wealth through clean, well-managed companies, please visit invest.marcellus.in or scan the QR code below.
To know more about Marcellus’ offerings, please visit invest.marcellus.in# or scan the QR code below

Disclaimer:
Note: the above material is neither investment research, nor investment advice. Marcellus does not seek payment for or business from this material/email in any shape or form. Marcellus Investment Managers Private Limited (“Marcellus”) is regulated by the Securities and Exchange Board of India (“SEBI”) as a provider of Portfolio Management Services. Marcellus is also a US Securities & Exchange Commission (“US SEC”) registered Investment Advisor and is regulated by the International Financial Services Centres Authority (IFSCA) as a Fund Management Entity. No content of this publication including the performance related information is verified by SEBI, IFSCA or US SEC. If any recipient or reader of this material is based outside India and USA, please note that Marcellus may not be regulated in such jurisdiction and this material is not a solicitation to use Marcellus’s services. The PMS strategy, Category III AIF products and IFSCA retail schemes are distinct offerings with different regulatory frameworks, risk profiles, fee structures and investment thresholds. Investors should refer to product-specific documents for details before investing. All recipients of this material must, before dealing and or transacting in any of the products and services referred to in this material, make their own investigation and seek appropriate professional advice. Investments in securities market are subject to market risks. Read all the related documents carefully before investing. Past performance is not indicative of future results. Marcellus and/or its associates, the authors of this material (including their relatives) may have financial interest by way of investments in the companies covered in this material. Marcellus does not receive compensation from the companies for their coverage in this material. This material may contain confidential or proprietary information and user shall take prior written consent from Marcellus before any reproduction in any form. Clients have an option to be on-boarded directly by the Portfolio Manager without intermediation of persons engaged in distribution services.
# This tool is designed to help users explore products and asset allocation guidance; it does not constitute a formal financial plan or investment advice.