OVERVIEW
POPULAR ARTICLES

For half a century, India has struggled to export manufactured goods. That is now changing; merchandise exports in the first four months of FY27 are up 17% on last year and July alone set a record at US$44.2bn. There are four things that have swung in India’s favour: the rupee is at its cheapest in real trade-weighted terms since February 2014; the UK trade deal is live and the EU deal is signed in all but name; global buyers are actively de-risking China, and Western rearmament and grid spending have run into capacity constraints which is creating spillovers into India. None of this needed world trade to accelerate, it only needed world trade to hold up while India’s share of it rose, which is exactly what is happening. Across every Marcellus PMS portfolio we are adding manufactured goods exporters from sectors like textiles, auto ancillaries, precision engineering & pharma ancillaries. If you would like to participate in this, respond to this email or reach us via invest.marcellus.in.
“In economics, things take longer to happen than you think they will, and then they happen faster than you thought they could.”
— Rudi Dornbusch, former Professor of Economics at MIT
Fifty years of getting this wrong is a fact and not fiction
For decades India took a large, young, cheap workforce and repeatedly failed to turn it into an export machine, while South Korea, then China, then Vietnam did precisely that. The data backs this up:
- Manufacturing value added was 12.5% of Indian GDP in 2024, against roughly 17% in 2010.
- Manufactures were 79% of India’s merchandise exports in 1999. They fell to 60% by 2013 and have clawed back only to 67% in 2024.
- On the new national accounts series, goods exports have slipped from 14.1% of GDP in FY23 to 12.1% in FY25.
- India’s share of world merchandise trade is still under 2%.
- FY26 was flat. Merchandise exports grew 0.93% to US$441.8bn, and March 2026 exports actually shrank 7.4% when the Strait of Hormuz closed.
Exhibit 1: Manufactures have never regained their 1999 share of India’s exports
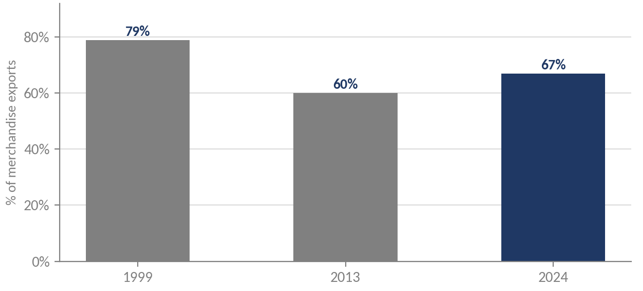
Source: Marcellus Investment Managers; World Bank and UN Comtrade, manufactures exports as a percentage of merchandise exports, accessed September 2026. 2024 is the latest year available in the World Bank series.
Layered on top of that history is what happened last year in Washington. India was hit with a 25% reciprocal tariff in 2025, doubled to 50% over Russian oil, and for half a year Indian goods were among the most expensive things an American importer could buy. That regime is gone, but not in the tidy way most people thought in February. The Supreme Court struck down the IEEPA tariffs on 20 February 2026, which invalidated the 18% reciprocal rate India had negotiated. A temporary Section 122 surcharge filled the gap until it hit its 150-day statutory ceiling on 24 July, and a new Section 301 forced-labour duty of 10 to 12.5% covering roughly 60 economies took effect the same day. A separate Section 301 investigation into manufacturing overcapacity, opened on 11 March and covering sixteen economies including India, is still working through. The comprehensive bilateral agreement remains unsigned, and on 4 September 2026 Piyush Goyal said India will not sign until the terms give Indian exporters an edge over competitors.
The level of US tariffs on India is now far below the 50% peak as we await certainty on the final Bilateral Trade Agreement (BTA) between the two large democracies.
The data stopped agreeing with the pessimists in April
Whatever FY26 was, FY27 is not it. Merchandise exports in April to July 2026 came in at US$173.8bn, up 17% on the same four months last year. The June quarter alone was US$129.3bn, up 16%. July’s US$44.2bn was the highest July on record and beat the previous July peak of US$38.3bn from 2022 by a wide margin, and it did so while Gulf shipping was disrupted and freight rates were elevated.
Exhibit 2: April to July merchandise exports are running 17% ahead of last year
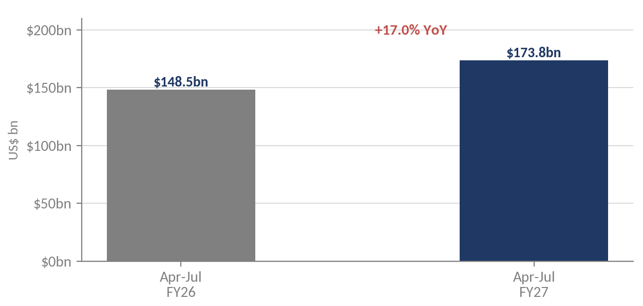
Source: Marcellus Investment Managers; Ministry of Commerce & Industry monthly trade releases. The April–July FY26 base of US$148.5bn is derived from the ministry’s reported 17.04% year-on-year growth and is flagged as derived; the ministry’s own cumulative print should be used if this figure is quoted independently.
The composition is more interesting than that though. Engineering goods, now 28% of merchandise exports, grew 5% in FY26 when the aggregate grew 1%, and were up 18% year on year in July 2026. Electronics have gone from Rs 38,000 crore of exports a decade ago to Rs 4.24 lakh crore in FY26 and are now India’s third-largest export category. And look at where the growth is coming from: shipments to China in April to July rose to US$7.78bn from US$5.72bn, while exports to the United States barely moved, from US$33.48bn to US$34.49bn. India is growing exports without leaning on the market that has spent a year threatening it.
Globalisation did not die. It simply changed its address.
The other point in trade pessimism is that there is no world trade left to win. James Crabtree, reviewing Ed Conway’s new book (titled Trade World: The Ties that Bound Our Past and Could Unravel Our Future [2026]) on the history of trade, makes the opposite point rather well: globalisation peaked during the financial crisis, but since then it has barely declined, and we still live in the most economically interconnected period in human history. Trade as a share of world GDP climbed for decades into the early 2010s, stalled, and has drifted only slightly lower since. Meanwhile the absolute numbers keep setting records.
- World merchandise trade volumes grew 4.6% in 2025, nearly double the WTO’s own October forecast of 2.4%, on the back of demand for AI-related goods. The value of world goods exports reached US$26.26 trillion, up 7%.
- Tariffs did not spiral. US tariffs are the highest in a generation, but almost nobody followed America’s example; so average global tariffs rose only modestly from around 2.5%. Crabtree’s phrase for it is that this is hardly a chaotic unravelling of the global order.
- Companies adapted instead of retreating. They rerouted shipments through third countries, mapped their vulnerabilities, shortened chains and moved some production closer to home. Rerouting is precisely the mechanism that hands volume to a country like India.
- The WTO’s 2026 baseline is slower, at 1.9% volume growth recovering to 2.6% in 2027, with the Middle East conflict as the swing factor. That is deceleration from a record base, not contraction.
We would not go as far as saying global trade is booming. The accurate version is that global trade refused to break and is being redirected. India does not need world trade to accelerate. It needs world trade to hold up while India’s share of it rises. One caveat worth considering though is that restrictions, interventions and chokepoint politics are all increasing, and today’s stability may simply be the lag before deeper fractures bite.
Four things have changed at once
Any one of these in isolation would be good to know. But together, they look less like a good year and more like a change of regime.
Reason one: The rupee has stopped punishing exporters
For a decade India ran a mild case of Dutch disease. A large, high-margin IT services surplus and steady capital inflows kept the rupee expensive in real terms, and manufacturers paid for it. On the RBI’s 6-currency trade-weighted REER, the rupee sat above the fair-value line of 100 in 91 of the last 121 months, three-quarters of the decade, and the cycle peaked at 105.4 in November 2024. It has fallen every leg since. It broke below 100 in March 2025, touched 88.1 in May 2026 and stood at 90.4 in July 2026, 14.3% below the November 2024 peak and 11.0% below its ten-year average of 101.5 . The last month the rupee was this cheap in real terms was February 2014, in the wake of the taper tantrum. Spot USD/INR is around 94.4, some 7% weaker than a year ago.
Exhibit 3: The rupee is at its weakest in real trade-weighted terms since February 2014
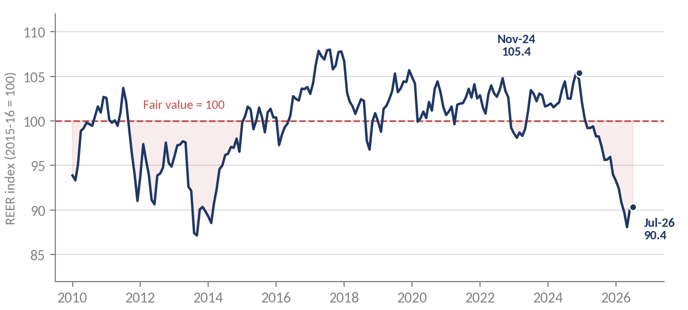
Source: Marcellus Investment Managers; RBI Bulletin Table 37, 6-currency trade-weighted REER, base 2015-16 = 100, monthly. The series runs from April 2004 to July 2026; the chart shows January 2010 onwards. All readings are from a single RBI table and vintage. Shaded areas mark months below the fair-value line of 100.
The engine behind the old strength is losing power. IT services growth is decelerating from the double digits of the 2010s to mid-single digits, with expected net IT services export growth to slow on account of H-1B fee risk, TCS alone removing some 12,200 roles in FY26 as AI reshapes delivery. Services exports still grew 8.71% to US$421.3bn in FY26, so this is a slow structural shift and not a cliff. But the direction is unambiguous, and a currency that is no longer being propped up by a services windfall builds for a situation most export manufacturers have been waiting for.
This is the least discussed input into Indian export competitiveness and possibly the most powerful. It compounds quietly through every quarter it persists, and it does not need a single policy decision to keep working.
Reason two: Two of the three big tariff walls are coming down
The India-UK Comprehensive Economic and Trade Agreement came into force on 15 July 2026, India’s only comprehensive agreement with a G7 economy. The UK removed duties on 99% of Indian tariff lines on day one. More than 50 consignments worth over US$140m shipped under the agreement on the first day of operation, averaging roughly US$2.8m each.
The India-EU FTA, concluded on 27 January 2026 after nearly two decades of talking, is the bigger prize. The EU has offered preferential access on 97% of tariff lines covering 99.5% of India’s export value, with immediate elimination on 70.4% of lines representing 90.7% of India’s exports to the bloc. Bilateral goods trade was US$136.5bn in FY25, of which India exported US$75.9bn. Signature is expected by end-2026 and implementation is targeted for early 2027, so this is something that is rather certain than just hope.
Exhibit 4: What India’s two developed-market deals actually remove
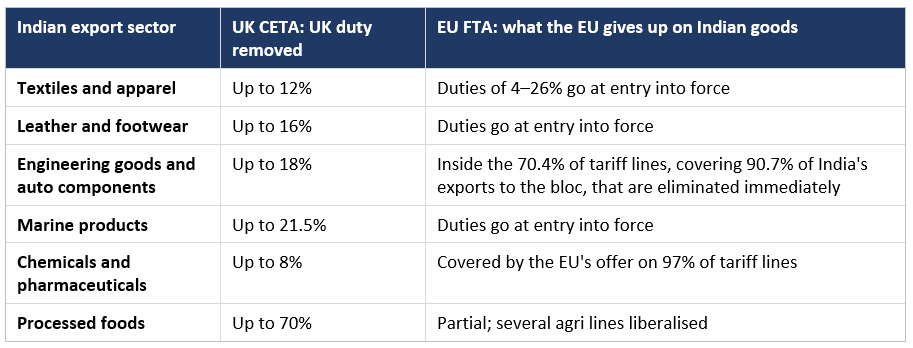
Source: Marcellus Investment Managers. UK column per PIB and the UK Department for Business and Trade, CETA in force 15 July 2026. EU column per the European Commission, DG Trade, India-EU FTA concluded 27 January 2026 and awaiting signature; entry-into-force treatment is as negotiated and is contingent on signature and ratification.
One caution that should matter is utilisation. The Global Trade Research Initiative estimates Indian exporters claim preferential tariffs on only 20 to 30% of exports that already qualify under existing deals, against 60 to 70% claimed by exporters selling into India. Whether CETA and the EU deal break that pattern will decide how much of this reaches earnings, and it is a company-level question, not a macro one.
A second caution on textiles specifically, because it is widely misunderstood. These deals do not immediately leapfrog India past its competitors. Bangladesh keeps duty-free EU access under Everything But Arms through a transition that runs to November 2029, and Vietnam has had an EU agreement since 2020. What India is doing is closing a gap it should never have allowed to open. The step ahead comes in 2029, when Bangladeshi garments move to roughly 9.6% standard GSP duty and Indian garments are at zero. Sourcing decisions for that date are being made now.
Reason three: China+1 has moved from the deck to the dock
The evidence has finally shifted from documents to shipment data. India’s share of global iPhone production has gone from under 10% a few years ago to roughly a quarter, across five assembly facilities and a network of around 45 local component vendors. Electronics exports were up about 35% year on year as of April 2026, taking India to roughly 8% of the global EMS market.
But India is one of several winners rather than the winner; Vietnam and Mexico have taken large slices, and ASEAN pulled a record US$225bn of FDI in 2025. And domestic value addition in Indian electronics is still only 18 to 20% against roughly 40% in China, so a good deal of what India books as exports is assembly on imported components. Moving up that curve is a decade of work. What has already happened, and what does not reverse, is that a generation of Indian operators and engineers has been trained in modern electronics manufacturing, and that capability is now spilling into other buyers.
Reason four: The West is rearming and cannot build all of it at home
European allies and Canada raised defence spending by nearly 20% in real terms in 2025, the fastest annual increase since 1953, taking their combined outlay above US$574bn. For the first time every NATO member is above 2% of GDP, and the alliance has committed to 5% by 2035. The binding constraint here is industrial capacity: shell production, machining, skilled labour, raw materials. Demand of that size hitting a supply base that cannot expand fast enough has to find qualified capacity somewhere.
Enter India. Defence exports hit a record Rs 38,424 crore in FY26, up 62.7%, with the private sector contributing 45% and the United States the single largest destination. American defence & aerospace OEMs are buying sub-systems and fuselages from Indian suppliers. The number of registered defence exporters rose to 145 from 128, and Indian defence goods now reach more than 80 countries.
Exhibit 5: India’s defence exports have tripled in four years
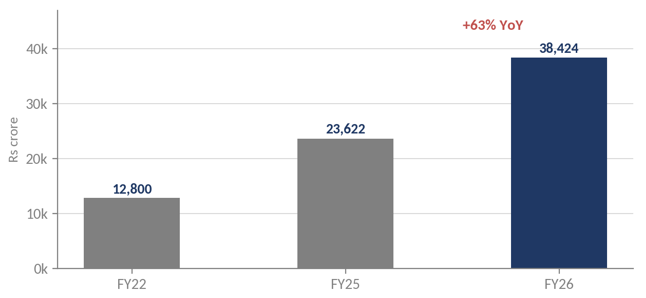
Source: Marcellus Investment Managers; Ministry of Defence annual defence export data, FY26 release dated 2 April 2026. FY22 figure of Rs 12,800 crore per the same ministry series as reported.
The winner here is precision component supplier that has already cleared a Western aerospace or defence qualification cycle, two to four years of audits, and now sits inside a supply chain that is desperate for capacity and structurally slow to re-qualify anybody else.
What we are buying, and why
Across all of Marcellus’ PMS portfolios we are adding to listed Indian companies in five sectors we think are the clearest beneficiaries of the EU and UK agreements and of the demand shifts described above: textiles, auto ancillaries, precision engineering, pharma and pharma ancillaries.
Exhibit 6: Where we are adding, and what we underwrite in each case
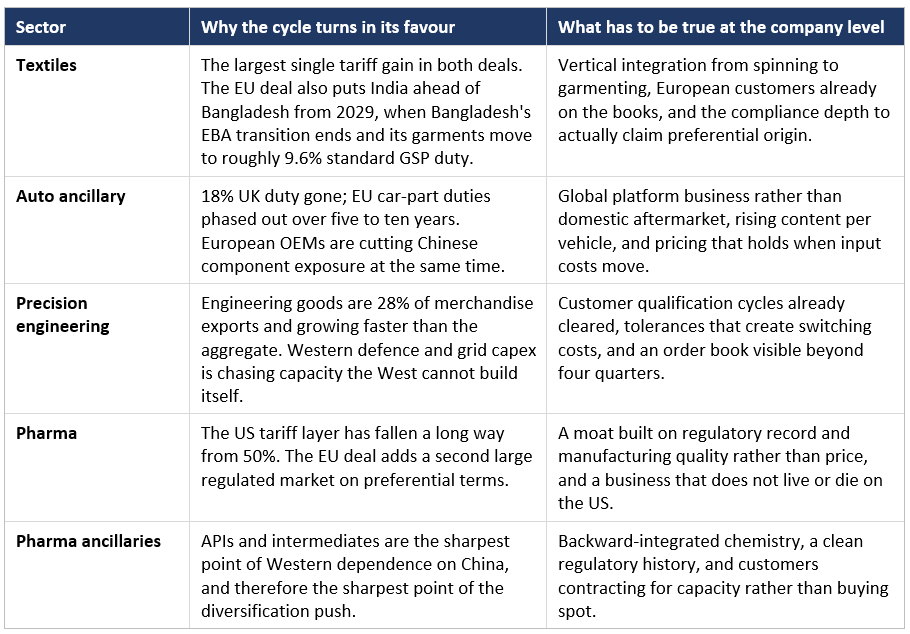
Source: Marcellus Investment Managers. Sector references are illustrative categories and are not security recommendations.
A tariff line falling to zero is available to every exporter in that line, including the ones with no pricing power and no balance sheet. Therefore, what we are buying are franchises where this tailwind lands on top of an advantage that already exists: clean accounts, capital allocation we can defend, and a reason the customer cannot easily walk away.
What would prove us wrong
- The American arrangement never settles. The bilateral agreement is unsigned, the overcapacity investigation is live, and the legal basis for US tariffs has already been rebuilt twice this year. The US is still India’s largest single export market.
- Utilisation stays where it has always been. If exporters claim preference on only a fifth of eligible shipments, the FTAs deliver a fraction of the headline.
- The rupee turns. A real exchange rate 11% below its own ten-year average is not a permanent condition, and the rupee has already ticked up from May’s low.
- Chokepoints. Crabtree’s warning about sea lanes is not academic for India. The Hormuz closure alone took 7.4% off March 2026 exports, and freight and insurance can erase a 12% tariff saving in a fortnight.
- Non-tariff barriers replace tariff barriers. The UK’s carbon border tax starts in January 2027 on steel, aluminium and cement, alongside a tightened steel safeguard regime from July 2026. The EU has its own CBAM and deforestation rules. Compliance can easily undo the benefit from access in a volatile world trade scenario.
We do not think any of that is a reason to sit this out. They are reasons to own the companies that can absorb it, which is the same discipline we would apply with or without a trade cycle. The difference is that for the first time in fifty years the exchange rate, market access and global demand are pointing the same way at the same time.
If you would like to invest with us, please visit invest.marcellus.in OR scan the QR code below.

Click Here for details about our regulatory registration and licensing information.
Disclaimer:
the above material is neither investment research, nor investment advice. Marcellus does not seek payment for or business from this material/email in any shape or form. Marcellus Investment Managers Private Limited (“Marcellus”) is regulated by the Securities and Exchange Board of India (“SEBI”) as a provider of Portfolio Management Services. Marcellus is also a US Securities & Exchange Commission (“US SEC”) registered Investment Advisor and is regulated by the International Financial Services Centres Authority (IFSCA) as a Fund Management Entity. No content of this publication including the performance related information is verified by SEBI, IFSCA or US SEC. If any recipient or reader of this material is based outside India and USA, please note that Marcellus may not be regulated in such jurisdiction and this material is not a solicitation to use Marcellus’s services. The PMS strategy, Category III AIF products and IFSCA retail schemes are distinct offerings with different regulatory frameworks, risk profiles, fee structures and investment thresholds. Investors should refer to product-specific documents for details before investing. All recipients of this material must, before dealing and or transacting in any of the products and services referred to in this material, make their own investigation and seek appropriate professional advice. Past performance is not indicative of future results. Marcellus and/or its associates, the authors of this material (including their relatives) may have financial interest by way of investments in the companies covered in this material. Marcellus does not receive compensation from the companies for their coverage in this material. This material may contain confidential or proprietary information and user shall take prior written consent from Marcellus before any reproduction in any form.
Clients have an option to be on-boarded directly by the Portfolio Manager without intermediation of persons engaged in distribution services.
* Note on sources: figures not attributed in an exhibit source line are drawn from the Ministry of Commerce & Industry monthly and annual trade releases (FY26 and April-July FY27); the Engineering Export Promotion Council of India; the Ministry of Defence; PIB and the UK Department for Business and Trade; the European Commission, DG Trade; the WTO Global Trade Outlook and Statistics, March 2026; World Bank and UN Comtrade indicators; RBI Bulletin Table 37; the NATO Secretary General’s Annual Report 2025; the Office of the US Trade Representative and the Federal Register on the Section 301 actions of March and July 2026; the Supreme Court of the United States in Learning Resources, Inc. v. Trump, 20 February 2026; Bloomberg on the Commerce Minister’s remarks of 4 September 2026; the Global Trade Research Initiative FTA Report Card 2026; and the UN Committee for Development Policy and European Commission on Bangladesh’s LDC graduation and EBA transition. US dollar figures are as published by the cited source and are not restated at a common exchange rate.