OVERVIEW
POPULAR ARTICLES

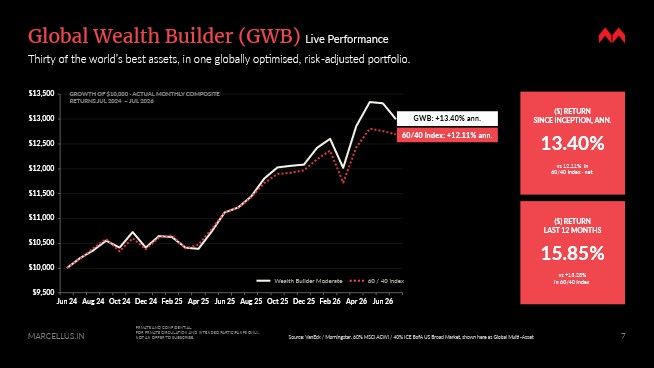
Most investors chase alpha but good investing is more Test cricket, not T20. Long term wealth creators therefore focus on risk adjusted returns, not alpha. In cricketing parlance, they seek to be more like Dravid rather than Sehwag. Diversifying across the world & across uncorrelated asset classes is a very effective way to generate Dravid-style returns. That is what Marcellus’ new Global Multi Asset fund (which invests into the Marcellus Global Wealth Builder Fund SP) delivers. Built in partnership with Van Eck, a leading ETF provider, Global Wealth Builder seeks to deliver attractive, risk-adjusted dollar returns, with volatility historically less than half that of the Nifty 50.
Don’t chase alpha, chase risk adjusted returns
If you go by Test cricket batting averages, Dravid was a marginally better batsman than Sehwag – see table below. So why then was he so much more instrumental than Sehwag in taking India to decisive Test match victories in foreign conditions? Because Dravid understood risk (measured using standard deviation) and conquered. On a risk adjusted basis i.e. Runs per innings per unit of risk, Dravid is streets ahead of Sehwag (see the final row of the exhibit below). In plain English, Dravid scored lots of runs while taking fewer risks. To our mind, that is the holy grail of long-term investing.
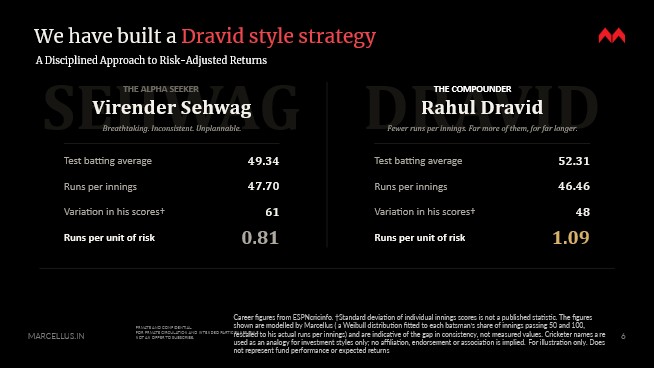
Almost every investor is taught to chase alpha “how much did you beat the index by?” Exciting and easy to quote like a strike rate in cricket, but a strike rate tells you what happened in known conditions.
A T20 innings is twenty overs on the same flat pitch, same weather, controlled conditions. A Test match is five days. The pitch breaks up, the weather changes, and you face random changes nobody prepared for: some unpredictable, like the Iran-US conflict this year, some entirely unfamiliar, like COVID.
An investor’s life over decades is a Test match, not a T20 innings. So, the number that matters is not runs scored. It is consistent runs you can count on, i.e. risk adjusted returns.
How does one achieve risk adjusted returns (Dravid style)?
Two simple investing concepts, applied with discipline and consistency can help you achieve risk adjusted returns:
1) Asset allocation
Asset allocation contributes roughly 91.5% of the variability of returns over time. Stock picking, fund selection and market timing account for only 8.5%2. (Brinson et al)
Exhibit 1: Share of the variability of returns over time explained. Source: Brinson, Hood & Beebower (1986); Brinson, Singer & Beebower (1991). See note [2].

2) Diversification
Ray Dalio’s Holy Grail of investing explains, by adding ten to fifteen good, uncorrelated return streams, you keep the average return and eliminate most of the risk. Risk falls with the square root of how many genuinely uncorrelated holdings you own.
Exhibit 2: Portfolio risk against the number of genuinely uncorrelated holdings, indexed to one holding = 100. Illustrative. Source: Ray Dalio, Principles (2017); Marcellus calculations.
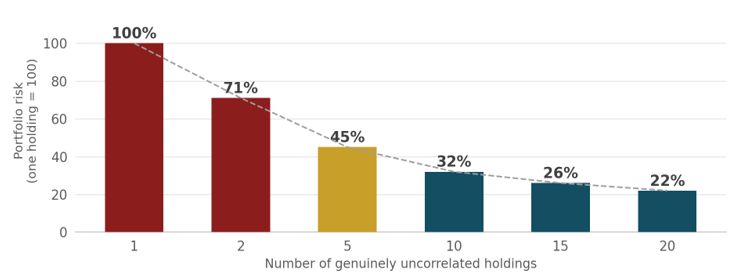
However, simply adding 50 Indian large caps with a good Sharpe ratio does not give you uncorrelated holdings. Even a beautifully built Indian portfolio is one country, one currency, one rate cycle and one political system i.e. clear concentration risk. On Exhibit 3, a concentrated Indian portfolio sits far to the left.
We have built a Global portfolio of diversified, uncorrelated dollar assets
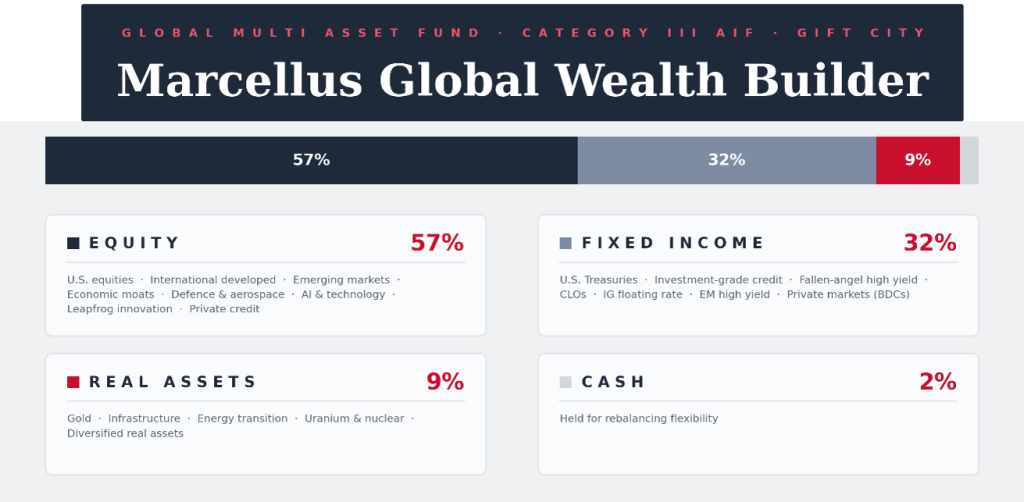
Marcellus, in partnership with American ETF giant VanEck, brings you the Global Wealth Builder. VanEck acts as Model provider, providing model portfolio recommendations for the Global Wealth Builder. Roughly thirty ETFs, held in one globally optimised portfolio, focusing purely on a Dravid style strategy.
Exhibit 3: Allocation across the four sleeves. Weights approximate and will vary. Source: Marcellus Global Wealth Builder. See note [3].
- Uranium and the nuclear fuel cycle, through fuel-cycle and technology leaders.
- Data centres, the landlords of AI: power, cooling and compute.
- Gold miners rather than gold, for operating leverage on the metal.
- Developed & Emerging Markets high yield bonds, income streams no onshore platform offers.
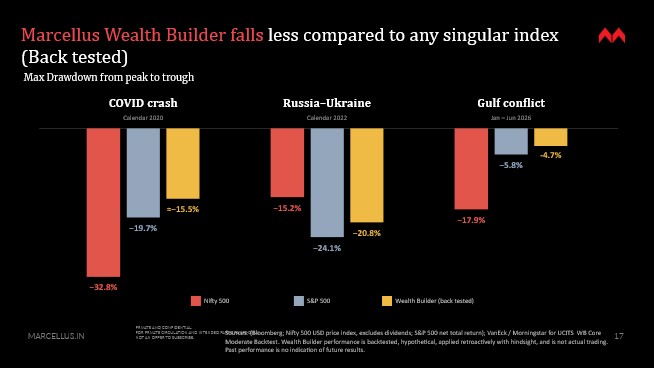
Thirdly, the Global Wealth Builder is exceptionally cost-efficient and tax-efficient due to the unique GIFT City – Cayman Island construct used to bring it to the Indian market. This fund has no STT, no CTT, no US estate-tax exposure, no TCS on corporate allocations and tax-free internal rebalancing.
Does it work?
We tested Marcellus’ Global Wealth Builder on 3 major fronts.
Front one: NIFTY had its best run ever in the last 10 years.
Exhibit 4: Source: Bloomberg/VanEck/Marcellus : Value of $100 invested on 1 March 2016, at 28 February 2026, in US dollars. See notes [4] and [5].
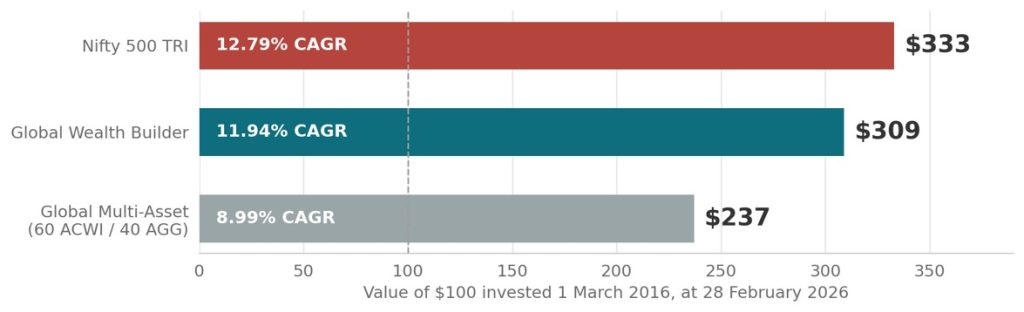
The Nifty 500 TRI compounded at 12.79% against the Wealth Builder’s hypothetical, backtested 11.94%. Even with Indian equities being one of the greatest runs in world markets, a globally diversified portfolio captured 93% of the return.
Front two: Volatility and Drawdowns
Exhibit 5: Source: Bloomberg/VanEck/Marcellus. See note [5].
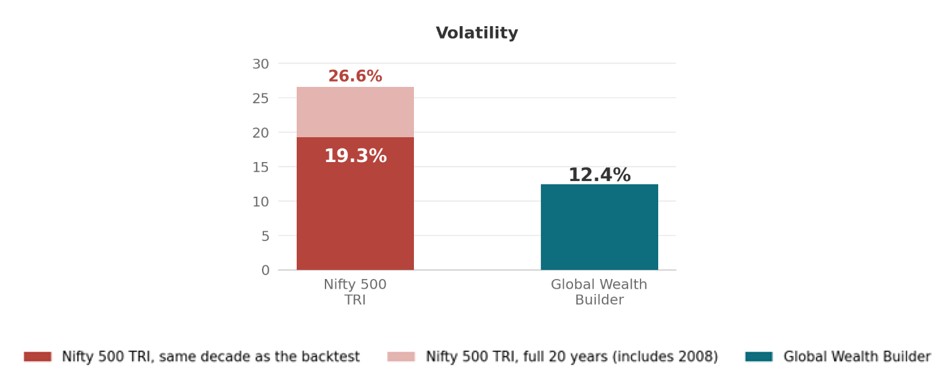
93% of the return, for 64% of the risk. Over the same decade the Nifty 500 TRI carried 19.3% annualised volatility against the Wealth Builder’s 12.4%.
Drawdowns
Exhibit 6 Drawdowns during three market shocks. Wealth Builder backtested; Gulf conflict data to 28 February 2026. Sources: Bloomberg (Nifty 500 USD, excludes dividends); S&P 500 net total return; VanEck / Morningstar. See note [5].
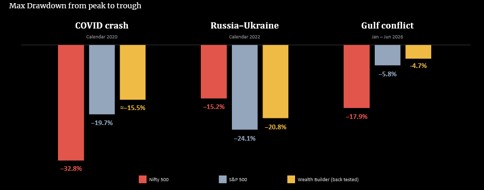
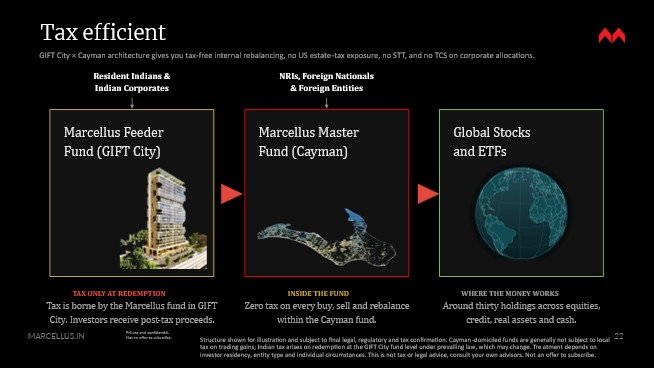
When tested against market shocks, the Global Wealth Builder falls less as compared to any singular index. Drawdowns punish in a way averages conceal, because recovery is asymmetric.
Exhibit 7: Marcellus calculations. See note [5].
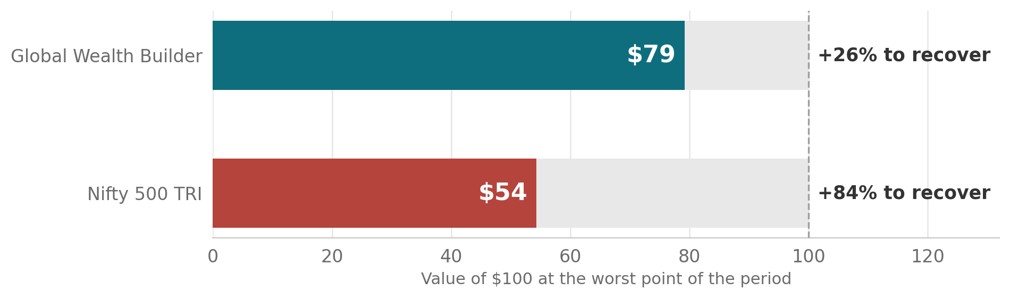
$100 in the Nifty became $54 and needed an 84% gain just to get back to level. In the Global Wealth Builder it became $79 and needed 26%. One is an uncomfortable year. The other consumes the better part of a decade to simply recover.
Front three: Risk adjusted returns are dramatically better
Exhibit 8 see notes [5] and [6]. Sources: ESPNcricinfo; Marcellus calculations.
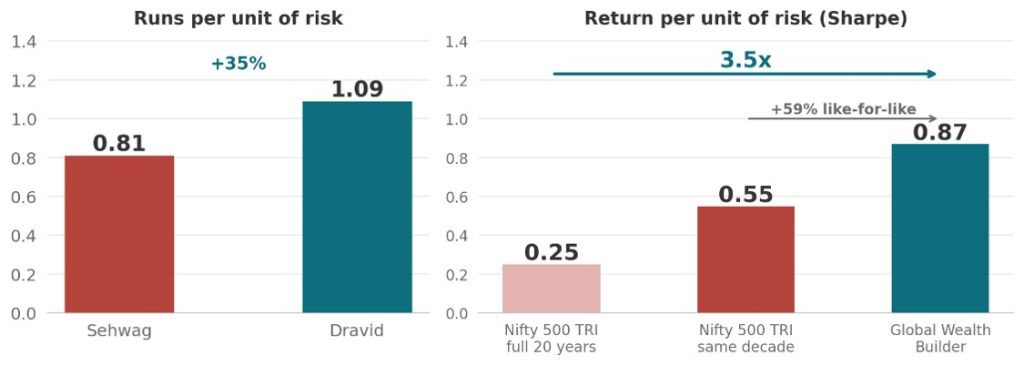
- Indian equity has been a good scorer of runs but a poor converter of risk into return. That is precisely what the Wealth Builder is built to fix.
- The Nifty 500 is Sehwag: more runs per innings, and impossible to plan around. The Marcellus Global Wealth Builder is Dravid: marginally fewer runs, far more of them you can count on.