OVERVIEW
POPULAR ARTICLES

An investor may be able to reduce their risk without necessarily giving up his return, simply by owning assets that do not rise and fall at the same time. Gold mines, nuclear power and commodities are three such assets: each has compounded in dollars over the past decade, yet each has moved very differently from the world’s largest stock market. Historically, they tend to hold their value when energy and food prices rise and interest rates climb, which is exactly, in our view, the winter the world may be heading into. The Marcellus Global Multi Asset Fund (GIFT fund), which invests via the Marcellus Global Wealth Builder Fund (Cayman fund), gains exposure to them through alongside global equities and bond ETFs.
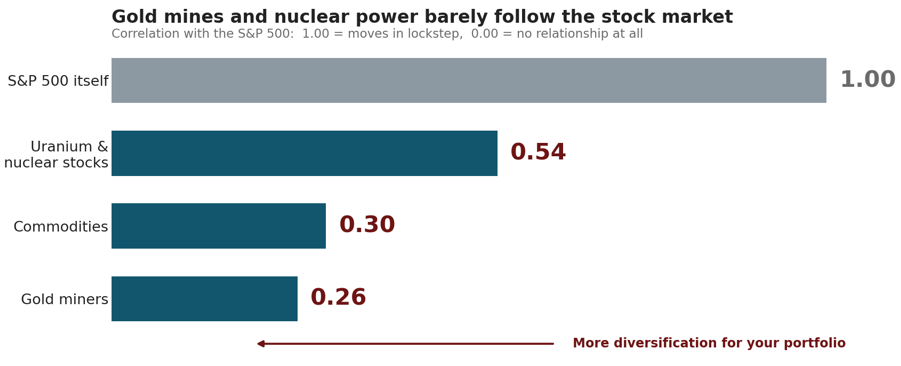
Exhibit 1: Correlation of daily returns with the S&P 500. Listed ETFs are used as proxies and are not Wealth Builder holdings; correlations vary with the period measured. Source: PortfoliosLab, 25 September 2026. See note [1]. Past correlations and returns are not indicative of future results
Harry Markowitz showed the world the power of low correlation
Picture two shops on the same street in Mumbai. One sells umbrellas, the other sells ice-cream. Each earns Rs 10.3 lakh a year. But the umbrella shop earns it in the monsoon and the ice-cream stall earns it in the summer, so whichever shop you own, your best month is seven times your worst.
Now own half of each. Your profit for the year is exactly the same, and the swings almost disappear.
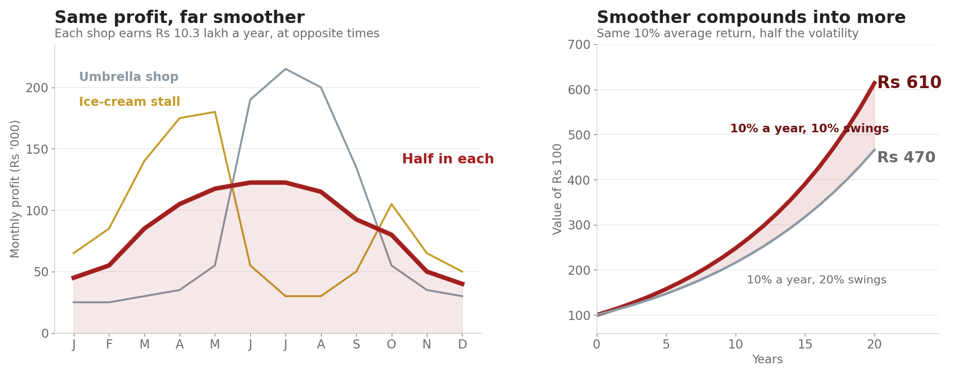
Exhibit 2: Left, monthly profits of two hypothetical Mumbai shops, each earning Rs 10.3 lakh a year, and of an investor who owns half of each. Right, the value of Rs 100 earning 10% a year at two levels of volatility. Illustrative. Hypothetical; not based on actual investments. Source: Marcellus calculations.
That is Markowitz’s insight. What drives the risk of a portfolio is not only how risky each holding is, but whether the holdings move together. Take two assets that each return 10% a year with volatility of 20%, and split your money between them. If they move in lockstep, your volatility stays at 20%. If they are unrelated, it falls to 14%. Your expected return does not change.
Lower volatility is not merely more comfortable, it may help you avoid damaging fall.. Falls are expensive: lose 50% and you need a 100% gain simply to get back to where you started. Over twenty years, Rs 100 earning 10% a year with 20% volatility becomes roughly Rs 470. The same 10% a year with half the volatility becomes roughly Rs 610 (illustrative, assuming the same 10% average annual return in both cases) (Exhibit 2, right).
Owning assets that do not move together is the closest thing to a free lunch in finance(Harry Markowitz): you capture most of the return while reducing the risk.
Diversification
As Ray Dalio’s “Holy Grail” of investing explains, by adding ten to fifteen good, uncorrelated return streams, you keep the average return and substantially reduce the risk. In theory, risk falls with the square root of how many genuinely uncorrelated holdings you own.
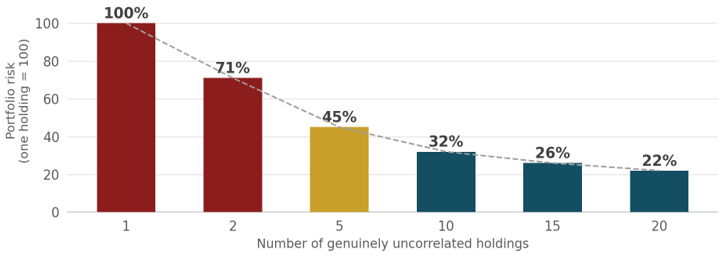
Exhibit 3: Portfolio risk against the number of genuinely uncorrelated holdings, indexed to one holding = 100. Illustrative. Source: Ray Dalio, Principles (2017); Marcellus calculations
However, simply adding 50 Indian large caps with a good Sharpe ratio does not give you uncorrelated holdings. Even a beautifully built Indian portfolio is one country, one currency, one rate cycle and one political system i.e. meaningful single country concentration risk. On Exhibit 3, a concentrated Indian portfolio sits far to the left.
The answer: Diversifying across the world and across uncorrelated assets while seeking competitive long-term returns.
Real assets have historically had low correlation with the stockmarket
So where does an Indian investor find assets that zig when the stock market zags? Three of the real-assets held in the Wealth Builder Portfolio have had low to moderate correlation with the S&P 500 (Exhibit 1), and each has delivered positive US dollar returns over past decade (Shown below – Exhibit 4).
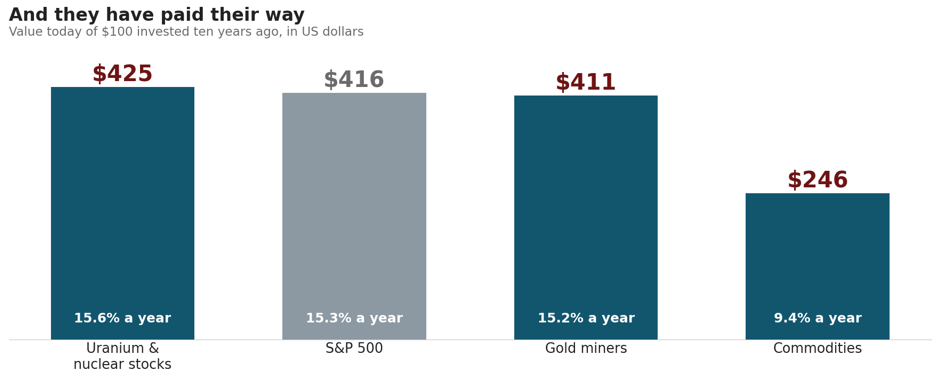
Exhibit 4: Value today of $100 invested ten years ago, in US dollars, with the annualised return. Proxies are the Global X Uranium ETF, SPDR S&P 500 ETF, VanEck Gold Miners ETF and Invesco DB Commodity Index Tracking Fund. Source: PortfoliosLab, 25 September 2026. See note [1]. Past performance is not indicative of future results. Reference to specific asset is not a recommendation.
- Gold mines. A gold mining company is not a vault; it is a factory. It digs ore out of the ground, extracts the gold and sells it at whatever the world price happens to be that day. Its costs are largely fixed, so when the gold price rises, a large part of increase can flow to the bottom line. The industry produced an ounce for about $1,785 in early 2026 and sold it for around $4,300 in September, which is why miners are earning record margins1. It is to be noted that this operating leverage works in reverse when gold prices fall.
- Uranium and nuclear power. Nuclear plants supply about 9% of the world’s electricity, round the clock and whatever the weather. 439 reactors are running today, 79 more are being built and 31 countries have pledged to triple nuclear capacity by 2050, while mine supply still falls short of what reactors need. With the rising power demand in artificial intelligence, data centres need power that never stops, and the hyperscalers have begun signing long-term deals directly with nuclear plants rather than waiting for the grid1. Uranium-related equities can be highly volatile and sensitive to policy, regulatory and safety events.
- Commodities. Oil, copper, aluminium, wheat and the rest, held as a basket. These are the raw inputs whose prices are what inflation is made of, which is why they historically tend to rise when financial assets struggle. Over the past twenty years, a broad commodity basket has moved with the S&P 500 only about a third of the time1
Each of these can stand on its own two feet. Held together, alongside global equities and bonds, they aim to do something more valuable: smooth the ride.
Real assets’ have historically held up well in rising inflation environment
Now let’s look at the winter we believe lies ahead. Three sets of prices are climbing at once:
Energy first. Conflict has flared again in the Gulf, where the US and Iran are trading blows around the Strait of Hormuz, and Brent crude settled above $100 a barrel. Ukraine’s strikes on Russian refineries have squeezed diesel. European gas is at its highest since late 2022, with inventories running low.
Then food. The UN’s food price index rose almost 2% in August. Cereals are at their highest since May 2024 and vegetable oils since June 2022, as Black Sea exports are disrupted and the closure of Hormuz pushes up the cost of fertiliser and freight.
Then the price of money. On 16 September the US Federal Reserve raised rates for the first time since 2023, to 3.75-4.00%, and 16 of its 18 policymakers expect at least one more increase this year. The European Central Bank has already raised once and signalled that rates may have to go higher2
That combination is hostile to conventional portfolios consisting only of financial assets. Real assets are built for precisely this weather: VanEck’s research shows that in the two most recent bouts of high inflation, the 1970s and the mid-2000s, commodities, gold and natural resource companies beat both stocks and bonds, and did so even in the quarters when the economy was shrinking2.
The reason is simple. A gold mine, a uranium deposit and a barrel of oil are scarce physical things, and inflation is what happens when money buys fewer of them. As David Schassler, who heads VanEck’s Multi-Asset Solutions team says, in periods of inflation “you have to own assets with embedded scarcity”2
In a winter of scarce real assets and abundant money supply, we believe it makes sense to own scarce things.
We have built a Global portfolio of diversified, low-correlated US dollar assets
Marcellus, in partnership with American ETF giant VanEck, brings you the Global Wealth Builder through its GIFT IFSC Category III AIF ‘Marcellus Global Multi Asset Fund’. VanEck acts as Model provider, providing model portfolio recommendations for the Global Wealth Builder. Roughly thirty ETFs, held in one globally optimised portfolio, following a steady, “Dravid style” strategy.
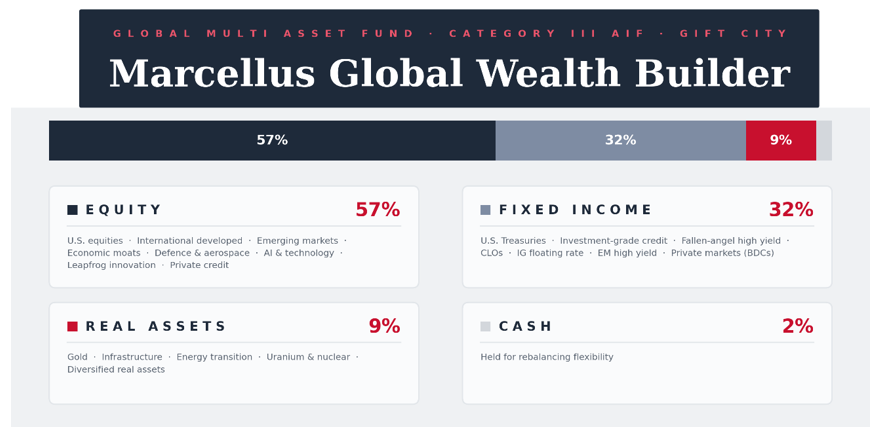
Exhibit 5: Allocation across the four sleeves. Weights approximate and will vary. Source: Marcellus Global Wealth Builder. See note [3]. Indicative allocation, subject to change without notice.
- Uranium and the nuclear fuel cycle, through fuel-cycle and technology leaders.
- Data centres, the landlords of AI: power, cooling and compute.
- Gold miners rather than gold, for operating leverage on the metal.
Developed & Emerging Markets high yield bonds, income streams no onshore platform offers.
Does it work?
We reviewed the hypothetical, back tested performance Global Wealth Builder on 3 fronts:
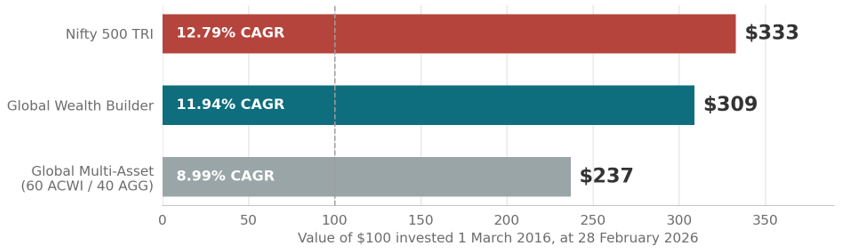
Exhibit 6: Source: Bloomberg/VanEck/Marcellus : Value of $100 invested on 1 March 2016, at 28 February 2026, in US dollars. See notes [4] and [5]. Wealth Builder figures are hypothetical and backtested, not actual Fund performance, and are before Fund-level fees.
The Nifty 500 TRI compounded at 12.79% against the Wealth Builder’s hypothetical, backtested 11.94% The VE data is net of fees) Even with Indian equities being one of the greatest runs in world markets, a globally diversified portfolio would have captured 93% of the return.
Front two: Volatility and Drawdowns
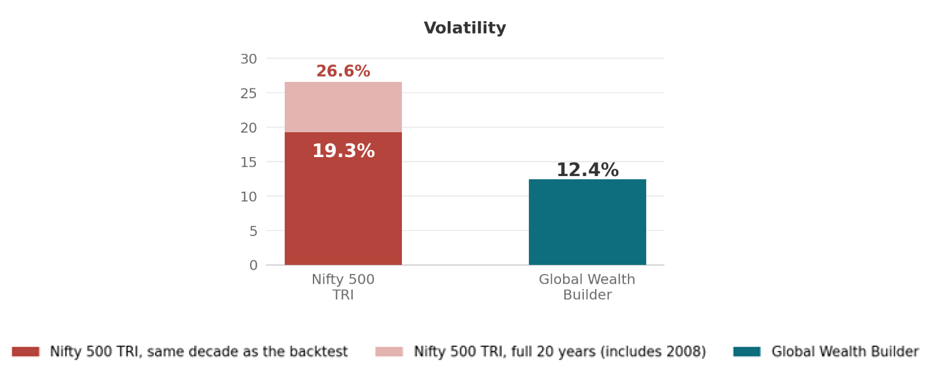
Exhibit 7: Source: Bloomberg/VanEck/Marcellus. See note [5]. Wealth Builder numbers are hypothetical, and backtested.
93% of the return, for 64% of the risk. Over the same decade the Nifty 500 TRI carried 19.3% annualised volatility against the Wealth Builder’s 12.4%.
Hypothetical Risk adjusted returns have been better
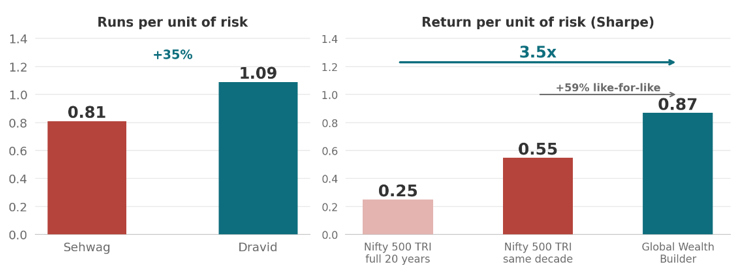
Exhibit 8. see notes [5] and [6]. Sources: ESPNcricinfo; Marcellus calculations. Wealth Builder numbers are hypothetical and backtested.
- Indian equity has been a good scorer of runs but a poor converter of risk into return. That is precisely what the Wealth Builder is built to fix.
- The Nifty 500 is Sehwag: more runs per innings, and impossible to plan around. The Marcellus Global Wealth Builder is Dravid: marginally fewer runs, far more of them you can count on.
+Sources & notes
[1] Correlations and returns: PortfoliosLab, accessed 25 September 2026, using the URA, DBC, GDX and SPY ETFs as proxies. Gold miners and equities: Dar, Bhanja and Paul, International Review of Economics & Finance 59 (2019): 369-84. Mining costs: World Gold Council, Gold Demand Trends, Q2 2026. Nuclear and uranium data: Sprott Asset Management, Uranium Miners ETFs Investor Presentation, 30 June 2026.
[2] Energy prices: CNN Business, 9 September 2026; Bloomberg, 12 September 2026. Food prices: FAO Food Price Index, August 2026. US rates: Federal Reserve, FOMC statement, 16 September 2026. Real assets and inflation: VanEck, “Real Assets ETF (RAAX): Question & Answer” and David Schassler, “Why Real Assets Belong in the AI Trade”, 9 June 2026.
[3] Source: Marcellus Global Wealth Builder and VanEck. Weights approximate and rounded; sub-asset groupings illustrative and not a complete list. Holdings and weights will vary. Tolerance bands indicative and subject to change. Diversification does not ensure a profit or protect against loss.
[4] Nifty 500 Total Return Index in US dollars. The comparison period is 1 March 2016 to 28 February 2026. The base is the close of 29 February 2016 (122.15), so that the first return day is 1 March 2016, and the end point is the close of 27 February 2026 (406.68), the last trading day of the period.
[5] Wealth Builder and Global Multi-Asset returns are from the VanEck UCITS WB Core Moderate. Performance is backtested, hypothetical, applied retroactively with hindsight, not actual trading, and net of underlying fund fees only. Wealth Builder volatility of 12.4% and maximum drawdown of 20.8% are as disclosed by VanEck / Morningstar; Sharpe ratios throughout this piece are excess return over an assumed 2.0% risk-free rate divided by annualised volatility, applied identically to every portfolio shown, which is the convention used in the underlying Marcellus asset-allocation testing.
[6] Long-run Nifty 500 context: over the full twenty years of data available to us, the Nifty 500 TRI in US dollars compounded at 8.72% with annualised volatility of 26.6%, a Sharpe ratio of 0.25 and a maximum drawdown of 72.5%, the latter during the 2008 crisis. These figures cover a longer window than the Wealth Builder backtest, which begins in March 2016; they are shown as context only and are deliberately not presented as a like-for-like comparison. The gain required to recover a 72.5% drawdown is 264%.
[7] Fees are per annum, charged on NAV monthly. The Master Fund management fee and Model Provider fee apply in addition. Underlying ETF costs are borne by the Fund as investor and may be passed to the Model Provider. LTCG 12.5% after two years; STCG at marginal rate before. Terms indicative and may change; read the PPM before investing. VanEck acts as Model Provider to the Cayman fund, compensated with fees, providing a non-binding, non-discretionary model.
Click Here for details about our regulatory registration and licensing information.
This material is provided for informational purposes only and does not constitute investment research, investment advice, an offer, solicitation, or recommendation to invest in any security, fund, or investment strategy. Marcellus Investment Managers Private Limited (“Marcellus”), through its GIFT IFSC branch, is registered with the International Financial Services Centres Authority (“IFSCA”) as a Fund Management Entity – Retail, , and is registered with the U.S. Securities and Exchange Commission (“SEC”) as an Investment Adviser. The Marcellus Global Multi Asset Fund (the “Fund”) is an open-ended Restricted Scheme (Non-Retail) offered on a private placement basis to eligible investors only. Marcellus International Investment Managers LLC, a wholly owned subsidiary of Marcellus, manages the underlying Cayman-domiciled fund, which is regulated by the Cayman Islands Monetary Authority (CIMA), as a private fund; no invitation is made to the public in the Cayman Islands. The Fund may invest substantially in an underlying Cayman-domiciled fund and investors may therefore be exposed to risks associated with the feeder-master structure and the underlying fund. Any model portfolio, asset allocation, investment framework or illustrative example presented herein is for illustrative purposes only and does not represent actual portfolio holdings, performance or future investment outcomes; actual allocations and holdings may differ materially. Neither IFSCA, CIMA nor the U.S. SEC has reviewed, approved, endorsed or verified the contents of this material. Investments involve risk, including the possible loss of principal. Past performance is not indicative of future results and there can be no assurance that any investment objective or targeted outcome will be achieved. Any forward-looking statements are based on current assumptions and are subject to risks, uncertainties and changes in market, economic, regulatory and other conditions. Any references to tax treatment or tax efficiency are general in nature and subject to applicable laws and regulations, which may change over time. This material does not constitute tax, legal or accounting advice; investors should consult their own professional advisers regarding the suitability and implications of any investment. This communication is not intended for U.S. persons or for any jurisdiction where its distribution would be unlawful. Marcellus, its affiliates, employees and related persons may have financial interests in securities or investments referred to herein. VanEck is not affiliated with Marcellus, is not the investment manager of the Fund and does not sponsor or endorse the Fund. This material may not be reproduced, distributed or circulated without the prior written consent of Marcellus. Copyright © 2026 Marcellus Investment Managers Pvt Ltd, all rights reserved.