
Balancing the trade off between errors of commission and errors of omission in stock picking is essential to any investing process. In this newsletter we explain why these two errors are NOT created equal and usually portfolio hit rate is more sensitive to errors of commission. MeritorQ‘s rigorous rules-based screening steps in which we reject nearly 80% of the investment universe, ensures that we minimize risk by focusing on errors of commission, even as we forego some of the upside due to errors of omission.
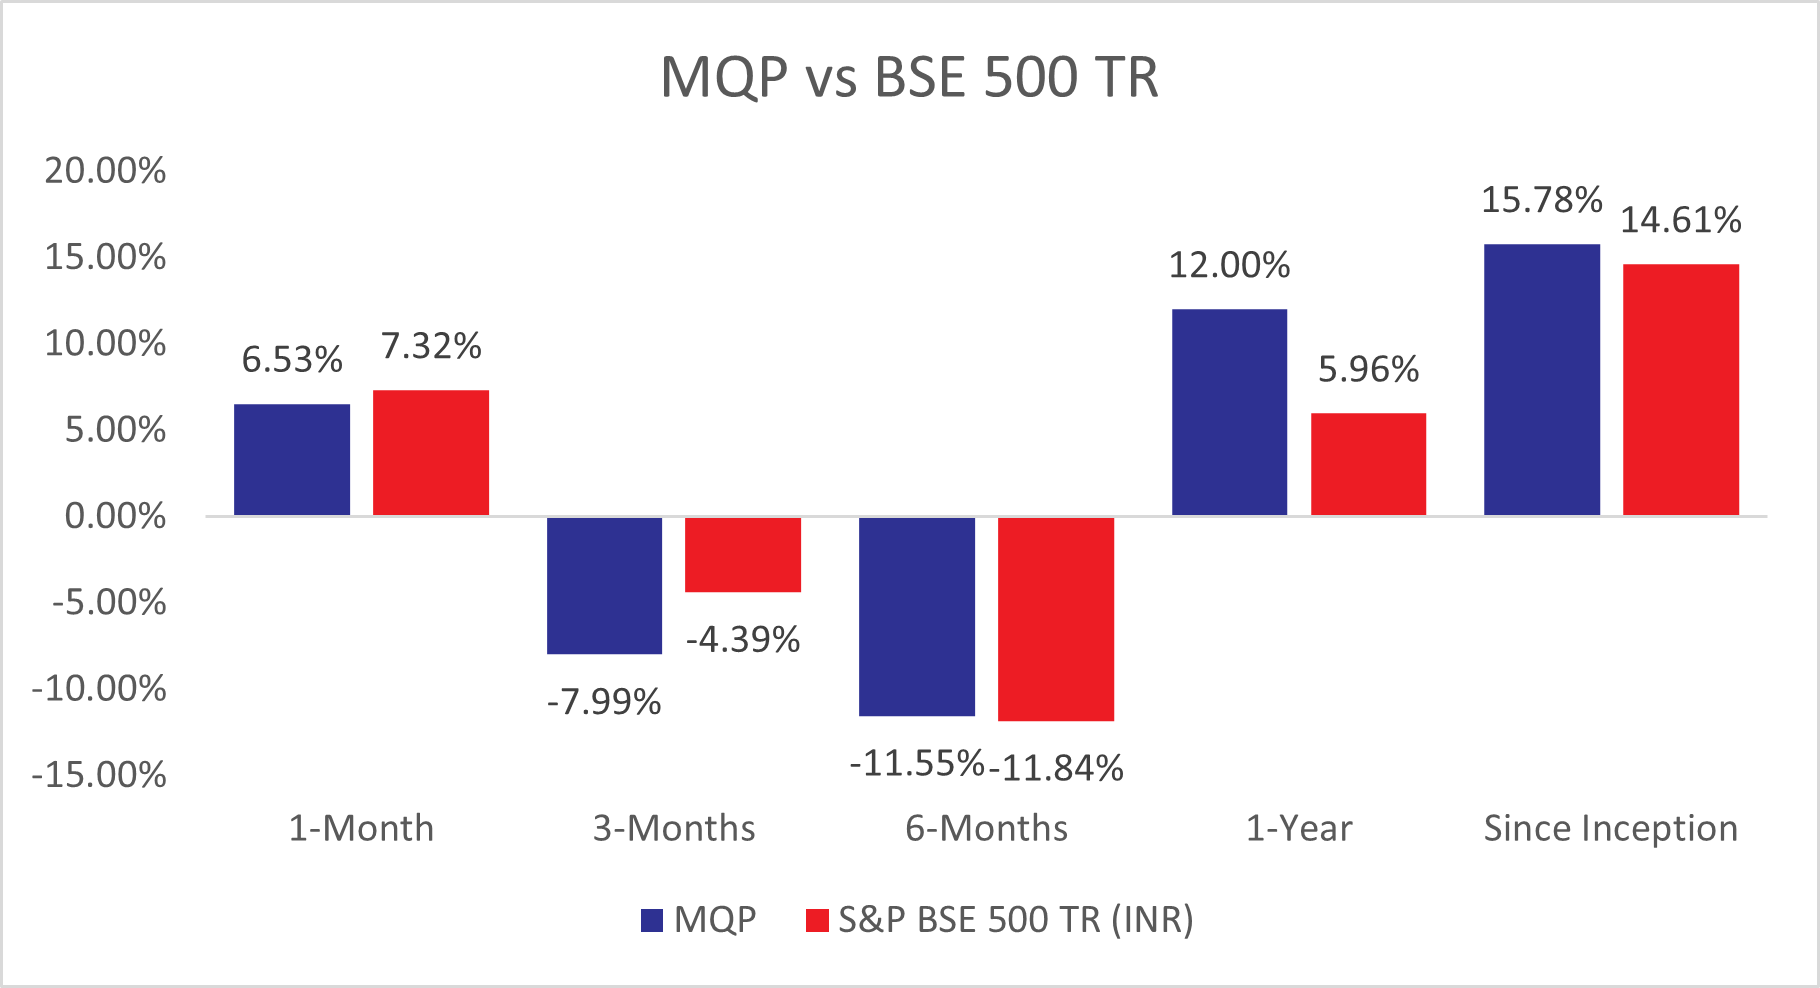
Source: Marcellus Investment Managers. (i) Portfolio inception date is November 15, 2022. (ii) Returns shown are as of March 31, 2025.Performance Data shown is net of fixed fees and expenses charged till March 31st, 2025 and is net of Performance fees charged for client accounts, whose account anniversary / performance calculation date falls upto the last date of this performance period; since inception & 3 years returns are annualized; other time period returns are absolute.For relative performance of particular Investment Approach to other Portfolio Managers within the selected strategy, please refer https://www.apmiindia.org/apmi/welcomeiaperformance.htm?action=PMSmenu, Under PMS Provider Name please select Marcellus Investment Managers Private Limited and select your Investment Approach Name for viewing the stated disclosure. The calculation or presentation of performance results in this publication has NOT been approved or reviewed by the US SEC, SEBI or any other regulatory authority.
“Rule No. 1: Never lose money.
Rule No. 2: Never forget Rule No. 1.” – Warren Buffett (source: link)
One of the core tenets of MeritorQ’s investment approach is to reduce the risk of making investments where there could be permanent loss of capital. Investing errors can be broadly classified into two distinct buckets: errors of commission and errors of omission, which are also called as Type 1 and Type 2 errors, respectively.
• Type 1 Errors (Errors of Commission): This occurs when an investor makes an investment, believing it will be profitable, but it ultimately turns out to be loss making (whether in absolute terms or relative to the benchmark). It is the act of committing capital to a bad investment, resulting in self-inflicted harm. In the medical profession, this is called a ‘false positive’.
• Type 2 Errors (Errors of Omission): This arises when an investor fails to invest in an opportunity that subsequently generates significant returns. It is the error of rejecting a potentially beneficial investment. In the medical profession, this is called as a ‘false negative’.
The Inherent Trade-off Between Type I and Type II Errors
Minimizing the likelihood of committing a Type I error (making bad investments) often increases the probability of making a Type II error (missing good investments), and vice versa. An overly optimistic investor, inclined to see potential upside in numerous ventures, may commit several Type I errors by investing in flawed businesses. However, this same optimism might lead them to participate in a higher proportion of genuinely successful investments, thus reducing Type II errors.
Conversely, an overly cautious investor, perpetually scrutinizing potential downsides and finding reasons to reject opportunities, is likely to make fewer Type I errors by avoiding bad investments. However, their stringent selectivity will inevitably cause them to miss out on some genuinely good investments, increasing the incidence of Type II errors. This inherent trade-off necessitates a conscious decision on the part of the investor regarding which type of error they are more willing to tolerate.
Let’s assume an investment universe of 500 stocks similar to what we consider in MeritorQ. Further assume, that 30% of these or 150 companies are “good investments”. This is not too far from empirical evidence and our own analysis, which shows that on an average only ~35% of stocks in the BSE 500 outperformed the index over subsequent 10 years. From the 150 “good” companies, an investor whose Type II error rate is 20%, will correctly select 80% (120 good companies) as good investments and mistakenly reject 20% (30 companies- a Type II error). From the remaining 350 “bad” investments, assuming the type I error rate is again 20%, the investor will correctly reject 80% (280 companies) and mistakenly accept 20% (70 companies- a Type I error).
Therefore, the investor’s universe of what they think are good investments comprises the 120 correctly identified good investments plus the 70 mistakenly identified bad investments, totalling 190 companies.
The actual probability of a chosen investment being good is then calculated as the number of correctly identified good investments divided by the total number of investments the investor believes to be good: 120 / 190 = 63% (this can be the considered the investor’s hit rate). Hence, even with a seemingly impressive 80% accuracy rate, ~37% of the investor’s investments will turn out to be bad. The underlying reason is the disproportionately large number of “bad investment” opportunities relative to good ones available in the market.
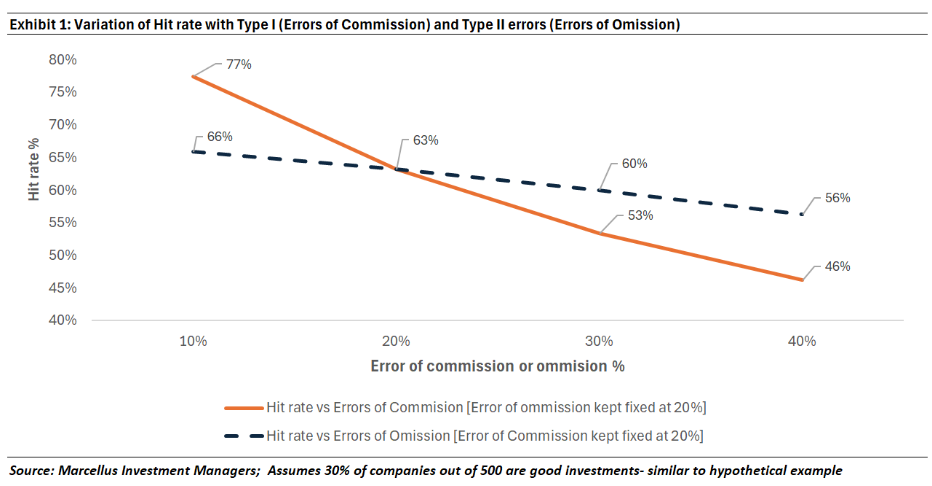
Exhibit 1 shows the asymmetrical impact of reducing each type of error on an investor’s overall success rate, with the same assumptions as detailed in the hypothetical example above. As Type I error rate increases from 10% to 40% (keeping Type II error at 20%)- the investor’s hit rate decreases from 77% to 46%. Conversely, if Type II error rate increases from 10% to 40% (keeping Type I error at 20%)- investor’ hit rate decreases by only about 10 pts. The steeper slope of the hit rate versus Type I error (compared to Type II error; orange versus blue line) means that every 1% change in errors of commission has relatively larger impact on hit rate than errors of omission.
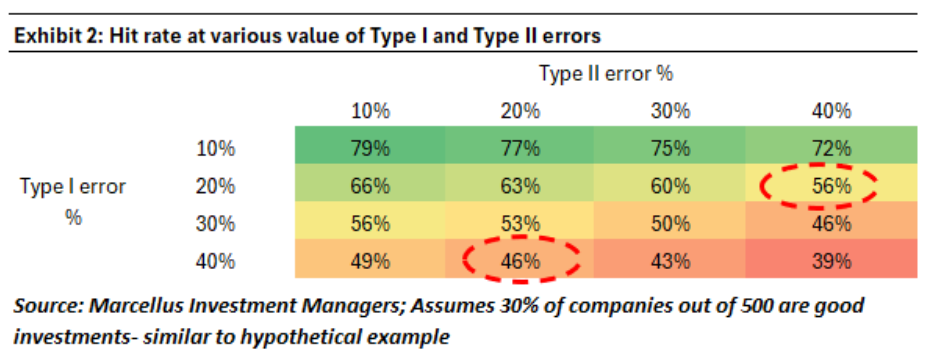
Given the inverse relationship between the Type I and II errors, the practical implication is that investors should pay greater attention to avoiding losers than worry about the foregone benefits from having missed identifying future outperformers. For example, as exhibit 2 shows, controlling Type I error at 20% even with Type II error at 40% is more acceptable, than the converse case (shown highlighted).
In this context, the screening steps in MeritorQ, in which we reject roughly ~80% of the investment universe before selecting basis value and quality, helps us in reducing the Type I errors at the cost of missed opportunities.
- About half of the rejections (~200 companies) are due to the forensic screening step where we remove companies with accounting irregularities based on financial disclosures. The forensic screen penalizes companies in sectors where there is higher chance of poor accounting quality like real estate, infrastructure and industrials. More details on forensic screening can be found in our February-2023 and March-2023 newsletters.
- We also remove companies with high debt and inconsistent profitability Excessive leverage increases vulnerability to unforeseen events and economic downturns (though it can also boost of return on capital in short run). Over last decade, one can find numerous examples of high debt companies (ADAG group companies, Essar Steel etc.) going bankrupt.
- The consistent profitability screen ensures that we avoid highly cyclical companies (mostly in oil & gas, metals/mining sectors), turnaround situations and companies in new age industries with no previous track record of profitability. Though there is a risk that we miss out on next multi-bagger with this screen, we think we are better off looking elsewhere and avoiding speculative bets, where downside could be equally large.
Hence, MeritorQ’s rules-based multi-step screening process reflect a conscious decision to prioritize the risk minimization by avoiding Type I errors, even if it means potentially sacrificing some high-return opportunities in the future.
Team Marcellus

