Marcellus Investment Managers - One of the Best Portfolio Management Service Companies in India
  • Region
    India USA
  • Our Philosophy
  • Offerings

    Portfolio Management Services (PMS)


    Indian Equities
    Consistent Compounders Rising Giants Little Champs Kings of Capital MeritorQ PMS Curation Portfolio
    Global Equities
    Global Compounders PMS
    Global Equities Fund (Retail)
    Multi Asset
    Multi Asset PMS

    Asset Allocation Services


    Asset Allocation        

    Portfolio Advisory Services


    Indian Equities
    MeritorQ Advisory (Smallcase)        
    Multi Asset
    Aggressive Allocation Balanced Allocation Conservative Allocation
  • Insights

    Newsletters


    Consistent Compounders Kings Of Capital Little Champs Rising Giants Marcellus Erudite MeritorQ PMS Global Compounders

    Insights


    Recents Blogs Newsletters Portfolio Updates 3 Longs and 3 Shorts

    Videos


    Featured Webinars Client Exclusive

    Podcasts


    All MeritorQ Podcasts (English) MeritorQ Podcasts (Hindi)
    Client Exclusive Content

    Others


    Client Exclusive Content Three Longs & Three Shorts Blogs Videos Media Centre
  • Resources
    Support Resources Online Access Guide Marcellus’ Forms UPI Payment
    Disclosure document GIFT City Disclosure PMS Fees Calculator
  • Team
  • PLAN YOUR GOALS
    • Invest Now
      • Portfolio Management Services (PMS)
      • Investment Advisory Services
      • Global Equities Fund (Retail)
  • Subscribe
  • Connect
  • Login
  1. Newsletter
  2. April 2025
Apr 2025 Marcellus Erudite

Portfolio Performance and Update on Fundamentals – April 2025

Published on Apr 16, 2025 · 3 Min Read

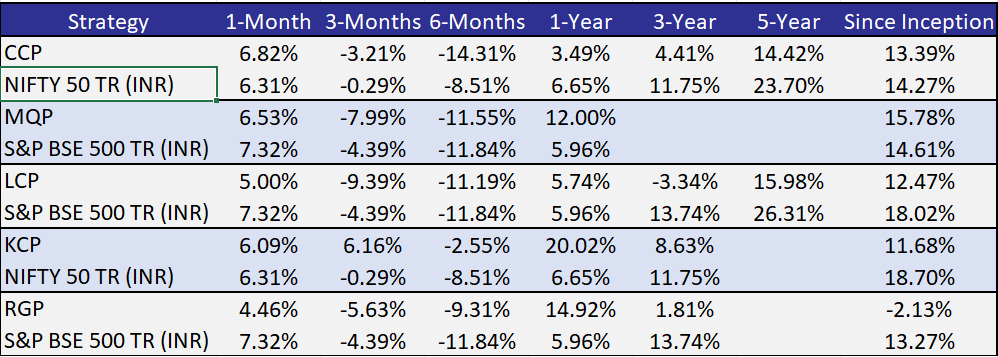
Performance of Marcellus Domestic Strategies for March 2025

Note: For all strategies except GCP, Performance data shown is net of fixed fees and expenses charged till March 31st, 2025 and is net of annual performance fees (Except for Little Champs Portfolio) charged for client accounts whose account anniversary/performance calculation date falls upto the last date of this performance period. Since, for Little Champs Portfolio, performances fees are charged on cumulative gains at the third anniversary, of the respective client account, the effect of the same has been incorporated for client accounts whose third account anniversary falls upto the last date of this performance period. Performance data is not verified either by Securities and Exchange Board of India, IFSCA or U.S. Securities and Exchange Commission.
For GCP, performance data is shown gross of taxes and net of fees & expenses charged till end of last month on client account. Returns more than 1 year are annualized. Performance is the combined performance of our RI and NRI strategies. GCP USD returns are converted into INR using exchange rate published by RBI. Source:  https://www.rbi.org.in/scripts/ReferenceRateArchive.aspx
*For relative performance of particular Investment Approach to other Portfolio Managers within the selected strategy, please refer https://www.apmiindia.org/apmi/WSIAConsolidateReport.htm?action=showReportMenu Under PMS Provider Name please select Marcellus Investment Managers Private Limited and select your Investment Approach Name for viewing the stated disclosure.
Note: APMI provides performance data of Portfolio Managers managing domestic strategies only. Hence, GCP is excluded.

Consistent Compounders Portfolio (CCP)

Businesses and equity markets are going through a period of heightened volatility due to the uncertainty around the implication of ongoing global tariff wars and domestic macro factors like weakening consumption demand, slowing government capex and no significant rise in private capex. Here is our perspective on how CCP portfolio is positioned in the current environment:

  1. Limited direct exposure to global trade in CCP : On a weighted average basis, CCP portfolio has approx..20% of its profits coming from businesses carried out outside India – including export led businesses such as Divis and HCL Tech, and Cayman Islands based business of Narayana Hrudayalaya. Of this exposure to businesses carried outside India, less than half is carried out with the US, hence only a small direct exposure to US exports at a portfolio level. Moreover, there are several offsetting factors at play while considering the implications on this non-India business exposure of our portfolio companies, such as: a) pricing power of companies such as Divis in their API and CDMO exports that are inputs for essential drugs globally, including the US; and b) lack of any direct exposure to tariff wars for healthcare offered by Narayana to the population of Cayman Islands (NH is one of the largest allocations in CCP and half of its consolidated profits are generated in Cayman Islands).
  2. ‘Quality’ is likely to outperform vs the broader market in a difficult external environment : Nifty50’s EPS CAGR over FY21-24 was a staggering 24.3% (Source: Avendus Spark) – a cyclically high period for the market. This supported Nifty50’s Index performance of 15.0% over the same period. With India’s nominal GDP growth rate hovering around the 10-12% mark, fundamentals of the broader stock market (and hence of the Nifty50 Index as a benchmark) are not likely to be more than 2-3% points higher than the economic growth rate over the long term. Hence, after delivering an EPS CAGR of 24.3% over FY21-24, we expect mean reversion for the Nifty50’s EPS growth in future. Moreover, unlike FY21-24 which was marked by cyclical tailwinds such as strong government capex driving a broad-based and healthy economic growth, over the next 12-24 months, businesses in general will face macro headwinds, both from global as well as domestic factors. In this backdrop, we expect fundamental moats and capital allocation of high quality businesses to drive resilience, superior earnings growth and capital allocation opportunities. We continue to remain quality oriented and absolute return oriented – hence we will continue to avoid exposures to certain sectors which don’t meet our stock selection criteria, even if they are a meaningful part of the broader benchmark indices and/or might generate healthy share price returns in the short term for the index. This approach we believe is best placed to navigate well through the ongoing difficult external environment.
  3. CCP has delivered mid-teens earnings growth in the first nine months of FY25 and the changes made the portfolio in 2024 have helped further enhance the portfolio’s expected EPS CAGR: The table below highlights how the EPS growth of our current portfolio has been in FY25 so far – healthy and consistent despite a weak external macro environment (reflected in the Nifty50’s weak EPS growth during FY25).
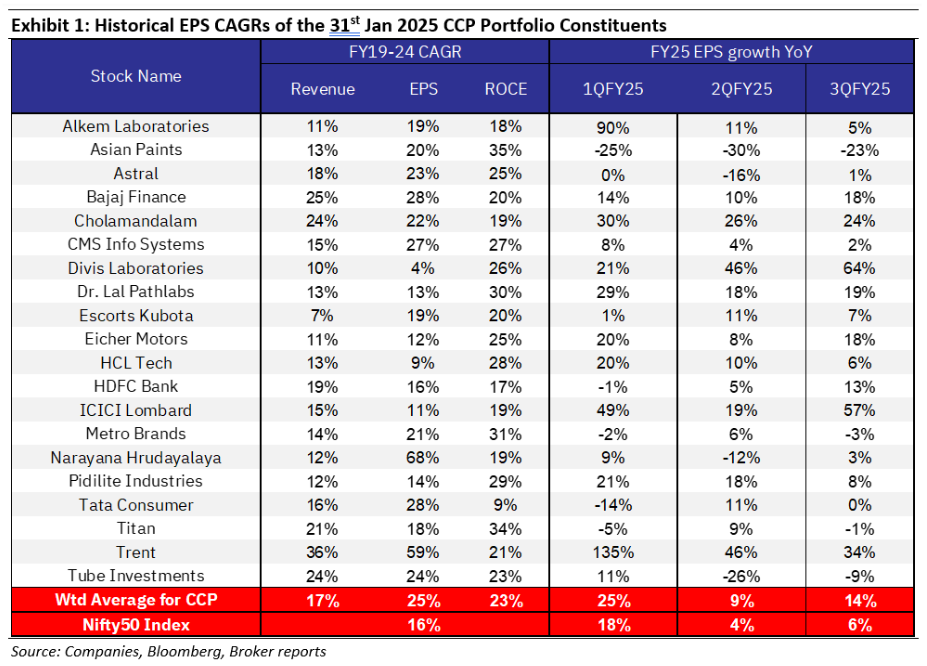
Historical EPS CAGRs of the 31st Jan 2025 CCP Portfolio Constituents

Global Compounders (GCP)

March proved to be a highly eventful month. The continuous stream of headlines, which had started to taper off by the third week of February, returned in full force. Speculation around tariff measures involving Mexico, Canada, Europe, and China dominated discussions. Adding to market anxiety, major companies like Walmart issued weak forward guidance, triggering some panic. As a result, the S&P 500 ended March in the red, retracting approximately 6% from its peak. However, the beginning of April brought even more turbulence. On April 2, dubbed “Liberation Day,” initial “reciprocal” tariffs were announced. These tariffs were far harsher than anticipated, leading to a sharp negative market reaction.

The prevailing concerns can be categorized into three key areas:
  1. Tariffs could increase raw material costs, negatively impacting the earnings per share (EPS) estimates of many companies and reflecting broadly at the S&P 500 index level.
  2. Rising inflation could hurt demand and increase the cost of capital.
  3. The interplay of these factors could potentially lead to a recession—though this is not our base case scenario. While we recognize that consumer sentiment remains subdued, the data surrounding leverage levels for both consumers and large corporations suggests a more stable backdrop, mitigating the risk of a downward spiral. While consumption may not be surging, there is no compelling evidence to indicate that it is collapsing either.
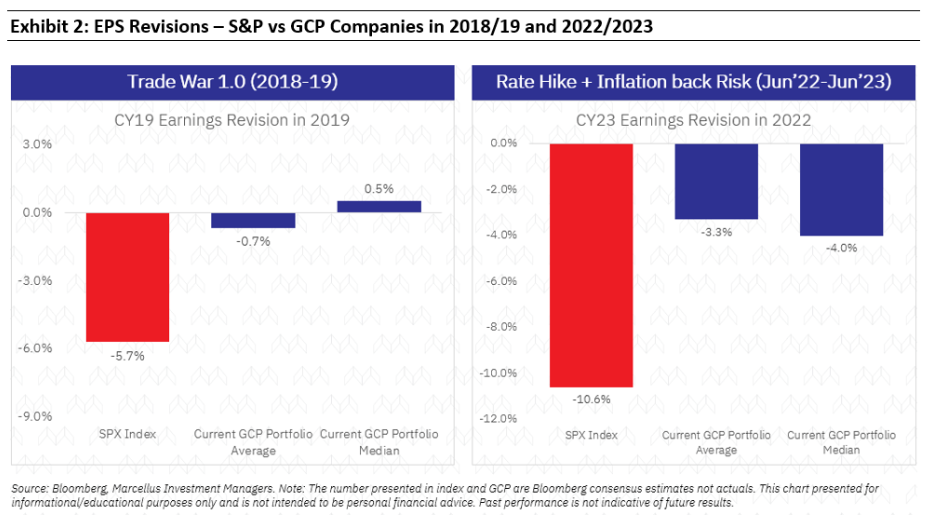
To quantify the potential impact of concerns #1 and #2, we analyzed two previous periods: 2018 (Trade War 1.0) and 2022 (a period marked by high inflation). In both cases, we observed downward EPS revisions (red bars), which we compared against average and median EPS revisions during the same timeframes (blue bars).
EPS Revisions - S&P vs GCP Companies in 2018/19 and 2022/23
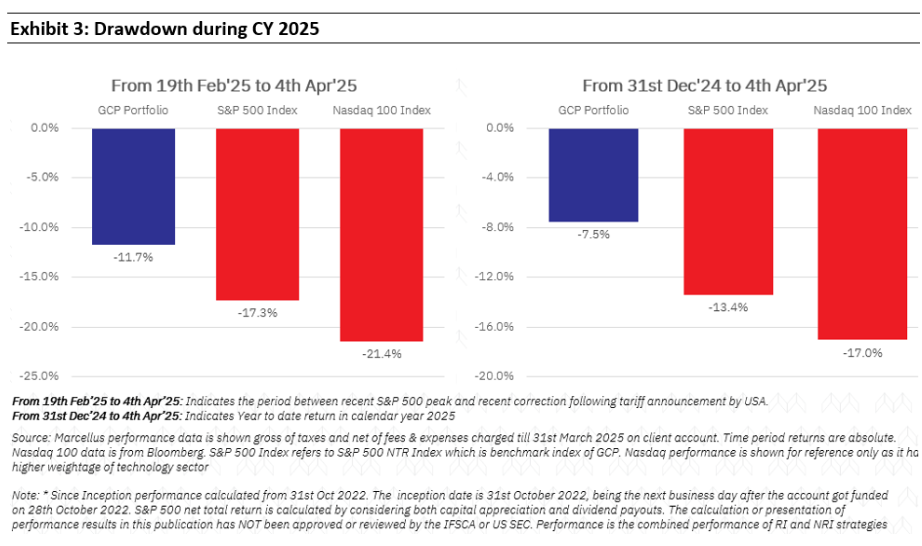
The data clearly shows that GCP companies experienced much more modest earnings revisions compared to the broader market. This resilience is also evident in the peak-to-trough drawdown (from February 19, 2025, to April 4, 2025) within the live GCP portfolio as well as in its year-to-date (YTD) performance (December 31, 2024, to April 4, 2025), as illustrated below.
Drawdown during CY 2025
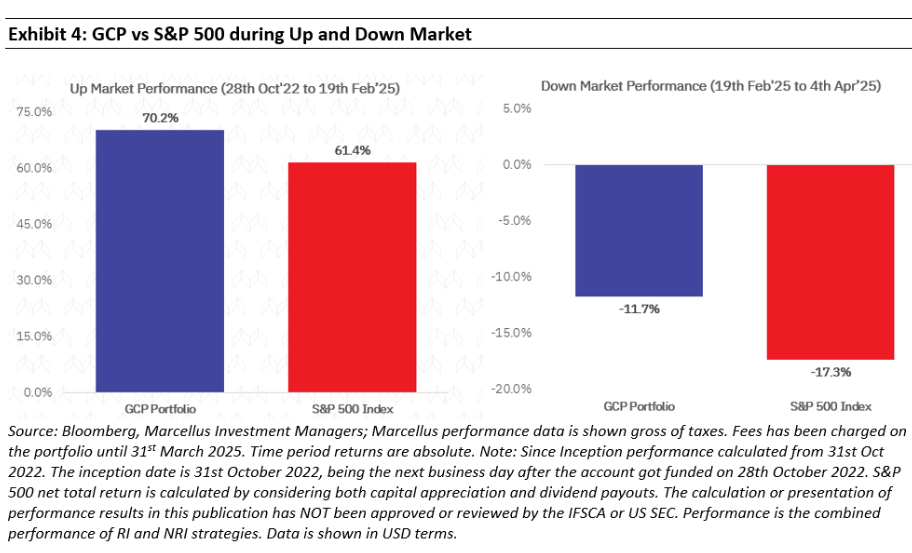
This period served as a valuable stress test for the GCP portfolio’s quality. We have always positioned it as an all-weather portfolio. While we held high conviction in its resilience, it was reassuring to see this conviction validated during challenging times.
GCP vs S&P 500 during Up and Down Market
As we continue refining our portfolio philosophy, we remain confident that the GCP portfolio will generate long-term value for investors.

Portfolio Adjustments

We made minimal changes to the portfolio during this period as market dislocations increased our list of buying opportunities.

Valuation Insights
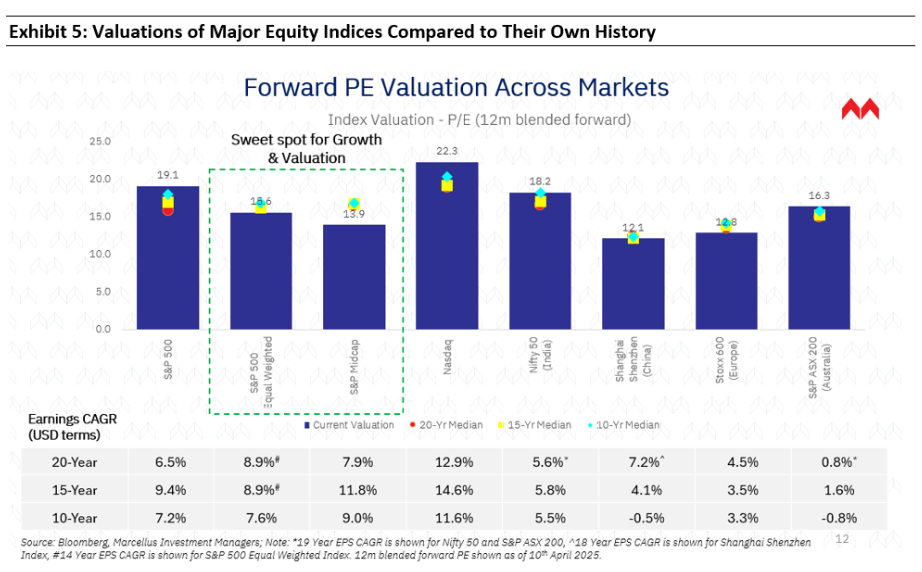
Regarding valuations—a frequent topic of inquiry—the broader U.S. market (S&P 500 Equal Weighted and S&P 400 Midcap) is trading at cheaper levels relative to its own historical averages over the past 10-20 years. In contrast, other major global markets are closer to their long-term averages. It’s worth noting that U.S. markets have historically delivered superior EPS growth and RoE compared to their international peers. Unless future growth rates deviate significantly from historical trends, cross-country price-to-earnings (P/E) comparisons may be less meaningful than comparisons against each market’s historical norms.
Valuations of Major Equity Indices compared to their own History
Before concluding this update, it’s worth mentioning Howard Marks’ latest memo titled “Nobody Knows (Yet Again)”, released earlier this week. As always, his insights are invaluable. One quote stands out:
“But we also have to bear in mind that deciding not to act isn’t the opposite of acting; it’s an act in itself. The decision to not act – to leave a portfolio unchanged – should be scrutinized as critically as a decision to make changes. The old saws that are the refuge of terrified investors – “we’re not going to try to catch a falling knife” and “we should wait for the dust to settle and the uncertainty to be resolved” – cannot in themselves be allowed to determine our behavior. I love the title of a book by a market analyst named Walter Deemer: “ When the Time Comes to Buy, You Won’t Want To.” The negative developments that make for the greatest price declines are terrifying, and they discourage buying. But, when unfavorable developments are raining down, that’s often the best time to step up”
Oaktree Memo by Howard Marks – Nobody Knows (Yet Again) – April 9, 2025
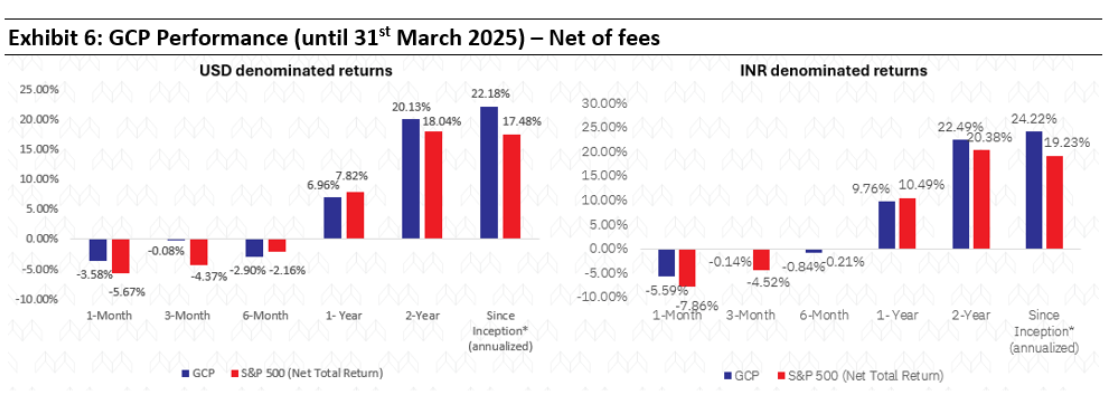
GCP Performance - March 2025 - net of fees
Marcellus performance data shown is gross of taxes and net of fees and expenses charged until the end of last month. Performance fees are charged annually in December. Returns for periods longer than one year are annualized. Marcellus’ GCP USD returns are converted into INR using exchange rate published by RBI. Source:  https://www.rbi.org.in/scripts/ReferenceRateArchive.aspx
Since Inception’ performance calculated from 31st Oct 2022. The inception date is 31st October 2022, being the next business day after the account got funded on 28th October 2022. S&P 500 net total return is calculated by considering both capital appreciation and dividend payouts.
The calculation or presentation of performance results in this publication has NOT been approved or reviewed by the IFSCA or SEC. Performance is the combined performance of RI and NRI strategies.
Kings of Capital Portfolio (KCP)

March month marked a strong recovery in Indian markets, it was the first month of positive returns for the broader markets after declining for five straight months. KCP (post fees) NAV was up ~6.09%, in-line with 6.31 and 6.66% for Nifty and Bank Nifty respectively. Over the past 6, 12 and 24 months, the Kings of Capital portfolio has outperformed the Nifty and Bank Nifty indices as the euphoria and investor interest in public sector banks and tier-II private banks has subsided over the past couple of quarters. Furthermore, KCP’s 1-year performance ranks in the top quartile when compared with mutual funds focused on the BFSI sector. Source: Value Research

As the quarter concluded, pre-earnings updates for Q4 indicated a deceleration in loan growth, consistent with the slowdown in credit growth reported by the RBI for the banking sector. This trend correlates with the broader economic deceleration. While growth appears to be moderating, asset quality is not deteriorating to the extent initially anticipated. Preliminary data from select microfinance lenders suggests that the sector has overcome the most severe challenges, evidenced by improved collection efficiencies and renewed confidence to lend. Similarly, affordable housing financiers are reporting stable asset quality.

As growth becomes scarce, the market tends to reward companies demonstrating consistent growth outperformance.

In an external world which has turned volatile with the outlook cloudy given the tariff-war, we believe financials are well placed as they are 100% domestically focused. Meanwhile, a policy pivot by the regulator focused on cutting interest rates, maintaining adequate liquidity and relatively easier on regulations bodes well for financial services companies.

Little Champs portfolio (LCP) and Rising Giants portfolio (RGP)

For 3QFY25, the Little Champs PMS portfolio recorded allocation weighted earnings growth of 17% YoY. This is in addition to the 22% YoY growth witnessed in 2QFY25 earnings. The key drivers of the double-digit earnings growth in the LCP portfolio in the recent quarters have been:

  1. Most Exports oriented companies in LCP portfolio has recorded double-digit growth in 3QFY25; and
  2. Rural oriented stocks (such as Dodla Dairy, Godrej Agrovet) have done well in terms of earnings growth.
The above factors have also contributed to the Rising Giants PMS portfolio recorded allocation weighted earnings growth of 12% YoY. This is in addition to the 18% YoY growth witnessed in 2QFY25 earnings.

In contrast, there has been a decisive slowdown in the broader corporate earnings with average YoY PAT growth for BSE500 companies moderating to single digits from 1QFY25. Infact the deceleration in the earnings growth has been much sharper for the smaller cap stocks within BSE 500 – with average double digit YoY PAT declines in 251st to 500thranked market cap companies within BSE500.

Given this persistent weakness in the index constituents’ earnings over the last few quarters, we have seen consensus downgrading their estimates for many of the BSE500 companies. Here too, the estimates downgrades have been sharper for the smaller cap stocks (251st – 500thmarket cap) within the BSE 500. We believe the corporate earnings slowdown cycles which seem to have kicked off in the last 2 quarters are likely to last for some time now. In this context, the 30% YoY earnings growth (Source: Bloomberg consensus estimates)for the smaller cap companies for FY26E built in by consensus look clearly at risk amidst the slowdown in domestic consumption and uncertainties around the global trade.
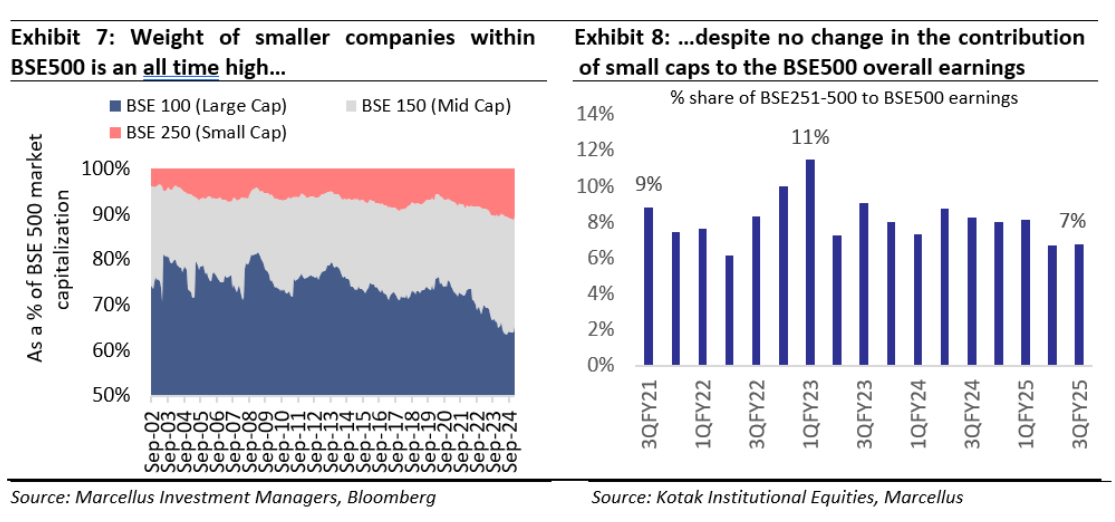
Weight of smaller companies within BSE500 is at an all time high despite no change in contribution of small caps to the BSE500 overall earnings
…On the other hand, LCP and RGP valuations have a come off

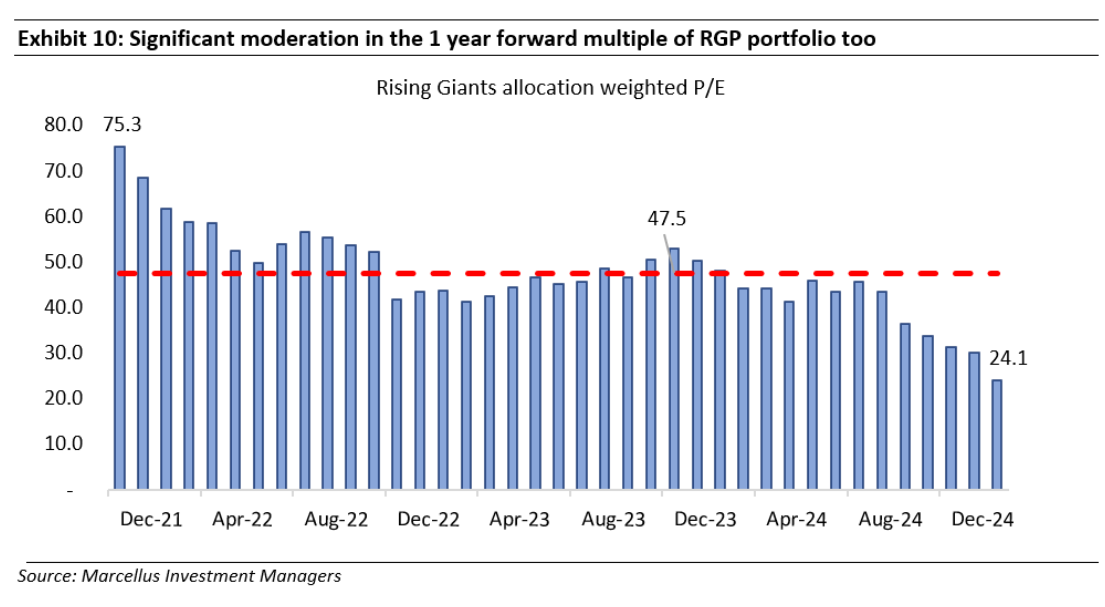
On the positive side, the valuation multiples for both LCP portfolio and RGP portfolios have come down sharply from the highs of the previous periods as visible in the below exhibit.
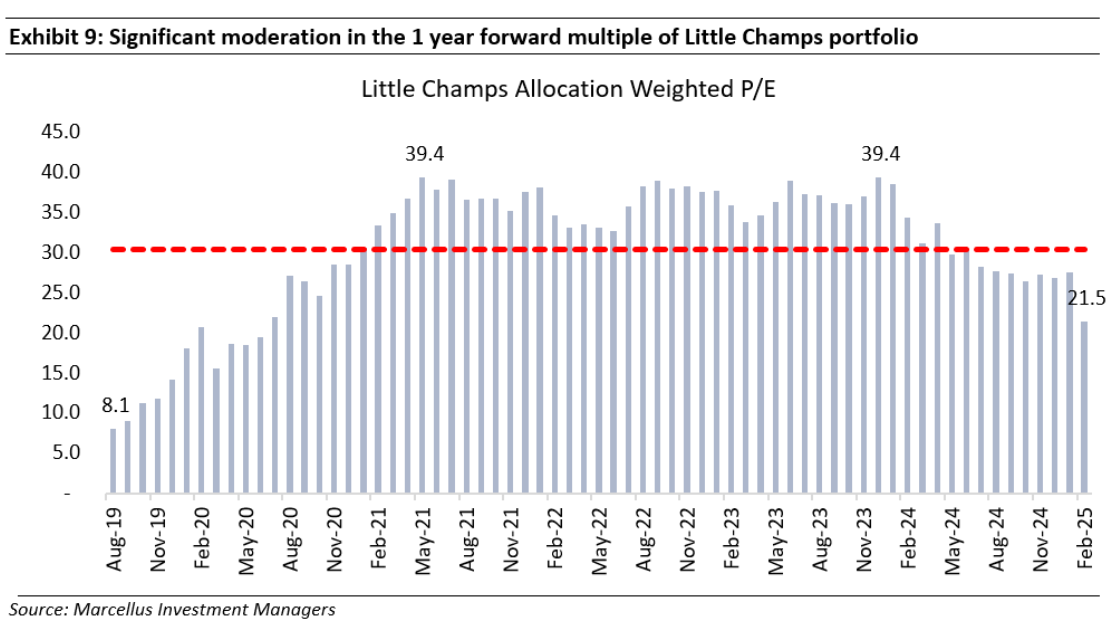
Significant moderation in the 1 year forward multiple of Little Champs Portfolio
Significant moderation in the 1 year forward multiple of RGP Portfolio too
Increasing cash position in the current environment to mitigate the likely drawdowns in the small-mid cap space

Given our concern around the small-mid caps valuation in general together with deceleration in the earnings and further – we do anticipate further correction in the space.

In this context, we have increased the cash positions in both the LCP and RGP strategies. This we have been doing through the year as shown in the below exhibit.
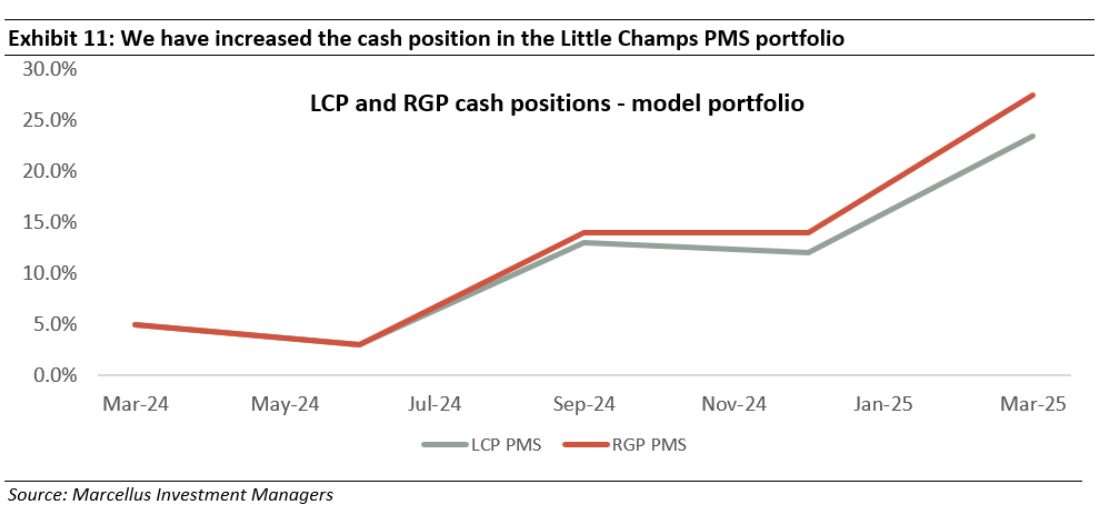
We have increased the cash position in the Little Champs PMS Portfolio
Regards,
Team Marcellus

If you want to read our other published material, please visit https://marcellus.in/insights?filter

Please refer to the following link for our Responsible Investing Policy, our ESG Integration Framework and results of ESG scoring: https://marcellus.in/responsible-investing

Disclaimer:

The above material is neither investment research, nor investment advice. Marcellus Investment Managers Private Limited (“Marcellus”) is regulated by the International Financial Service Centre Authority (Fund Management) Regulations, 2025 (earlier 2022) (“IFSCA”) as Fund Management Entity – Non retail and is also regulated by the Securities and Exchange Board of India (“SEBI”) rendering Portfolio Management Services. Marcellus is also registered with US Securities and Exchange Commission (“US SEC”) as an Investment Advisor. No content of this publication including the performance related information is verified by SEBI, IFSCA or US SEC. If any recipient or reader of this material is based outside India or US, please note that Marcellus may not be regulated in such jurisdiction and this material is not a solicitation to use Marcellus’s services. This communication is confidential and privileged and is directed to and for the use of the addressee only. The recipient, if not the addressee, should not use this material if erroneously received, and access and use of this material in any manner by anyone.

Global Compounders Portfolio (GCP) is a strategy offered by GIFT City branch of Marcellus Investment Managers Private Limited and the other strategies are offered by Marcellus Investment Managers Private Limited.

This material may contain confidential or proprietary information and user shall take prior written consent from Marcellus before any reproduction in any form.

Data/information used in the preparation of this material is dated and may or may not be relevant any time after the issuance of this material. Marcellus takes no responsibility of updating any data/information in this material from time to time. The recipient of this material is solely responsible for any action taken based on this material. The recipient of this material is urged to read the Disclosure Document/Form ADV, Form CRS and any other documents or disclosures provided to them by Marcellus, as applicable, and is advised to consult their own legal and tax consultants/advisors before making any investment in the portfolio.

All recipients of this material must before dealing and or transacting in any of the products referred to in this material must make their own investigation, seek appropriate professional advice and carefully read the Disclosure Document, Form ADV, Form CRS and any other documents or disclosures provided to them by Marcellus, as applicable. Actual results may differ materially from those suggested in this note due to risk or uncertainties associated with our expectations with respect to, but not limited to, exposure to market risks, general economic and political conditions globally, inflation, etc. There is no assurance or guarantee that the objectives of the investment strategy/approach will be achieved.

This material may include “forward looking statements”. All forward-looking statements involve risk and uncertainty. Any forward-looking statements contained in this document speak only as of the date on which they are made. Further, past performance is not indicative of future results. Marcellus and any of its directors, officers, employees and any other persons associated with this shall not be liable for any loss, damage of any nature, including but not limited to direct, indirect, punitive, special, exemplary, consequential, as also any loss of profit in any way arising from the use of this material in any manner whatsoever and shall not be liable for updating the document.

The stocks described about in the presentation do form the part of our Marcellus’ portfolio so we as Marcellus, our clients, our employees and their immediate relatives do have interest and stakes in the described stocks. The described stocks are for illustration purpose only and not recommendatory.

This material may contain confidential or proprietary information and user shall take prior written consent from Marcellus before any reproduction in any form.

Regards, Team Marcellus

If you want to read our other published material, please visit https://marcellus.in/pms-investment-blog/


Copyright © 2026 Marcellus Investment Managers Pvt Ltd, All rights reserved


RELATED NEWSLETTERS

  • Aug 12, 2026

    Marcellus Portfolio Updates & Insights – August 2026

    READ MORE
  • Aug 06, 2026

    Global Compounders: Why have we underperformed the S&P500 in 2026?

    READ MORE
  • Jul 27, 2026

    Isaac Newton and the Madness of Men

    READ MORE

RELATED NEWSLETTERS

  • Aug 12, 2026

    Marcellus Portfolio Updates & Insights – August 2026

    READ MORE READ MORE
  • Aug 06, 2026

    Global Compounders: Why have we underperformed the S&P500 in 2026?

    READ MORE READ MORE
  • Jul 27, 2026

    Isaac Newton and the Madness of Men

    READ MORE READ MORE
PREV ISSUE

MeritorQ: Minimizing Risk by Focusing on Errors of Commission


Published on Apr 14, 2025
NEXT ISSUE

The Kings Stand Tall as the Storm Approaches


Published on Apr 19, 2025

Did`t receive OTP? 00:00 Resend
Be the First to Know

Marcellus logo

At Marcellus, our Purpose is to make wealth creation simple and accessible by being trustworthy and transparent capital allocators.

  • Twitter-Marcellus Investment
  • LinkedIn-Marcellus Investment

Marcellus Investment Managers Private Limited

Please reach out to us at

Board Line : 0806-9199-400

Sales Desk: 0806-9199-401

e-mail: invest@marcellus.in


Marcellus Investment Managers
102, First Floor, Boston House, Suren Road,
Near 'Western Express Highway' Metro Station,
Andheri East, Mumbai 400093

Please reach out to us at

e-mail: help.gift@marcellus.in


Marcellus Investment Managers
IFSC Branch – Unit no. 431 and 432, Signature Building, Fourth Floor, Block 13B, Zone-1, GIFT SEZ, GIFT City, Gandhinagar – 382 355/382 050

  • Home
  • Our Team
  • Invest with us
  • GIFT City Corporate Disclosures
  • Marketing Disclosure
  • Investing Books
  • FAQs
  • Videos
  • Newsletters
  • Corporate Regulatory Disclosure
  • Company Information
  • Terms & Conditions
  • Privacy Policy
  • Responsible Investing
  • Contact Us

2026 © | All rights reserved.

Privacy Policy | Terms and Conditions

Please read the following carefully and select your residency jurisdiction


If accessing this website by giving false declaration, the person shall be solely liable/responsible for any adverse consequences suffered, legally as well as financially, pursuant to use of any information contained in this website

Beware of fraudulent websites and applications!

Marcellus or its employees will never ask you to join WhatsApp groups or social media accounts created by or on behalf of Marcellus. Marcellus does not have any App facilitating trading in securities, nor does Marcellus issue any advertisement for investment in any specific stocks or for any cash transactions.

If you come across any such activity, please report to the appropriate law enforcement authorities, and inform us on compliance@marcellus.in.

Click here for the list of our official social media handles.

Close