The majority of the listed companies in India fail to beat the market cap weighted index. In this newsletter, we discuss why the odds are stacked against an individual investor owning a small set of stocks. Over a longer investment horizon, returns of benchmark indices as well as the net wealth created in stock markets are driven by a small number of outperformers. Identifying these multi-baggers in advance requires substantial investment skill. Hence, we argue that an unskilled individual investor is better off holding a diversified portfolio.
A study published in 2023 on long-term shareholder returns of 64,000 listed global stocks found that “The majority, 55.2% of U.S. stocks and 57.4% of non-U.S. stocks, underperform one-month U.S. Treasury bills in terms of compound returns over the full sample. Focusing on aggregate shareholder outcomes, we find that the top-performing 2.4% of firms account for all of the $US 75.7 trillion in net global stock market wealth creation from 1990 to December 2020”
How risky is it to buy an individual stock?
Market commentary typically focuses on which company’s stock price is going to surge or plummet. As a result, uninitiated investors often end up putting all their money in one stock (usually for whom the market commentary about stock price movement is positive) or in a very narrow set of such stocks.
Our analysis basis empirical data through multiple market cycles suggests that this is an unwise strategy for most investors. We present our analysis based on odds of performance and drawdowns for investing in a single stock (picked from among the largest 500 listed companies in India) and present the key takeaways for investors.
Slightly less than half the stocks underperform 3-month Treasury bills and majority are not able to beat the equity market benchmark
We look at the probability or odds of a single stock: (a) outperforming the market cap weighted benchmark, (b) outperforming 3-month treasury bills, and (c) delivering positive returns. This is shown in exhibit 1.
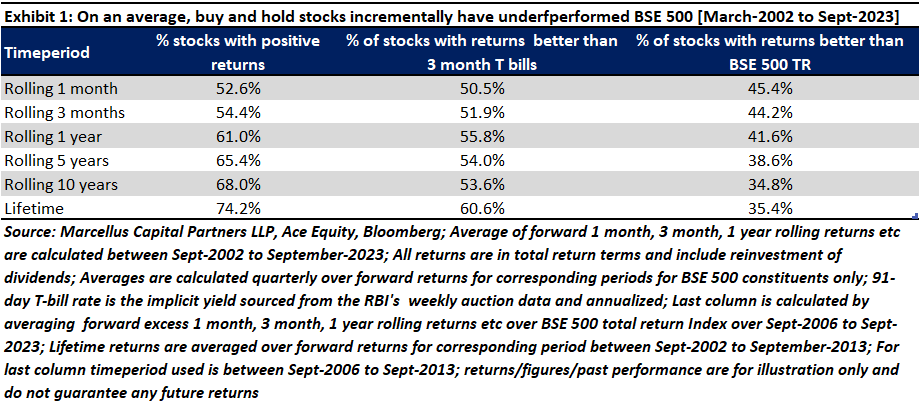
We measure these odds using data and BSE 500 constituents from March-2002 to September 2023. Our analysis is restricted to the BSE 500 as it forms the most readily investible and liquid investment opportunity set for most Indian investors. Furthermore, the odds have been calculated on total returns earned by a buy and hold investor over different periods and no rebalancing is assumed.
Our first takeaway is that the majority of stocks deliver positive returns and beat the 3-month Treasury bills over most of investment horizons considered. Moreover, in both cases, the percentage of such stocks increases with increasing time horizon. This highlights the benefit of longer investment horizon in equities which allows investors to compound returns at a positive rate on an average and at least better than the 3-month Treasury bills.
Our second takeaway is that most stocks underperform the cap weighted BSE 500 index. In other words, the percentage of stocks that outperform the index decreases with increasing investment horizon. This is so because:
- by definition, the benchmark contains all the stocks, so it is exposed to similar equity risk as well as returns for a single stock. Further the benchmark contains both losers as well as outperforming stocks (where outperforming stocks tend to pull the average returns upwards and this effect is more powerful, the longer the time horizon); and,
- since the benchmark is a managed index (in this case the top 500 listed stocks in India), large underperforming stocks will eventually be removed at some point because they will no longer qualify among the top 500. In contrast, the buy and hold investor will continue to hold on to such stocks.
A closer look at the distribution of returns
Since exhibit 1 looks only at average odds, we look at snapshots of two return distributions. Exhibit 2 shows the distribution of excess returns over BSE 500 TR index (benchmark) from September 2006 to September 2023. One can observe immediately that the distribution is very unbalanced. Roughly 65% of BSE 500 companies have underperformed BSE 500 TR over the period. So, whilst on an average, companies can generate ~282% returns over and above what BSE 500 TR returns on a cumulative basis, an average company fails to best this very benchmark index return by itself.
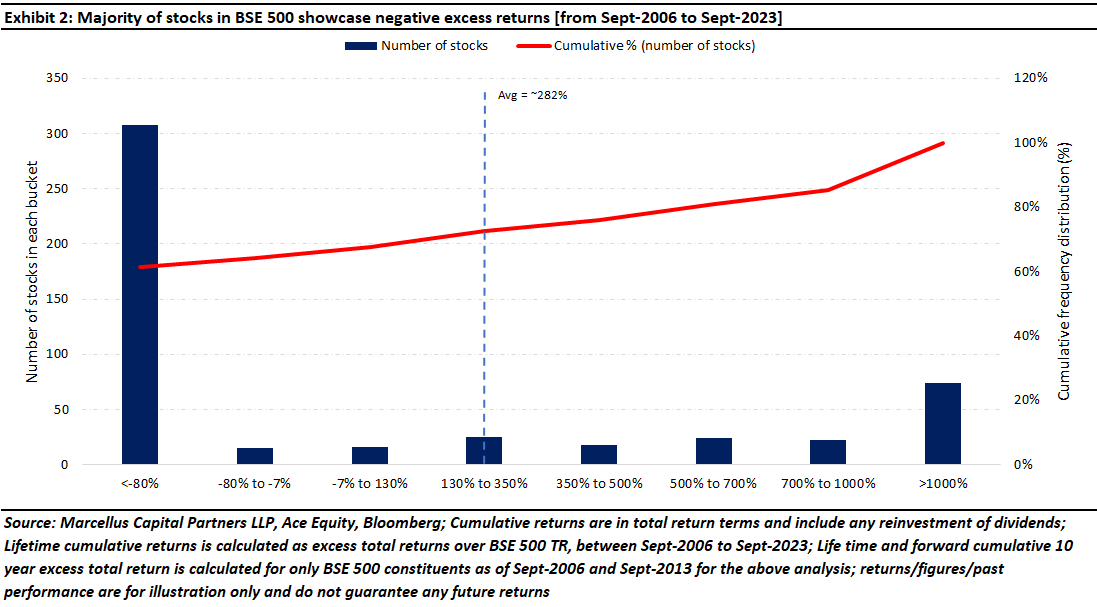
Exhibit 2 also shows that 64.5% and 43.1% of firms underperformed the BSE 500 TR and 3-month Treasury bills respectively during this period. Note that since September 2006, the BSE 500 index and 3-month T bills in India had delivered a cumulative return of ~628% and 190% respectively (translating to a compounded annual growth rate or CAGR of 12.3% and 6.4% respectively). Exhibit 3 highlights the same point but
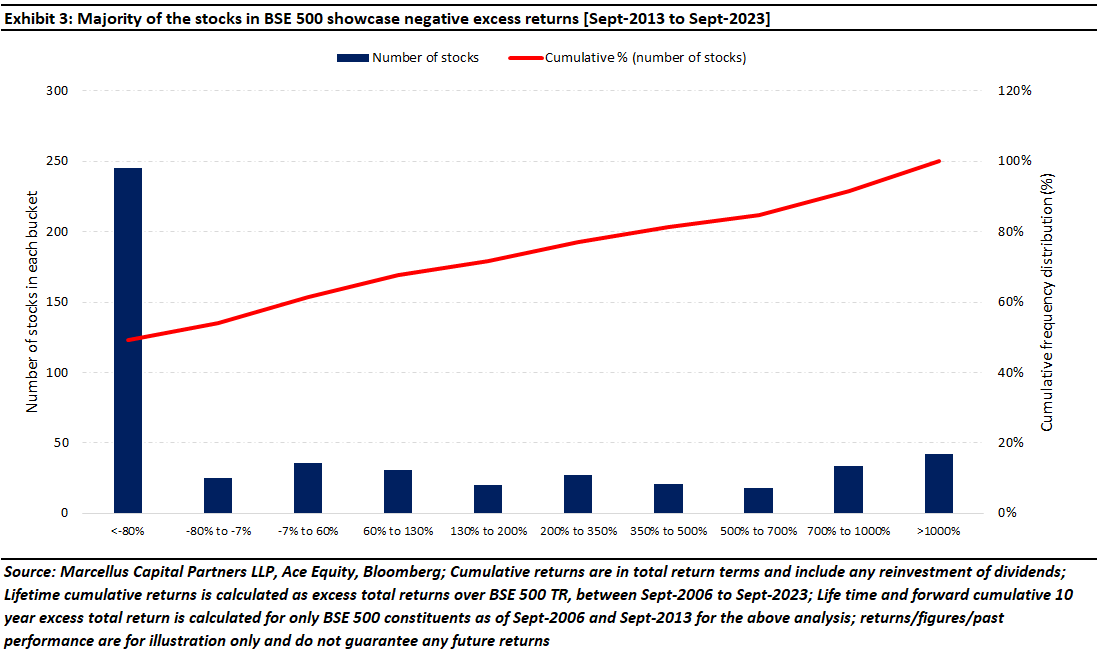
Over this period, roughly 54.8% and 28.5% of firms underperformed the BSE 500 TR and the 3-month Treasury bills respectively (the BSE 500 and 3-month Treasury bills compounded annually at ~16% and ~6.1% over this period).
The fact that the overall stock market (represented by the benchmark) generates healthy long-term returns, while nearly half of the individual stocks fail to even match Treasury bills, can be attributed to the positively skewed distribution of individual stock returns. Simply put, the large positive returns of a few stocks in the BSE 500 offset the modest or negative returns of more typical stocks in the BSE 500.
To help understand the concept of skewness better, let’s look at the 2023 Cricket World Cup match between Bangladesh and South Africa (played on 24th October 2023), which the former lost by a massive 149 runs. Bangladesh scored a total of 233 runs (216 excluding extras). However, if one looks at the players responsible for scoring these runs in their team, an interesting picture emerges. Mahmudullah by himself contributed 111 runs to this total whereas the rest of the team members could barely score in the low double digits. Because all the team players played and were all out in the end, we can divide 216 runs by 11 players, which brings the average runs per player to ~20 runs. However, the median runs scored per player comes to ~11 runs, which clearly shows that it was just a few players (in this case 1) who scored most of the runs. Because the chasm between the highest run scorer and other players was so deep and wide, the highest scorer’s runs pulled the average way ahead of the median figure.
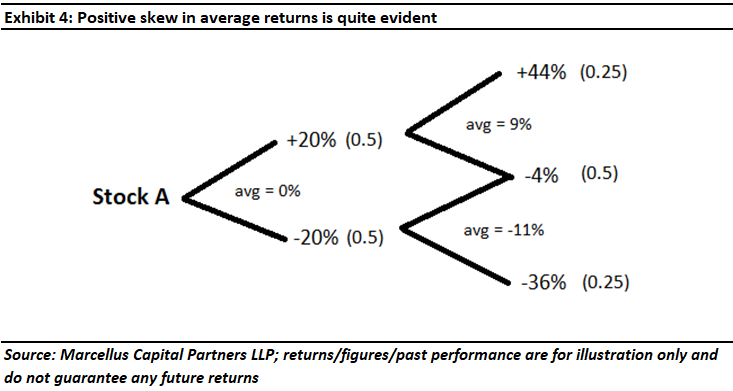
In a similar vein, compounding of returns of individual stocks involves skewness over longer horizons. To illustrate this, consider a stock which has an equal chance of either going up 20% or down 20% in any given month. Assuming that returns in any period are not dependent on returns in other periods, i.e., they are independent, following are the expected returns and their respective probabilities:
- Scenario 1: expected return of 44% with 25% probability of occurrence
- Scenario 2: expected return of -4% with 50% probability of occurrence
- Scenario 3: expected return of -35% with 25% probability of occurrence (see exhibit 4 below to understand how we arrived at these figures)
Now, on an average, an investor can expect an average return of 0% over the 2 months horizon. However, the median return is -4%, which means an on an average, an investor can expect to earn -4% a month. Notice how the average figure is greater than median, making this a classic case of a positively skewed distribution. And this will always be the case so long as the return probabilities don’t change as a few extreme positive outliers tend to pull the averages upwards and that more than offsets the negatives which are many but relatively not as large (or small in this case) to materially move the needle.
Another way to think about this effect is to note that cumulative returns for a stock can never go down below -100% (as share price cannot go below zero) while cumulative returns can potentially be unlimited on the upside.
Therefore, compounding of successive random returns induces skewness in return distribution across stocks which causes the median buy-and-hold return to be less than the average. This effect becomes more pronounced for longer horizons. In effect, if an investor buys a stock randomly (without much research) and simply lets it sit in his portfolio, then the longer the passage of time progresses, the lower are likely to be the investor’s returns. The apt cricketing analogy would be if the BCCI randomly picks a cricketer from the maidans of Mumbai and inserts him into the Indian cricket team, then the longer the passage of time, the more this random cricketer will drag down the performance of the Indian cricket team.
Maximum drawdowns can be jarring for individual buy and hold investors
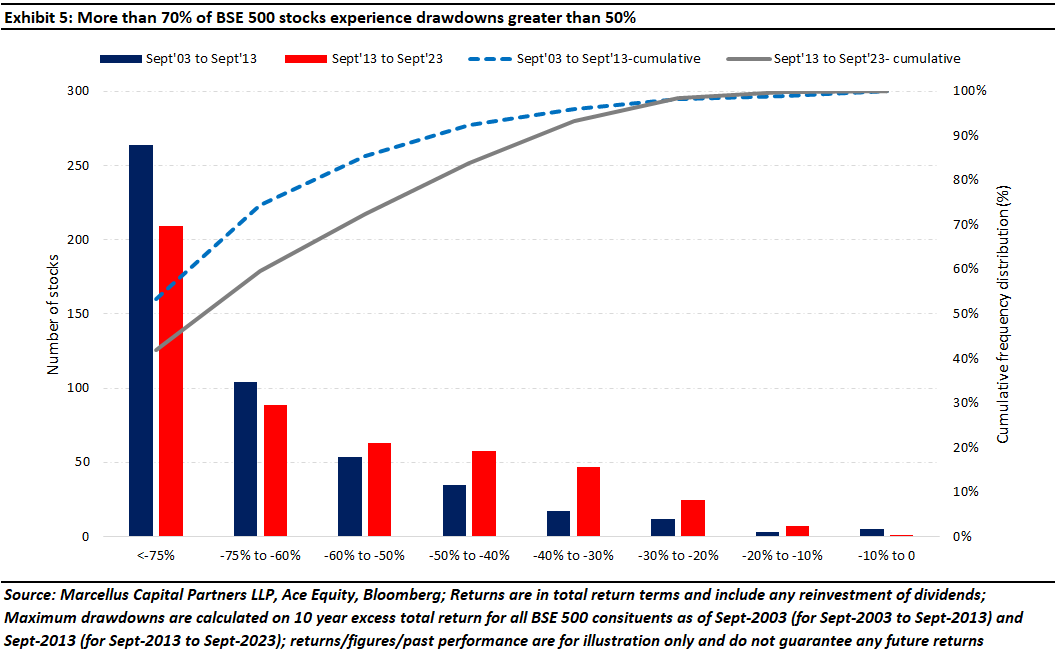
Large drawdowns (i.e., a sharp reduction in the value of the investment) can be painful for any investor. Therefore, in exhibit 5 we look at the odds of experiencing drawdowns of different magnitudes for a single stock. The exhibit shows the number and cumulative percentage of stocks that witnessed maximum drawdowns (which is the maximum % fall in share price from its peak to trough in a time frame) of different magnitudes (on the x-axis). Since maximum drawdowns for most stocks occur at or around major market moving events, we have shown the distribution for two non-overlapping 10-year periods – September 2003 to September 2013 (which would represent the Global Financial Crisis for most stocks); and September 2013 to September-2023 (which would represent Covid crisis related drawdown).
As the exhibit shows, more than 70% of the stocks in BSE 500 experience drawdowns >50% over a 10-year period. Drawdowns of more than 75% in a 10-year period has been the most common occurrence.
Now assume, you hold only one stock during such a drawdown or even, say, 5 randomly chosen stocks. What if all of them fall in this extreme drawdown category? Given the skewed distribution of returns (as discussed before) this is a highly likely scenario. Given the odds implied in the above exhibit, it is highly likely that the investor stands to lose almost entirety of their invested wealth in a Covid or Global Financial Crisis type situation.
Key takeaways
Whilst we have focussed our analysis on the Indian stock market, similar studies can be found for other international stock markets as well. A similar study on the US stock market found that the best-performing 4% of listed companies explain the net gain for the entire US stock market between 1926 to 2016.
We have restricted our analysis to top 500 listed stocks. And whilst we have not done the analysis, it would be fair to say that the odds we have presented will look even worse, if we were to include additional roughly 6,000 listed micro-caps in India.
The analysis presented in the newsletter shows why investing in a single stock or a narrow set of stocks based on stock specific stories/media hype or just looking at recent market returns will most likely result in disappointment. Our analysis reinforces the importance of portfolio diversification for most investors, assuming they don’t have specialized skill to for security selection. Not only does diversification reduce the variance of portfolio returns but it also reduces the chances of missing out on multi-baggers which have the potential to generate large cumulative returns (i.e., the error of omission) while also reducing the possibility of having to live through gut-wrenching drawdowns.
In the context of MeritorQ, the filtering steps – where we screen out companies manipulating their earnings, cyclical businesses, and those with high debt to equity – focus on key company characteristics that help us avoid companies which could subsequently underperform. We then select 30-45 companies that are both profitable and undervalued from this screened list. As discussed in our August 2023 newsletter “Why MeritorQ has 30-45 Stocks”, MeritorQ’s portfolio size along with frequent rebalancing allows investors to benefit from the breadth of investment opportunities available by leveraging a quant-based investment process that is efficient, repeatable, and data driven.
To invest in MeritorQ through Smallcase, please visit MeritorQ Advisory – Marcellus
* The securities quoted are for illustration only and are not recommendatory
Regards
Team Marcellus

