In this newsletter, we quantify the contribution of rebalancing to overall returns by breaking down the portfolio returns into sub-components. We find that periodic rebalancing drives most of the returns of systematic relative value strategies. Selecting quality, undervalued companies, as we do in MeritorQ’s selection step, is effective only when the portfolio is regularly rebalanced.
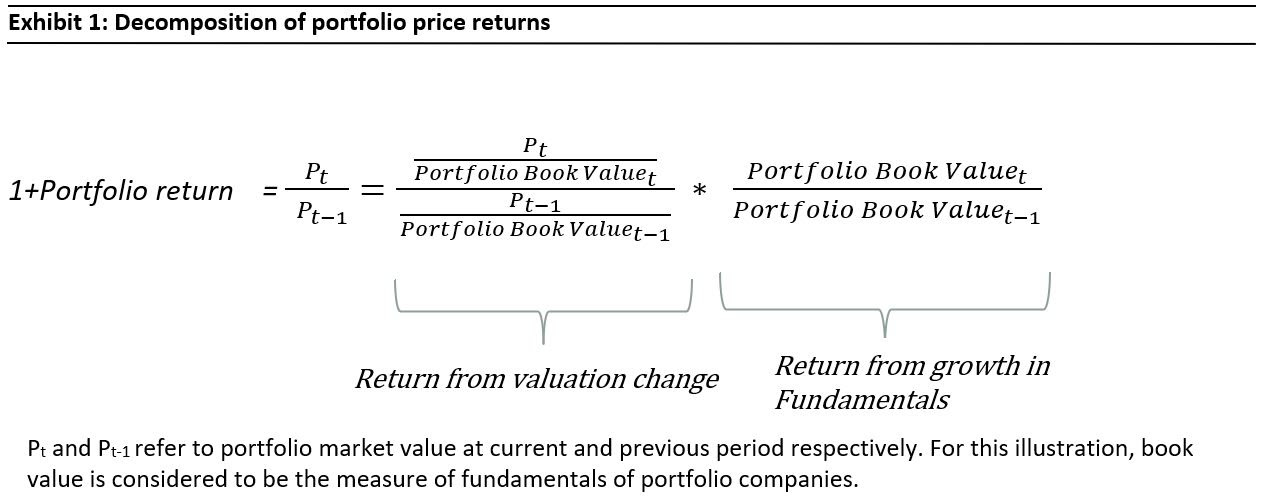
Returns of any portfolio over any time period can be decomposed into three components:
- returns from growth in fundamentals,
- returns from change in valuations, and
- returns from the dividends paid by portfolio companies.
Of these components, component c is relatively smaller and distinct from other components as it depends on the dividend yield of portfolio companies. For our analysis therefore, we focus on portfolio price returns (excluding dividends) and quantify how much of the portfolio price returns are driven by growth in fundamentals and change in valuations. This return breakup is shown visually in exhibit 1.
This return decomposition can be illustrated by taking a hypothetical portfolio which is rebalanced every year. This portfolio is assumed to have a starting price of 1000 and portfolio EPS of 100, with portfolio price and EPS changing over next 3 years, as shown in exhibit 2. For these assumptions, the annualized return of this hypothetical portfolio comes to 17% which is a combination of return from valuation change of 3.6% and annualized return from change in portfolio EPS of 13.6%.
This hypothetical portfolio illustration can be thought of as an example of a systematic quant strategy, where we select stocks, whose prices are lower relative to fundamentals (such as book value, sales, earnings, dividends, etc). To understand why this is a sensible way to build a portfolio, think about a budget constrained team in IPL, which cannot afford expensive players. So at each auction it replaces expensive players in the team with unknown or undervalued players, so that overall team’s salary can be accommodated within the budget. In a similar way, the hypothetical portfolio strategy shown in exhibit 2 has its portfolio PE reset to 10 or 11 at every rebalance.
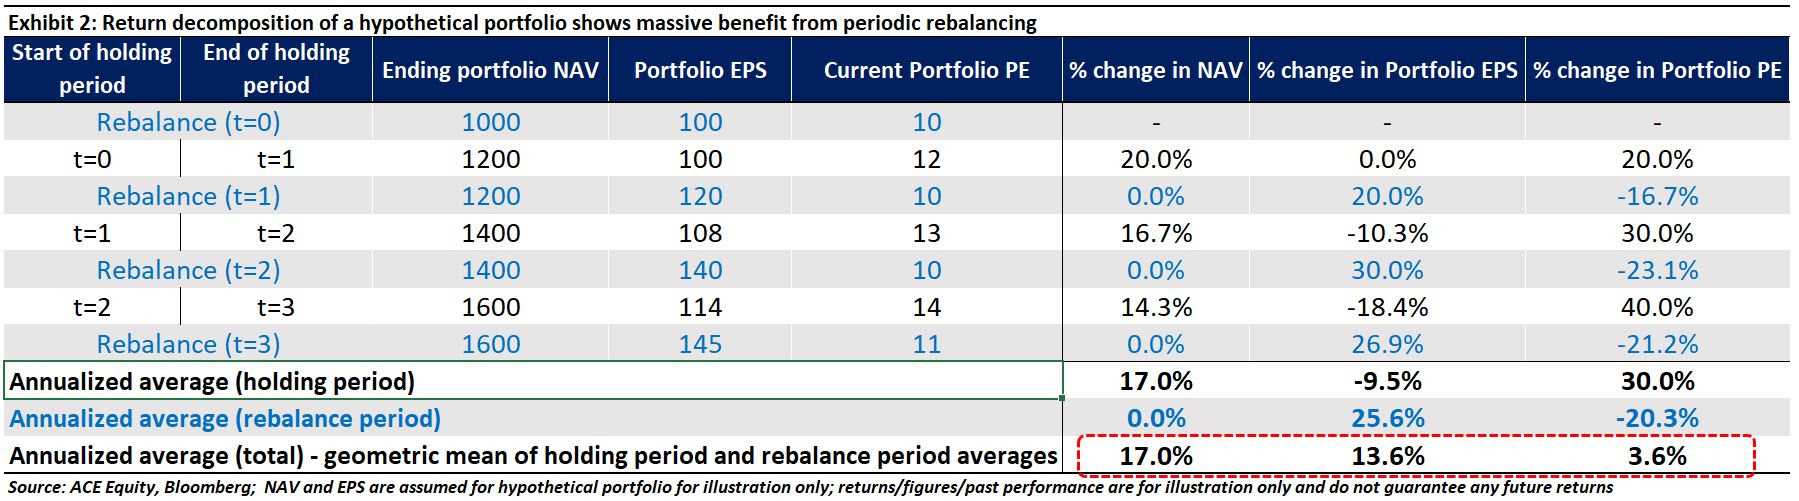
The above exhibit decomposes the return of this hypothetical portfolio into two parts – return from change in the fundamentals of the portfolio, and the change in the valuation of the portfolio (measured in this example by the P/E multiple). The changes in these two parts during the holding period of the portfolio (from t=0 to t=1, t=1 to t=2 and so on) are denoted in black, and at the end of each holding period (or beginning of the next holding period) comes a rebalance activity (denoted in blue) when the portfolio is rejigged to capture the next set of most undervalued stocks, which is denoted in blue. Notice how the portfolio NAV doesn’t move between end of holding period and the rebalance period. However, the EPS of the portfolio increases, due to the reset of the portfolio PE (the PE value to reset at every rebalance is an assumption we are taking for illustration purposes here). So, while the EPS growth of constituent stocks is weak (-9.5%), the overall portfolio EPS growth is healthy at 13.6% because of the kicker from rebalancing driven return of ~25.6%.
A closer look at exhibit 2 tells us that the re-rating of the portfolio’s price to earnings ratio (PE) during the holding periods move closely with the portfolio’s EPS change at the next rebalance [blue coloured rows; this is the growth from rebalancing]. Essentially, the act of rebalancing, where we rebalance to a new portfolio with lower PE, converts this PE re-rating of portfolio companies during holding periods to portfolio EPS growth at rebalance.
The above discussion is centered around a hypothetical quant strategy. To quantify, how much of change in valuations and growth in fundamentals actually contribute to overall return as we go across the relative value spectrum in the Indian market, we create four equal sized buckets (quartiles) based on the price to book (P/B) value ratio every year from the BSE500 (so each bucket contains 125 stocks). Each portfolio is rebalanced annually by ranking basis P/B and equally weighted. We focus on P/B ratios here as book values are usually positive (unlike earnings which can turn negative) avoiding any complications while calculating growth figures. However, this exercise and its findings hold true for quant strategies based on other fundamental metrics (single or combination) as well. The results of this decomposition can be seen in exhibit 3.
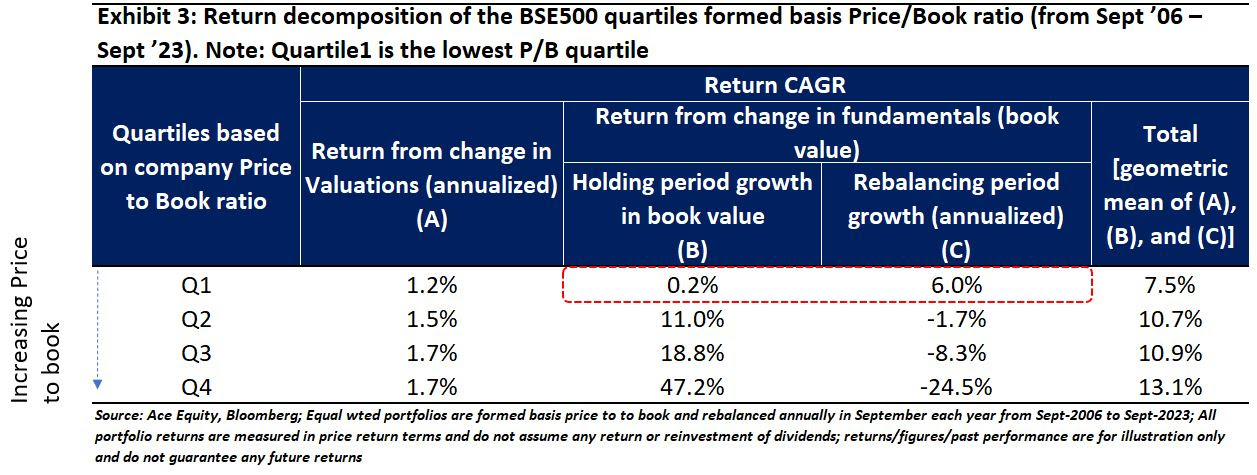
Value strategy works because of re-rating basis future fundamentals of portfolio stocks
In exhibit 3, we can observe that holding period growth in fundamentals (which, in this example, is book value) is once again weak for the most undervalued quartile in terms of price to book, whereas the rebalancing growth is the strongest (see the red dotted box in exhibit 3). What this validates is that undervaluation in the Indian stock market, generally, is not without reason. Undervalued companies tend to be those which are experiencing weakness in their fundamentals. The weakness could be driven, for example, by downturns in the profit cycles or deeper problems in their underlying businesses. The market detects this weakness and reacts by pricing the stocks very cheaply relative to the current book value.
The quant strategy shown in exhibit 3 buys into such stocks at very low prices and holds them for a one-year (remember, quartile1 is the cheapest in terms of P/B). During that period, the fundamentals end up coming in weak, as expected. But the market, which is looking further out into the future, becomes less pessimistic about the stocks and re-rates them higher, lifting their prices and valuations. At the end of the holding period, the value strategy sells out of the stocks at higher prices and valuations and rebalances into a new collection of stocks that have since become cheap. Rebalancing lowers the quant strategy’s valuation, “converting” the gains from the prior multiple expansion into a jump in portfolio book value (or fundamentals) on the rebalancing date. The strategy repeats this process over and over again at the end of each year, with the result that rebalancing becomes a critical driver of portfolio returns. Rebalancing is, therefore, key for any systematic value investing strategy to work.
Conversely, exhibit 3 also shows that as one moves into more “overvalued” quartiles (Q3 or Q4)- stocks at higher valuation multiples generally deliver higher fundamental growth but portfolio fundamentals generally decline at rebalancing as quartile Q4 is looking for stocks whose multiple is even higher than portfolio stocks at the time of rebalancing. Rebalancing therefore is a drag on portfolio returns for the most overvalued quartile. We also observe that returns are generally higher when a company is overvalued compared to its book value (see the final column of exhibit 3).
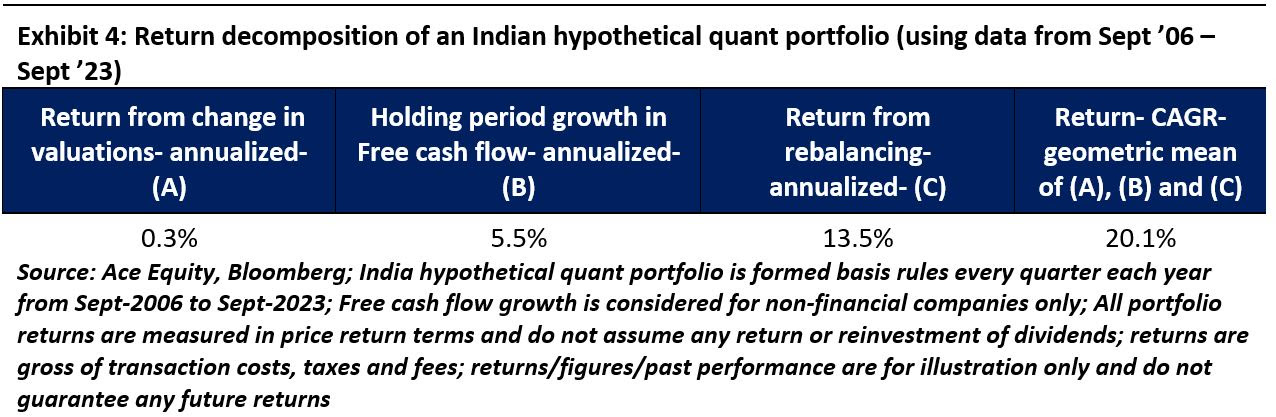
Exhibit 4 shows the decomposition of backtested returns of a hypothetical Indian quant portfolio in which profitable, undervalued companies which clear our forensics, low leverage and consistent profitability screens are selected in a similar manner and rebalanced quarterly. Decomposing returns in the same manner as above, shows that two-thirds of the return are in fact from rebalancing, which as we explained above, is basically the re-rating of price to free cash flow of portfolio companies over successive one-year holding periods. The annualized growth from change in valuations is just 0.3% (portfolio Price/FCF changes from 30.1x in September-2006 to 31.8x in September -2023).
In our July-2023 newsletter Rebalancing is Often misunderstood yet necessary we had discussed how regular rebalancing in MeritorQ allows the strategy to regularly pick up undervalued stocks (based on price to free cash flow) while getting rid of those which have appreciated in price from the last rebalancing (and hence are no longer relatively undervalued). The return decomposition discussed in this newsletter explains why rebalancing is an important driver of returns for any systematic quant strategy such as MeritorQ.
Source: Ace Equity, Bloomberg; Return/figures/Past Performances are for illustration only and do not guarantee any future returns.
* The securities quoted are for illustration only and are not recommendatory
Recently, we released a podcast series called “Guru Mantra with Saurabh” in association with Money9. During the course of the podcasts, Saurabh and Krishnan cover various aspects of investments like different asset classes, basic principles of investing, forensics, etc.
Regards,
Team Marcellus
If you want learn more or read our other published material, please visit https://marcellus.in/meritorq-
To invest in MeritorQ through Smallcase, please visit MeritorQ Advisory – Marcellus
If you would like to know more about MeritorQ, please write to help.ia@marcellus.in

