The operational efficiency of the quantitative approach we take in MeritorQ allows us to analyze and rank stocks over a large investment universe on a consistent set of metrics. Ranking over a large peer group of companies magnifies the power of statistical analysis and hence the reliability of the screening and selection steps. Another benefit of this approach is that any company from the selection universe gets an equal opportunity to be selected into the final portfolio, if it fits the screening and selection criteria, irrespective of its prevailing popularity in the market or the amount of information available about it. Such consistently rational use of data for making investments, helps MeritorQ investors focus on proven patterns & trends which create wealth whilst not succumbing to common human biases.
“Quantitative investing makes good use of the ability of computers to handle vast amounts of data and their freedom from human error. In short, I think computers can do more than the vast majority of investors, and do it better” – Howards Marks in Investing without people
Whilst both the fundamental and quantitative approaches to investing rely on information for making investment decisions, they differ in the way they access and leverage information in terms of their information sources, information processing, and implementation. In particular, we highlight two advantages of the quantitative approach which are:
- The breadth of analysis; and
- Reduced possibility of succumbing to biases.
Breadth of analysis
The ability to analyze a large investment universe in an efficient manner is an important differentiator for quantitative approach when compared to a fundamental research process which might be limited by the size of the analyst team. We emphasize how the large, all-cap selection universe in MeritorQ helps at different steps of the portfolio construction process.
Marcellus’ forensic screening process buckets BSE 500 companies (excluding insurance companies) at each semi-annual rebalance date into 10 equal sized buckets (deciles) based on their ranks. These ranks are calculated on 11 forensic ratios (as explained in ‘Diamonds in the Dust: Consistent Compounding for Extraordinary Wealth Creation’ – see chapters 2 & 3 of the book) which are used to identify and screen out companies with accounting issues. This results in the cleanest and best companies ending up in the top 3 deciles, questionable ones in the next 3, and fraudulent ones in the bottom 4 deciles.
The benefit of this step is tangible – as explained in our previous newsletter, MeritorQ: The Moneyball of Quality Investing, the forensic screening step by itself adds around 5.6% points to the average back-tested returns of the strategy versus an equally weighted portfolio of BSE 500 companies (which is the selection universe).
Comparing forensic rankings across around 500 companies at every rebalance, though a data intensive exercise, helps reduce chances of false negatives (truly fraudulent company misclassified as clean) and false positives (clean company classified as fraudulent).
The algorithms powering Google search are based on a similar concept. As the number of people using the search engine increases, the ability of the search engine to show the most relevant search results (based on the number of links from other websites, click through rate on search keywords among others) improves.
Let’s consider only the large cap universe (approximated by the BSE 100 here) on the one hand and a broad and overall universe (like the BSE 500 which is what we use for MeritorQ) on the other and look at the dispersion of ROCEs for such companies as of September end 2022. Unsurprisingly, the dispersion is substantially wider in the BSE 500 relative to the BSE 100 (see exhibit 1).
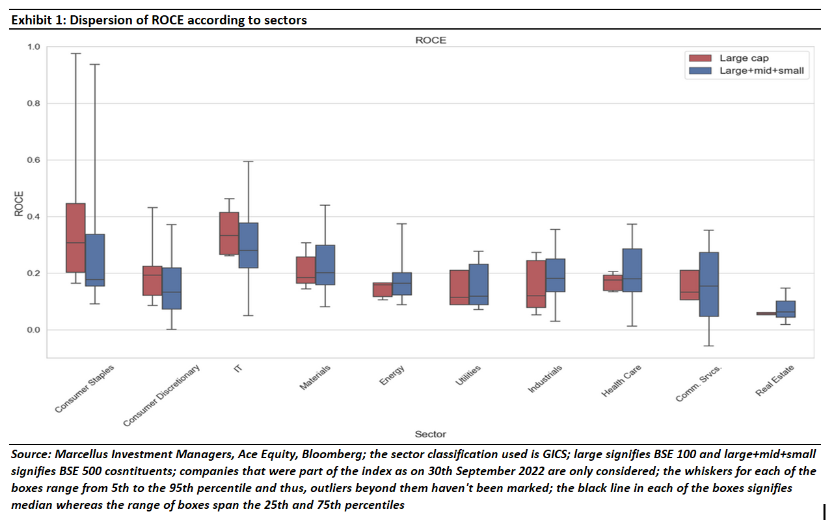
As a result of the wider dispersion in the BSE 500, a ranking system applied to BSE 500 would yield a better stratification of companies rather than ranking based on data that is more closely placed to each other.
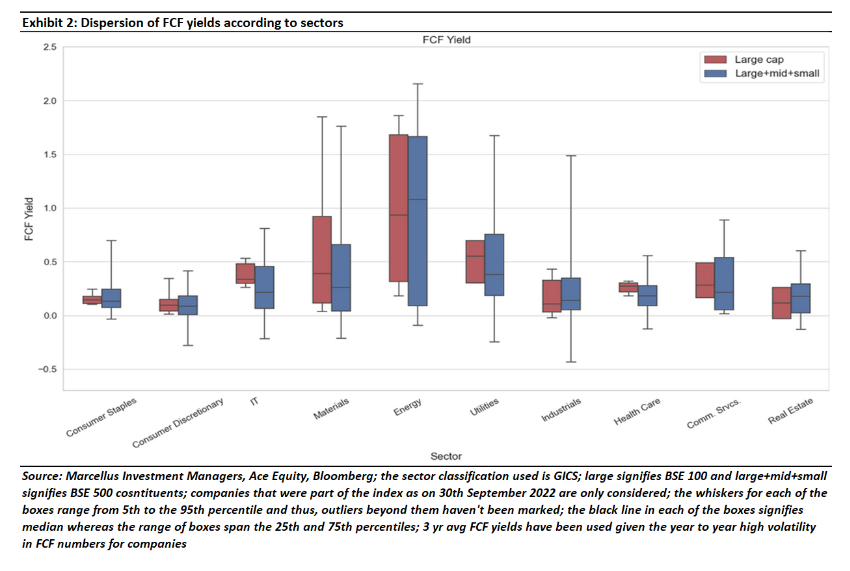
This phenomenon is also evident in the Free Cashflow (FCF) yield – BSE 500 companies have higher dispersion in their FCF yields – see exhibit 2. The greater dispersion in profitability helps when screening (for companies with consistent profitability) as well as during selection while dispersion in FCF yield is useful during selection and position sizing. In other words, a larger universe for MeritorQ gives us more opportunities to select profitable, undervalued companies and the position size them accordingly.
The multi-cap investment universe in MeritorQ also allows to allocate flexibly across large, mid cap, and small cap stocks based on fundamentals and valuations. This is visible in Exhibit 3 where the sell-off in small caps through 2018 and 2019 and early 2020 (marked by the dashed circle) led to widening of FCF yield spread between small caps and large caps. Since FCF yield is one of the selection metrics and is also used for position sizing the final portfolio, this valuation gap reflected in larger portfolio allocation in MeritorQ towards small caps from 2020 onwards.
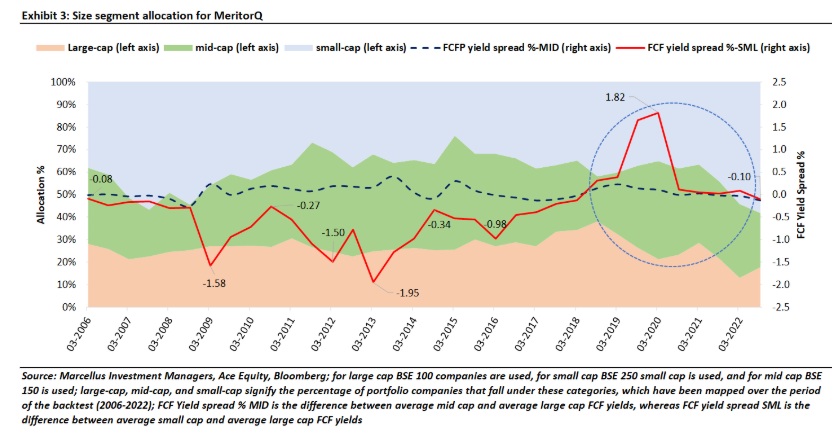
This dynamic reallocation across the market cap spectrum during the semi-annual rebalancing allows MeritorQ to pick up good quality undervalued companies especially among small caps, which make up almost half of all BSE 500 companies and have higher chance of being undervalued (as they are smaller and have less sell-side research coverage relative to large caps). A rules-based and data driven approach in MeritorQ also ensures that such reallocation opportunities can be taken advantage of in a timely and consistent way.
Reduced possibility of succumbing to biases
There are numerous biases that human beings demonstrate when it comes to investing. One of these biases is the human tendency to use information which is more readily available or can be recalled quickly. This, in behavioral finance, is known as the “Availability bias”. In investing, the availability bias manifests (almost daily) in the overreaction to market news. An investor might react negatively to news of a product recall by a company, when in fact, the product recall might not have a large financial impact on the company. On the flipside, a company which is rather tight-lipped but is fundamentally sound might never get the attention it deserves. This bias might have detrimental impact particularly during portfolio selection.
One way to gauge the impact of this bias it to compare the risk-return characteristics of stocks well covered by the sell-side analyst community versus those with low or no analyst coverage. We hypothesize that companies with low analyst coverage suffer from information asymmetry (between insiders and shareholders) and hence should trade at relative discount versus other firms. To test this hypothesis, we look at companies falling in the bottom decile of “excess” analyst coverage at each rebalance date among companies which qualify through the all the screening steps.
“Excess analyst” coverage is the number of analysts covering the company, after adjusting for the company’s market cap and the sector it belongs to. The screened list of companies is considered for this analysis as it controls for analyst coverage variations due to corporate governance, accounting issues, and poor-quality fundamentals, while at the same time is large enough with around 90-100 companies making it through the three filters (forensics, financial leverage, and consistent profitability) at each semi-annual rebalance date.
Results of this analysis back tested from 2006 to 2022 are shown in exhibit 4. Companies in the lowest decile of analyst coverage (adjusted for size and sector) show better risk-adjusted returns when compared to a portfolio of companies in other deciles of the screened universe. Also, the average FCF yield of the bottom decile portfolio is higher than other deciles supporting our hypothesis.
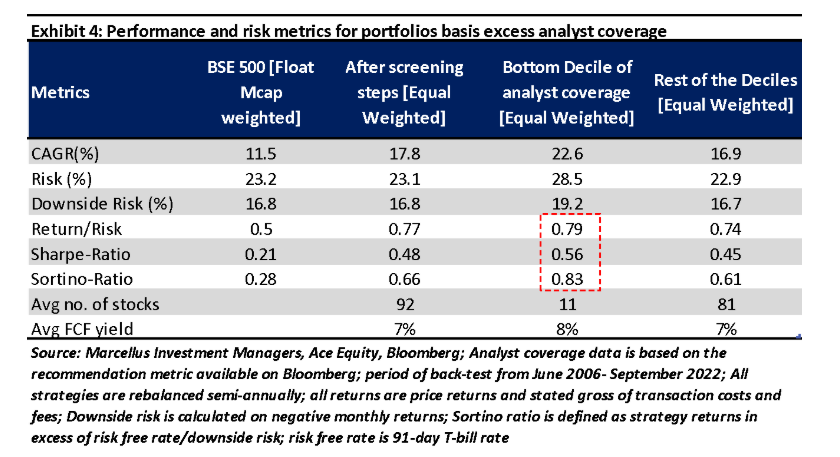
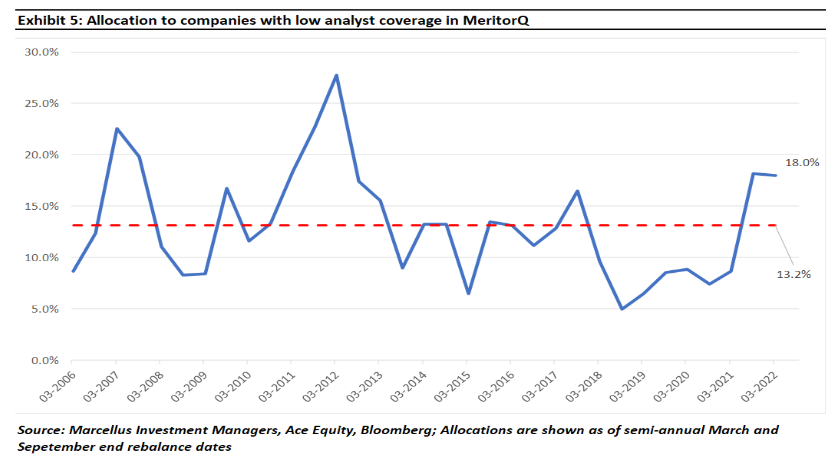
The high risk of the bottom decile analyst coverage portfolio can be partly explained by the relatively smaller portfolio size (on an average it holds 11 stocks across the back-test period) apart from relatively lower liquidity. For this reason, whilst we do not recommend selecting stocks with low analyst coverage as a separate strategy, we highlight the benefits of including such companies in the overall portfolio construct. Exhibit 5 shows that the allocation to companies with low analyst coverage has averaged around 13% for MeritorQ. This highlights the benefits of quantitative rules-based value strategy, which considers lesser-known companies and is not swayed by information availability (or lack thereof) or popular opinions. Whilst we have considered analyst coverage as one barometer of information availability, there are other indicators like media coverage, sentiment indicators, retail ownership among others, which can be potentially used to prove the same point.
Underperformance of large Initial public offerings which typically receive considerable attention at the time of their listing can also be attributed to the reason discussed above (Source: Livemint). In MeritorQ, companies whose listing date falls within 1 year of the rebalance date are not considered.
Until now, we have highlighted the benefits of quantitative investing approach. It is important to note that some key disadvantages to this approach as well and investors should be cautious of:
1) Quantitative modelling that is overly dependent on past relationships, and
2) Excessive rigidity in rules as market regimes shift. For example, sector leadership usually changes when markets correct. The 1998-2000 bull market was largely driven by tech stocks which changed to infrastructure companies during 2003-2008 and then to consumers and financials post 2008.
We believe that regular rebalancing in MeritorQ partially addresses the risk associated with point 1; we refresh the portfolio based on the stated rules once every six months.
For point 2, as we have already highlighted, the rules in MeritorQ will evolve based on our research and we will continue to enhance the rules if we find better approaches or if the existing rules are not giving us the expected outcome. However, any revisions to existing rules will be objectively and thoroughly validated whilst ensuring adherence to investment objectives.
Since launch on 25th October,2022 MeritorQ has generated 3.74% return whilst the NIFTY 500 Total Return Index has returned 5.30% as of November 30th, 2022. The returns for MeritorQ are stated in terms of price returns and calculated net of advisory fees, gross of taxes, brokerage charges or any other transactional cost.
To invest in MeritorQ, please go to https://marcellus.wealthdesk.in/wealthbaskets
If you would like to know more about MeritorQ, please write to help.ia@marcellus.in.

