
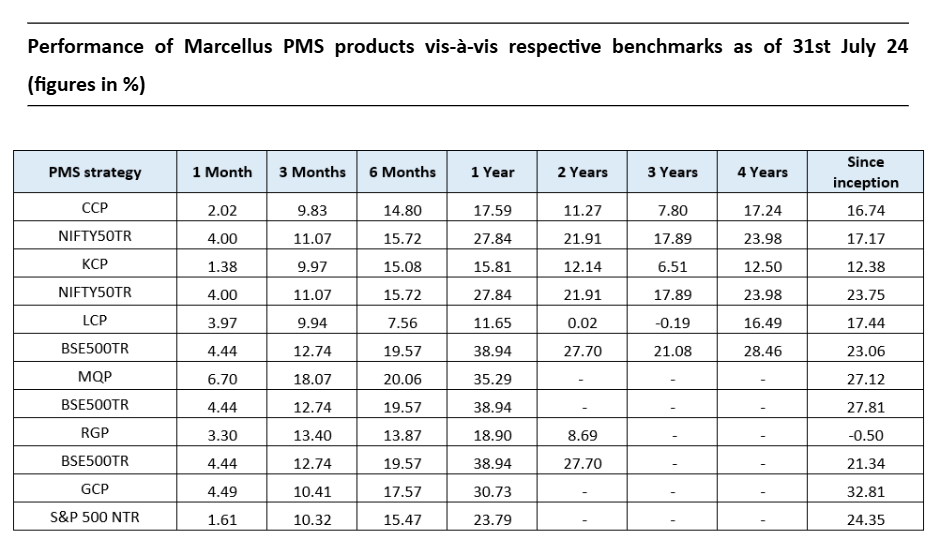
Note: For all strategies except GCP, performance data is net of annual performance fees charged for client accounts whose account anniversary date falls up to the last date of this performance period. Since fixed fees and expenses are charged on a quarterly basis, effect of the same has been incorporated up to 30th June, 2024.
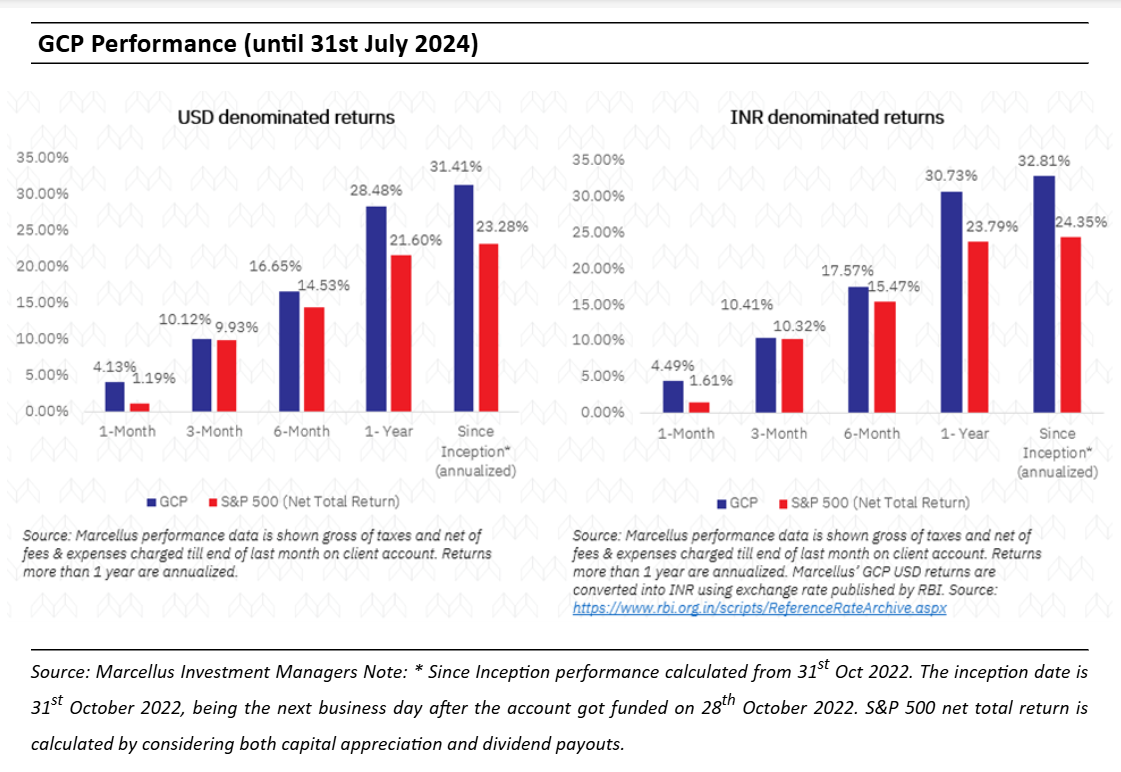
For GCP, performance data is shown gross of taxes and net of fees & expenses charged till end of last month on client account. Returns more than 1 year are annualized.
*For relative performance of particular Investment Approach to other Portfolio Managers within the selected strategy, please refer https://www.apmiindia.org/apmi/WSIAConsolidateReport.htm?action=showReportMenu Under PMS Provider Name please select Marcellus Investment Managers Private Limited and select your Investment Approach Name for viewing the stated disclosure
Consistent Compounders Portfolio (CCP)
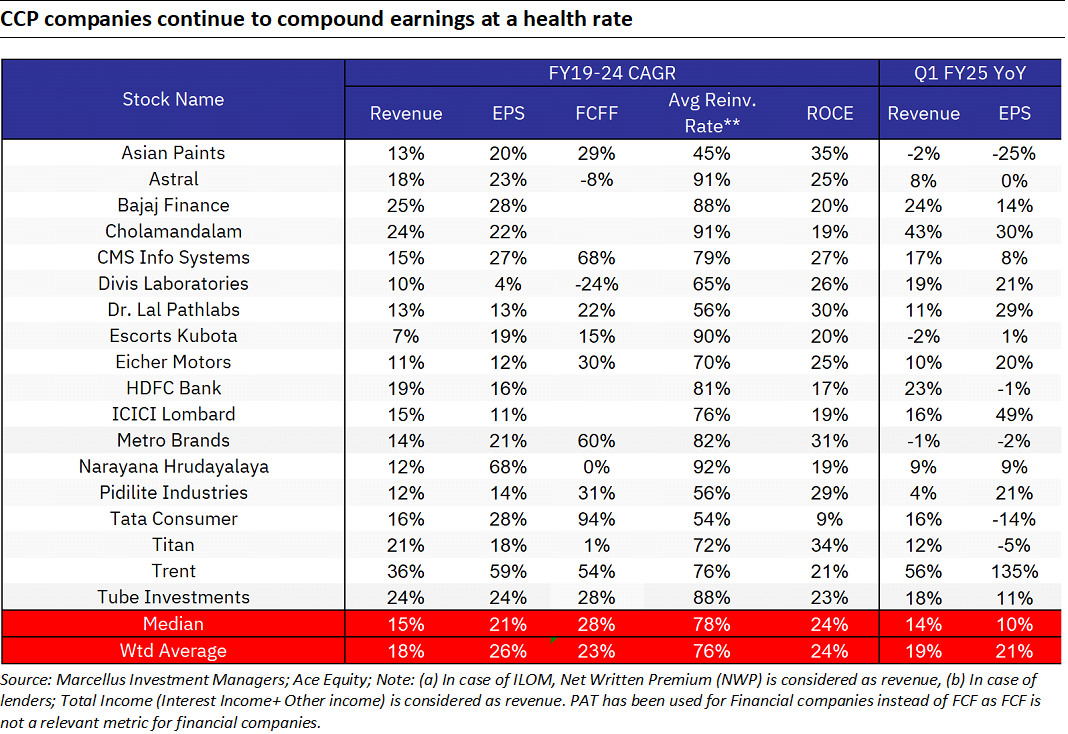
In Q1 FY25, Marcellus’ CCP Portfolio companies delivered revenue growth of 19% and profit growth of 26% on a weighted basis (see table below). This performance was on top of FY19-24 five year revenue and profit CAGR of 18% and 26% for the portfolio respectively. Whilst these Q1 growth rates are healthy, the include the adverse impact of an intense heat wave across the country (affected most B2C businesses) and impact of general elections on labour availability (affected home building materials and new store expansion for retailers). We expect some pent-up demand from these factors for some of the companies in the coming quarters.
Strong market share gains were reported by companies such as Trent, Pidilite, ICICI Lombard, Dr. Lal Pathlabs and Cholamandalam Inv. & Fin. (CIFC). In the coming quarters, we expect the strong momentum in fundamentals to continue and upgrades to consensus expectations for several of our portfolio companies such as Trent, Asian Paints, Dr. Lal Pathlabs, Narayana, Eicher and CMS Infosystems.
As highlighted in our recent newsletter, over the past 12 months, the allocation of Marcellus’ CCP to ‘enterprising compounders’ (as defined in the table below) has been increased to well above 50% (e.g. Trent, Tube), thereby leading to a change in the weighted average ROCE and reinvestment rate of the CCP portfolio from 35%-40% ROCE and 50%-55% reinvestment rate previously, to 25-30% ROCE and 80% reinvestment rate now.
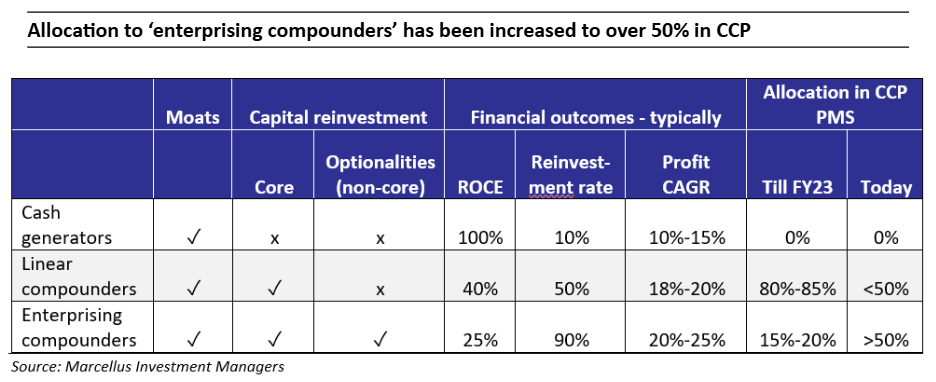
Why have we increased allocation of ‘Enterprising Compounders’? As highlighted in our blogs over the past year, the nature of the Indian economy has changed post-Covid. A combination of superior physical and digital infrastructure, the benefits of economic integration in the wake of GST and a structural drop of the cost of capital (as 100mn+ Indian families shifted their savings from physical to financial assets) resulted in two different effects kicking-in: (a) smaller companies started pushing aggressively into the territory hitherto dominated by larger players eg. Astral Poly entering the paints industry; and (b) well-managed large companies realised that it is time to spread their wings and enter new industries eg. Tube entering the EV space, Trent entering the value apparel space. Exhibit 1 from our 25th June blog (“Creative Destruction on an Epic Scale in India Inc”) explains these two effects in more detail.
As we saw these changes take place in the Indian economy, we realised that by increasing allocation to ‘Enterprising Compounders’, CCP could benefit from the shape-shifting of the Indian economy.
Global Compounders Portfolio (GCP)
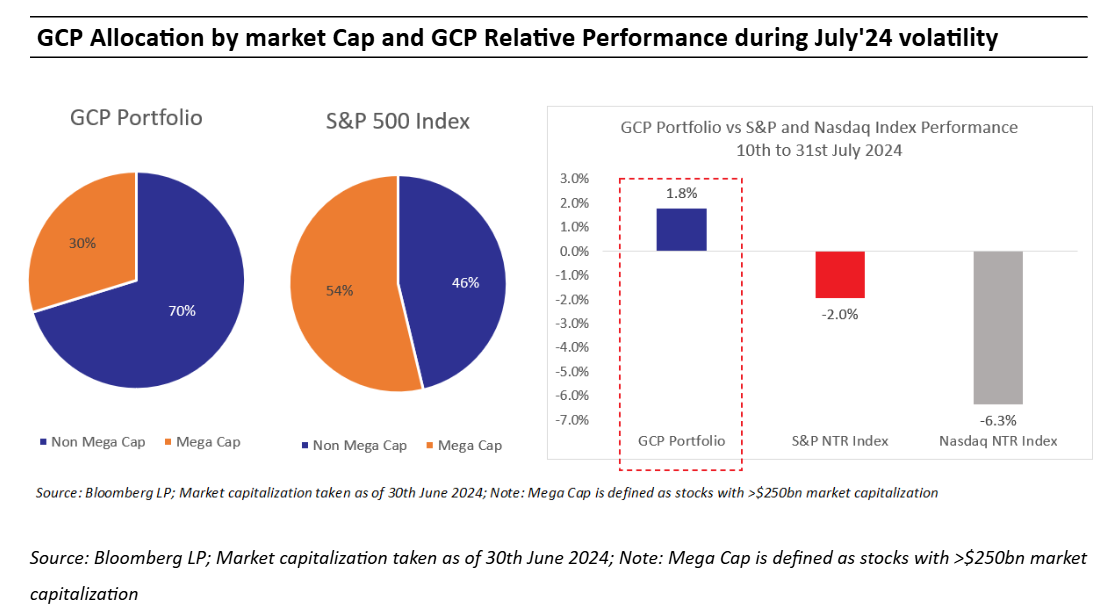
July proved to be a good month for the Global Compounders Portfolio (GCP), outperforming the S&P 500 by approximately 300 basis points. However, the events of July and early August were particularly intriguing. The turbulence began with a “momentum reversal” in mid-July, where Megacap (most popular large cap) stocks pulled back while laggards surged, resulting in the Russell 2000 (Small Cap) outperforming the S&P 500 by around 12% over just 12 trading days—a rare occurrence in the last 25 years. This was followed by weaker-than-expected U.S. job data, which further dampened market sentiment. At the same time, weak demand from China led to a decline in oil prices, despite escalating geopolitical tensions in the Middle East. While the Federal Reserve’s hint at a potential rate cut in September provided some relief, the Bank of Japan’s unexpected rate hike disrupted the “yen carry trade.”
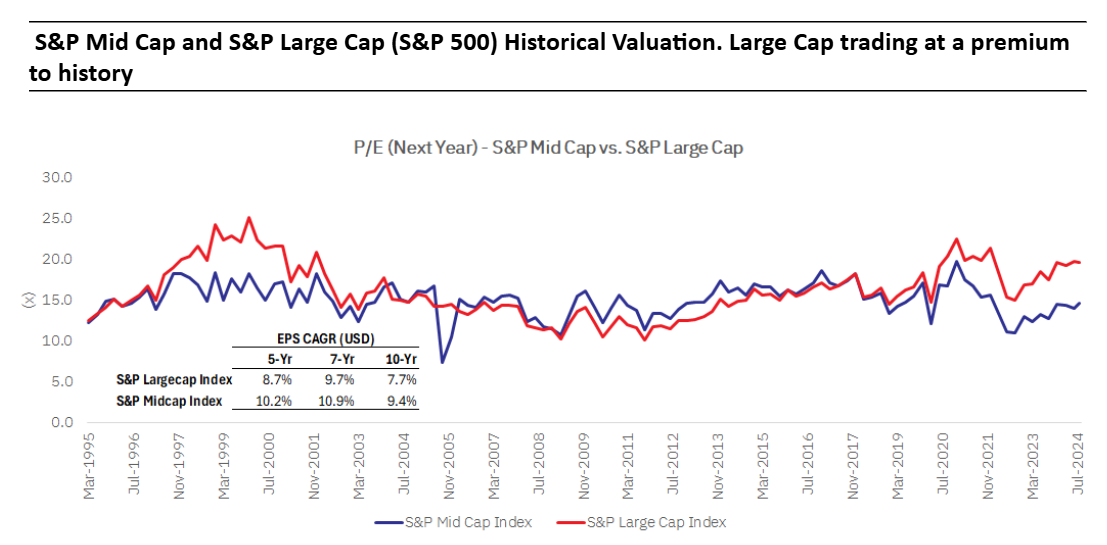
The drawdowns linked to weak U.S. job data and the unwinding of the yen carry trade have largely reversed, thanks to better-than-expected inflation data. However, the most notable development was likely the momentum reversal that occurred between July 10th and July 31st. This period highlighted the “risk” of an extremely narrow market breadth and its impact on indexes with only 20% of S&P 500 stocks outperforming the index on a yearly return basis. The valuation premium of the S&P 500 (Large Cap Index) compared to its historical average, alongside other market segments trading at discounts, supports a strong case for a potential convergence in valuations between different segments of the market.
GCP portfolio, with its limited exposure to Megacaps, is more heavily weighted toward “non-megacap” stocks. While the S&P 500 has around 55-60% allocated to Megacaps (market cap > $250 billion), our allocation is below 30%. This positioning has helped insulate the portfolio from the recent drawdown and volatility. The high valuations of Megacaps, driven by their near-term growth and earnings certainty, pose a challenge in predicting when this trend might reverse. However, the probability of a shift is increasing.
(GCP) is well-positioned to capitalize on a similar outcome. The GCP portfolio’s allocation to Megacaps (Market Cap > $250B) is significantly lower than the benchmark S&P 500. This strategic allocation beyond Megacaps paid off during the July volatility, as GCP outperformed the benchmark by 380 basis points.
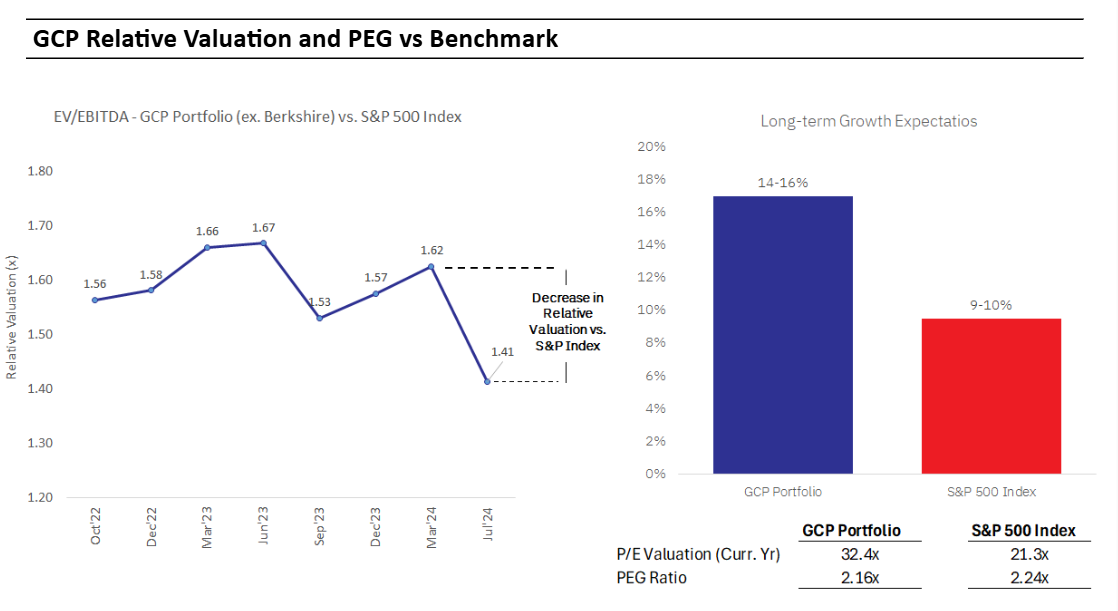
In summary, it’s encouraging to see that GCP has consistently delivered strong returns since its inception, even in a narrow market and without heavy reliance on the so-called “heavyweights.” The portfolio’s resilience during the volatility of July 2024 is a testament to its robust strategy. Although we may face continued market turbulence in the coming months due to various upcoming events, we remain committed to our approach, recognizing that significant opportunities are emerging in this highly polarized market. At the portfolio level, we have been strategically reducing the relative valuation while maintaining growth rates, positioning GCP favourably with respect to the portfolio PEG ratio.
As we look ahead, we remain confident in our strategy and focused on navigating the challenges and opportunities that lie ahead.
Kings of Capital Portfolio (KCP)
Over the past 6, 12 and 18 months, the portfolio has outperformed the Bank Nifty Index as the euphoria and investor interest in public sector banks has gradually subsided over the past quarter. Also, our exposure to capital markets and insurance sector has significantly outperformed the lending sector.
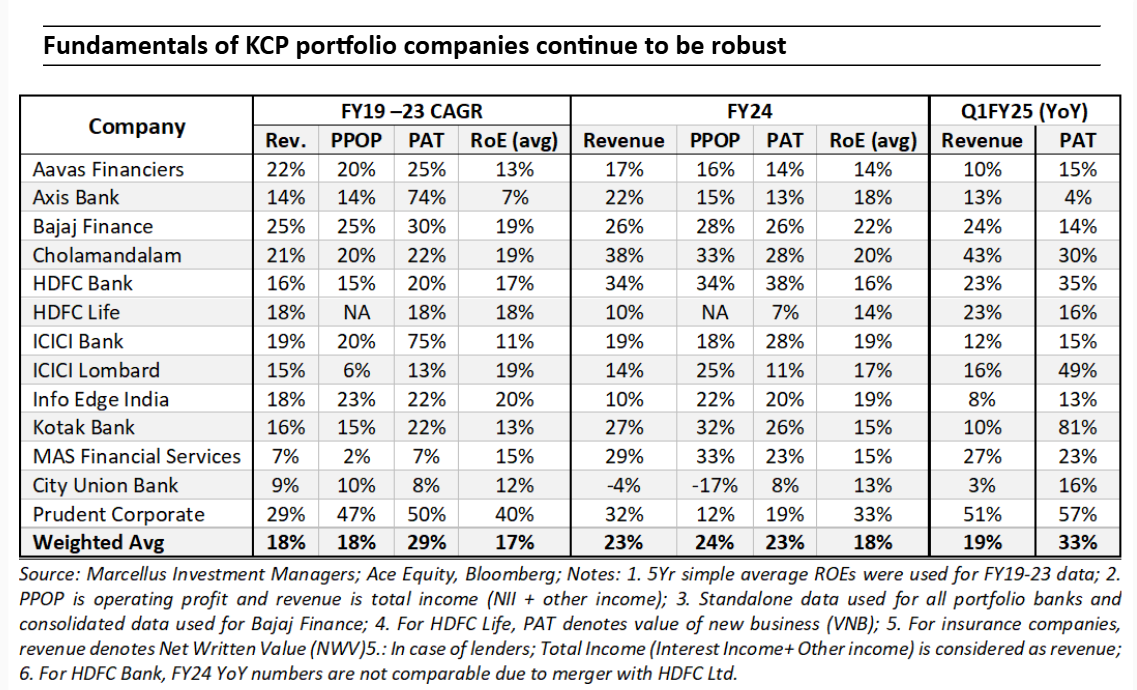
We discuss the positives and negatives of the Q1FY25 result season as all KCP portfolio companies have reported numbers. The quarter was characterised by continued sluggishness in deposit growth for the large banks and some early signs of NPAs normalising to higher levels after a long period of recoveries and benign credit costs. Other parts of the portfolio – life insurance, general insurance and capital markets did pretty well as competitive intensity in the general insurance sector is receding and buoyant capital markets have resulted in supernormal operational performance for Prudent Corporate. However, we remain watchful of elevated valuations for these businesses. We are therefore maintaining a balance between our allocation to banks which are trading at reasonable valuations but have a not so exciting near term outlook vs our allocation to capital markets, NBFCs and insurers which have more pricier valuations but good near term visibility of earnings.
Positives from the Q1FY25 result season:
- Prudent Corporate saw strong AUM growth of 52% leading to PAT growth of 57%. Strong retail flows and buoyant capital markets resulted in Prudent crossing the Rs. 1 lakh crore AUM mark significantly ahead of expectations.
- ICICI Lombard reported a 49% YoY growth in PAT along with 19% return on equity as competition in the motor insurance industry has been receding. ICICI Lombard’s improvement in combined ratios at a time when many other players in the industry have been forced to slow down growth due to higher loss ratios is quite similar to previous cycles. We believe ICICI Lombard will soon return to its 20% return on equity trajectory as it benefits from lower competitive intensity in the sector.
- Chola reported a strong 35% AUM growth and 17% disbursement growth along with flattish NIMs and guidance of improvement from here on unlike most other NBFCs which are struggling to maintain margins in a rising cost of funds environment.
- Bajaj Finance reported an all time high 4.5 million customers acquired in a quarter resulting in 31% YoY AUM growth. During the quarter, the RBI also lifted the ban on its two products with immediate effect.
Q1FY25 misses and monitorables:
- The banking sector continued to see sluggishness in deposit growth, the lack of industry CASA growth in specific has hampered margins and loan growth of the large private banks in our portfolio.
- Axis Bank, Bajaj Finance and Chola reported a slight uptick in NPAs. This is after a two year period when slippages and NPAs were significantly below long term averages. As we have been highlighting in our previous monthly updates and webinars, we believe FY25 is going to be a year of normalisation on credit costs.
- Aavas reported lower than expected disbursement growth in the first quarter (13%YoY) as certain regulatory changes by the RBI hampered disbursement growth during the quarter. This was however partially offset by better than expected operating leverage. Aavas has also recently seen a change in promoter shareholding as Kedaara and Partners Group sold their ~26% stake to CVC Partners, we continue to be watchful of what this entails in terms of management and board level changes.
We believe the portfolio is well positioned to deliver healthy earnings growth albeit at a pace lower than what we saw during FY23 and FY24 as credit costs for lenders normalise and banking sector loan growth reverts to 12-13%. On the other hand, capital markets and general insurance continue to do well which is why we have increased our allocation to these two segments.
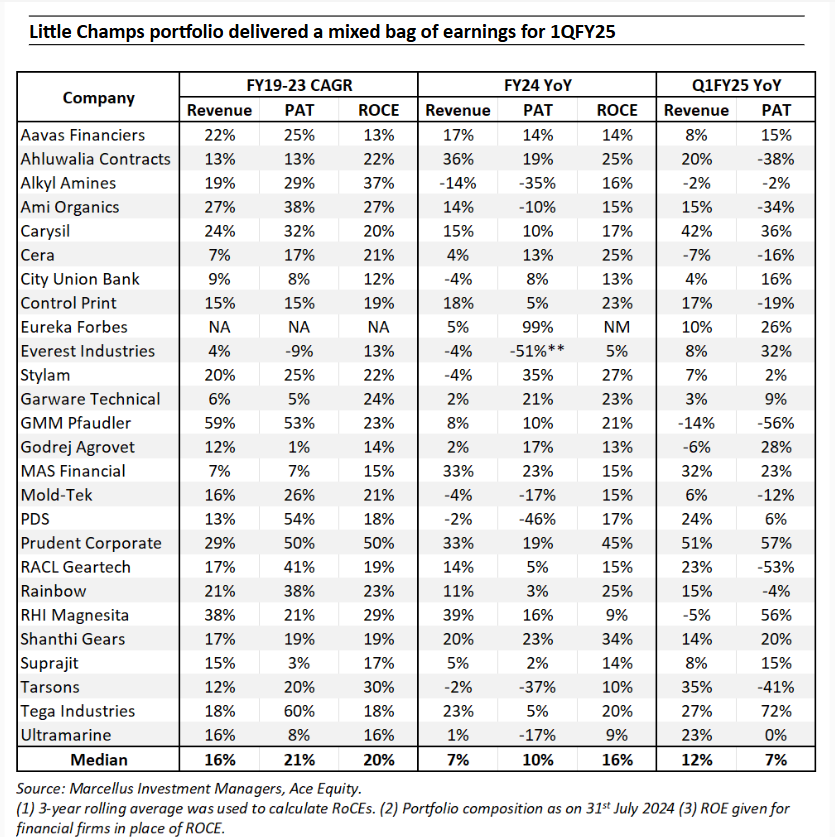
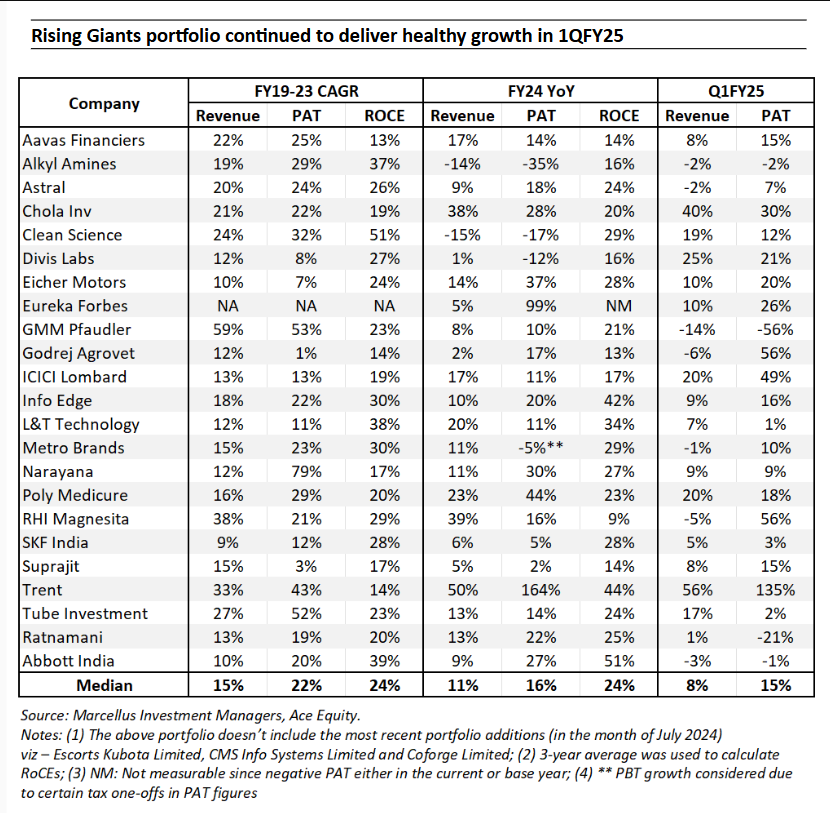
Little Champs portfolio (LCP) and Rising Giants portfolio (RGP)
The Little Champs portfolio stocks delivered a mixed set of earnings for 1QFY25 (median portfolio earnings growth of 7% YoY). While many of the portfolio stocks witnessed a recovery in the earnings in 1QFY25 helped by green shoots of recovery in the export markets, the following issues impacted the earnings growth for some of the portfolio stocks:
- Significant rise in the freight costs and container availability issues which impacted the revenues as well as the margins of the many export-oriented companies.
- Impact of general elections on labour availability particularly impacting the companies in the home building and construction space.
We expect some pent-up demand from these factors for some of the companies in the coming quarters.
The Rising Giants portfolio companies fared much better with median portfolio earnings up 15% YoY for 1QFY25 (excluding for the most recent portfolio additions mentioned below), though the issues highlighted above for the Little Champs companies also impacted Rising Giants companies to some extent.
As we head into FY25, we expect both Little Champs’ and Rising Giants’ portfolio earnings to benefit from:
- A favourable base of FY24;
- A bottoming out of destocking cycle which impacted the earnings particularly for the export oriented companies in the recent quarters;
- Portfolio changes through additions of stocks where the earnings outlook appear sanguine and getting out of the stocks where the earnings outlooks is not encouraging.
We continue to make suitable changes in the portfolio to create more diversity and bring the healthy earnings growth trajectory back in the portfolios.
Changes to the Rising Giants PMS portfolio (as of July 31, 2024)
CMS is a business services company with leadership in cash management market, a growing presence in ATM managed services market, and now expanding into tech solutions (remote monitoring and software). On back of its scale and a strong balance sheet (net cash company with healthy return ratios), it is well placed to benefit from healthy ATM rollouts (capex heavy), increased outsourcing activity of support functions by banks and tightening regulatory compliance. Stronger growth in RMS segment and diversification into bullion-logistics and loan collections will drive revenue growth & diversification of revenues. The biggest risk is acceleration in replacement of cash by digital payment modes and hence material reduction in cash in circulation.
Coforge is one of the largest Tier-2 IT services company with revenues of $1.1Bn in FY24. It provides services in application development, maintenance, cloud, and infrastructure management. Key verticals include Banking & Financial Services (BFS), Insurance, and Travel & Transportation, with BFSI accounting for 55% of revenue. Geographically, 48% of revenue comes from the US, while 39% is from EMEA.
The key strengths of Coforge include:
a. Strong large deals sales culture brought upon by the new CEO. As a result, both the average deal TCV and the number of large deals won increased. Coforge now boasts a meritocratic culture with incentives aligned to achieve desired large deal outcomes.
b. Stable delivery organization: Coforge now offers 16 service lines and close to being an end-to-end service provider. To foster a performance-based culture, increment range for the delivery organization were tripled. Resultantly, Coforge had an industry-leading average attrition rate of just 13% between FY18 and FY24.
The company has grown PAT at 21%/15% CAGR over the last 3/5 years (incl. inorganic growth).
With Kubota now controlling majority of the stake, we believe Escorts is at a cusp of gaining market share in the tractor industry because of the following reasons:A. From FY20 to FY23, Escorts underwent a massive attrition (due to variety of reasons) and now the leadership team has stabilised.
B. After improving product quality, Kubota’s next target is to launch relevant products for the Indian market which helps to gain market share
C. Escorts is forming its own captive financing arm which is expected to be a market share booster.
Apart from the domestic market, Kubota intends to make India an export hub and export tractors to Africa, US and Europe markets. Driven by market share gains and consequent operating leverage driven margin improvement, we expect the company to deliver healthy earnings growth over the next 5 years.
Exit from Tata Elxsi largely due to better IRR expectations from the new entrant discussed above.
Source: Annual filing of respective companies
Regards,
Team Marcellus
If you want to read our other published material, please visit https://marcellus.in/
Please refer to the following link for our Responsible Investing Policy, our ESG Integration Framework and Results of ESG scoring: https://marcellus.in/responsible-investing

