
Note: For all strategies except GCP, Performance data shown is net of fixed fees and expenses charged till December 31st , 2024 and is net of annual performance fees (Except for Little Champs Portfolio) charged for client accounts whose account anniversary/performance calculation date falls upto the last date of this performance period. Since, for Little Champs Portfolio, performances fees are charged on cumulative gains at the third anniversary, of the respective client account, the effect of the same has been incorporated for client accounts whose third account anniversary falls up to the last date of this performance period. Performance data is not verified either by Securities and Exchange Board of India or U.S. Securities and Exchange Commission.
For GCP, performance data is shown gross of taxes and net of fees & expenses charged till end of last month on client account. Returns more than 1 year are annualized. Performance data is not verified either by IFSCA or U.S. SEC.
*For relative performance of particular Investment Approach to other Portfolio Managers within the selected strategy, please refer https://www.apmiindia.org/apmi/WSIAConsolidateReport.htm?action=showReportMenu Under PMS Provider Name please select Marcellus Investment Managers Private Limited and select your Investment Approach Name for viewing the stated disclosure.
Note: APMI provides performance data for domestic strategies managed by Portfolio Managers. Since GCP is a strategy that invests globally and not in domestic stocks, performance comparison data for the same with other portfolio managers is not available on APMI.
Consistent Compounders Portfolio (CCP)
In a low churn, concentrated portfolio, with long holding periods, earnings are the predominant source of performance contribution over the long term. The other factor – the one that most investors obsess about – P/E multiple change, is a more meaningful contributor over the short term but a relatively small contributor over the longer term (because in the long-term P/E multiples mean revert).
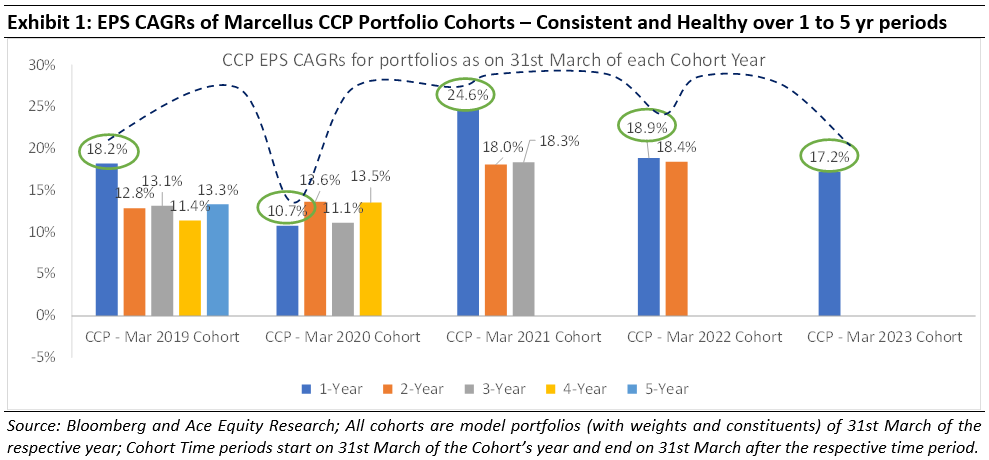
Some observations / questions related to the CCP EPS CAGR chart above:
· 17.8% is the EPS CAGR over FY19-24, of a 12-month sequential roll of the portfolio (i.e. a combination of 18.2% for Cohort 2019, 10.7% for Cohort 2020, 24.6% for Cohort 2021, 18.9% for Cohort 2022 and 17.2% for Cohort 2023).
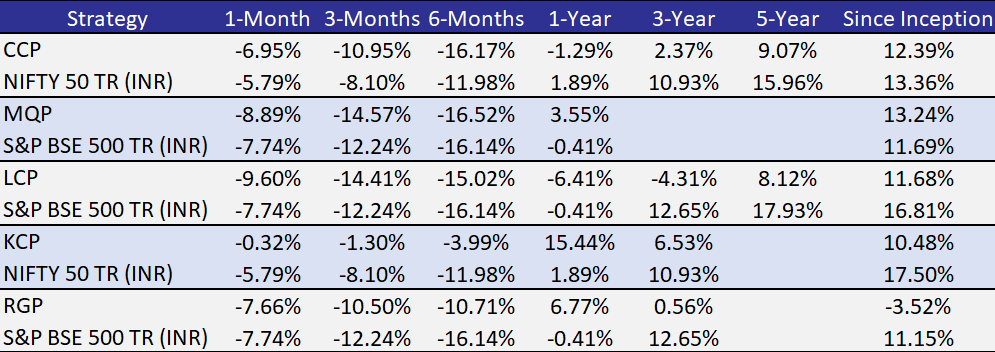
· FY19-24 EPS CAGR of 17.8% is similar to the portfolio performance (pre-fees and expenses) of 17.4%: Marcellus CCP’s five-year portfolio performance CAGR until 31st March 2024 was 15.35% net of fees and expenses. Adding back fees and expenses, this performance was 17.4% CAGR – not dissimilar from the EPS CAGR of 17.8% over the same period.
· Changes to the portfolio have helped enhance the EPS CAGR of the portfolio. The 2019 and 2020 Cohorts had weak earnings growth rates from FY20 onwards (as you can see in the chart above). This changed from the 2021 cohort onwards. Specifically, the 2021, 2022 and 2023 Cohorts have demonstrated strong earnings growth (as you can see in the chart above). For instance, had we left the 2019 or 2020 Cohorts unchanged, the subsequent EPS CAGR of the portfolio constituents would have been around 11%-13% instead of the 17.8% highlighted in the preceding bullet point.
· Nifty50’s EPS CAGR has been 16.4% over FY19-24, and 24.3% CAGR over FY21-24 – a run rate higher than long-term averages due to tailwinds for cyclical sectors such as commodities and government capex-oriented industries. This has driven Nifty50’s benchmark performance of 13.9% over FY19-24 and 15.0% over FY21-24.
Could we have done better than 17.8% EPS CAGR over FY19-24?
Yes. T he nature of the Indian economy changed post-Covid. A combination of superior physical and digital infrastructure, the benefits of economic integration in the wake of GST and a structural drop of the cost of capital (as 100mn+ Indian families shifted their savings from physical to financial assets) resulted in two different effects kicking-in: (a) smaller companies started pushing aggressively into the territory hitherto dominated by larger players eg. Astral Poly entering the paints industry; and (b) well-managed large companies realised that it is time to spread their wings and enter new industries. As we saw these changes take place in the Indian economy, we realised (about 12-18 months later than we could have realized) that by increasing allocation to ‘Enterprising Compounders’, CCP could benefit from the shape-shifting of the Indian economy. These enterprising compounders have had, and are likely to have, higher growth rates compared to the ‘linear compounders’ (i.e. companies focused towards driving growth only in the core business) that we used to invest in prior to Covid. However, having made the corresponding changes to our portfolio constituents over the past 12 months, we are well positioned to benefit from the accelerated growth rates of ‘enterprising compounders’.
Could our portfolio performance (pre-fees) have exceeded the EPS CAGR by a reasonable margin?
Yes. Besides earnings growth, the other important short-term factor contributing to the share price performance of a stock is changes in its valuation multiple (P = P/E * E). There are a few learnings around valuation changes which we could have incorporated sooner than we did e.g. de-rating of quality lenders over the last 3 years as their ROEs moderated amidst changes in the regulatory environment (discussed in our 14th Dec 2024 KCP newsletter ) and the risk of an unwind of peak valuations of quality businesses in general from their 2021 highs.
Churn in FY25 – have these changes helped further enhance the portfolio’s expected EPS CAGR? Have they made the portfolio more volatile in the short term?
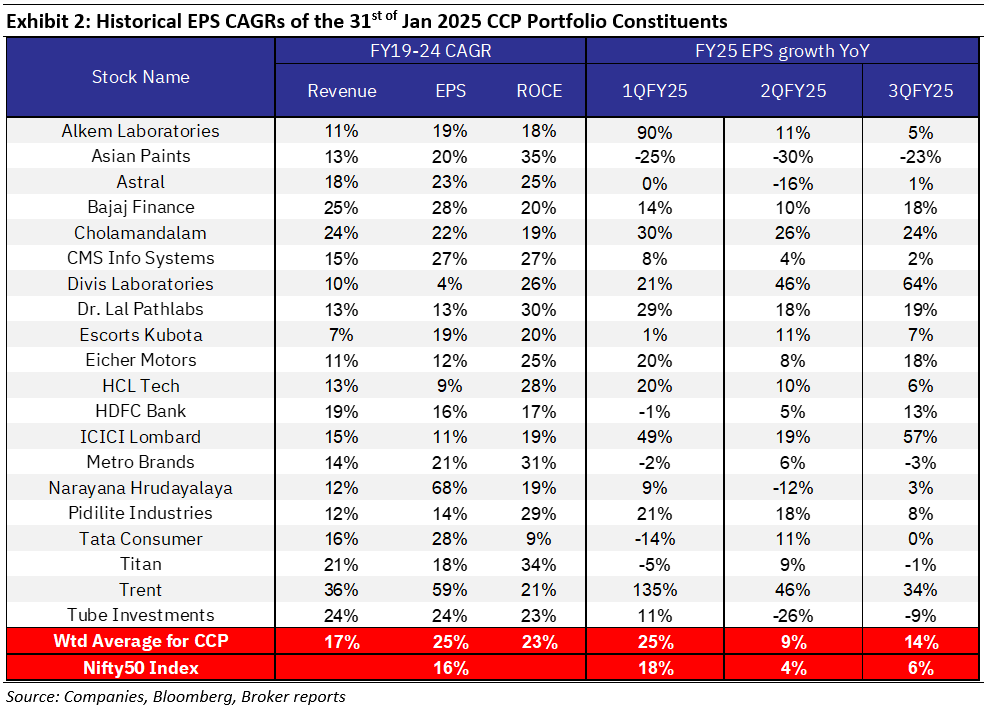
Yes. The table below highlights how the EPS growth of our current portfolio has been in FY25 so far – healthy and consistent despite a weak external macro environment (reflected in the Nifty50’s weak EPS growth during FY25). Whilst portfolio performance was tracking this earnings growth till Sept 2024, we expect the drawdown of the last three months to be temporary in nature with prospects of reversal in future. Given the non-linearity in the profit growth expectations of the ‘enterprising compounders’ compared to the ‘linear compounders’, we have witnessed greater volatility in the stock prices of these companies over the past 3 months.
Is Nifty50’s EPS CAGR over FY19-24 and the index’s performance over this period sustainable over the long term?
Unlikely. With India’s nominal GDP growth rate hovering around the 10-12% mark, fundamentals of the broader stock market (and hence of the Nifty50 Index as a benchmark) are not likely to be more than 2-3% points higher than the economic growth rate. Hence, after delivering an EPS CAGR of 24.3% over FY21-24, we expect mean reversion for the Nifty50’s EPS growth in future. We continue to remain quality oriented and absolute return oriented – hence we will continue to avoid exposures to certain sectors which don’t meet our stock selection criteria, even if they are a meaningful part of the broader benchmark indices and/or might generate healthy share price returns in the short term for the index.
Global Compounders (GCP)
February and early March brought market volatility as tariff announcements fuelled uncertainty. In February, the S&P 500 dipped 1.5%, and the Nasdaq fell 4%, but GCP, benchmarked against the S&P 500, held up better. While our positioning away from the market’s most hyped segments has been a disadvantage at times, it has also provided resilience during corrections.
Markets initially stumbled as new tariffs on Canada, Mexico, and China took effect, but investors identified opportunities in sectors poised to navigate the disruption. The Atlanta Fed’s GDPNow model signalled a softer first quarter, rekindling expectations of potential Fed rate cuts—a possible tailwind for equities.
By early March, the tariff saga peaked, triggering sharp market swings. However, signs of flexibility from the White House, including potential exemptions and delayed auto tariffs, fueled a rebound. Even as Canada and China retaliated, markets focused on de-escalation signals, steady consumer spending, and a stabilizing outlook for rates. All this might result in relatively better set up for economically sensitive part of the market with a 18-36 month view.
Despite near-term uncertainties, we believe our portfolio is well-positioned to capitalize on opportunities in an adapting market.
Portfolio Commentary
In early February, we made a few portfolio adjustments, adding high-quality businesses with strong long-term fundamentals. Couple of them are discussed in brief below.
Grainger: The largest industrial distributor in the U.S., with ~7% market share, Grainger boasts a robust distribution network of 30 automated centers, ~330 branches, and ~60 onsite locations. A leading eCommerce platform for industrial products further strengthens its business. Since 2017, under CEO D.G. Macpherson, Grainger has successfully executed a turnaround by refining pricing strategy, improving capital allocation, and focusing on organic growth. It has been an exceptional compounder through its illustrious history, and post our due diligence on the current management team we came out quite convinced that it can still be a durable low to mid teen compounder from here (source: company annual filings).
Mastercard: Facilitating 25% of all global general-purpose card transactions, Mastercard processes an annual transaction value of $9 trillion across 3.3 billion active cards. Alongside Visa, it forms a powerful duopoly, handling 90% of digital payments outside China (source: company annual filings).
Mastercard’s global market share has held steady at 24%, even as Visa’s has declined from 50% in 2017 to 34% in 2024, primarily due to UnionPay’s expansion in China. Mastercard has countered this by gaining share in the U.S. and Europe. Despite competition, commercial (B2B) payments—13% of revenue—are growing at a high-teens rate, while value-added services, which now contribute 37% of revenue, have become a major differentiator (source: company annual filings).
With stable margins and a strong buyback program, Mastercard is positioned to deliver a mid-teens total return profile, trading below its historical valuation (relative to market). Risks from blockchain and stablecoins exist but don’t appear to be immediate threats. Historically, Mastercard and Visa have adapted to disruptions, as seen with the rise of BNPL (Buy Now, Pay Later).
Broadly, attractive opportunities remain in select sectors where valuations are compelling. The market has clearly differentiated between companies executing well and those falling short. Among underperformers, we see cases where challenges are transitory, creating potential valuation arbitrage.
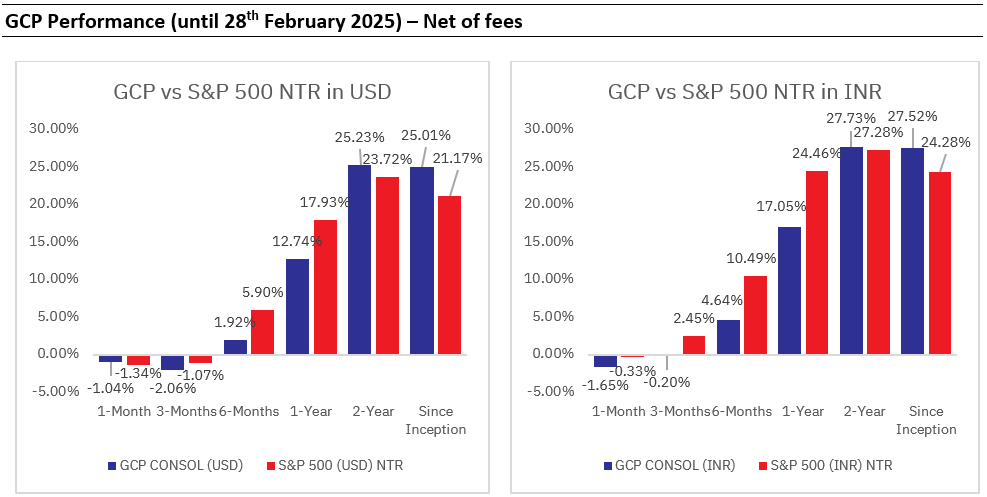
Marcellus performance data shown is gross of taxes and net of fees and expenses charged until the end of last month. Performance fees are charged annually in December. Returns for periods longer than one year are annualized. Marcellus’ GCP USD returns are converted into INR using exchange rate published by RBI. Source: https://www.rbi.org.in/scripts/ReferenceRateArchive.aspx
Since Inception’ performance calculated from 31st Oct 2022. The inception date is 31st October 2022, being the next business day after the account got funded on 28th October 2022. S&P 500 net total return is calculated by considering both capital appreciation and dividend payouts.
The calculation or presentation of performance results in this publication has NOT been approved or reviewed by the IFSCA or SEC. Performance is the combined performance of RI and NRI strategies.
Kings of Capital Portfolio (KCP)
February turned out to be another good month for KCP, with post fees NAV down by only 0.3%, whilst the broader market corrected more with Nifty 50 and Nifty Bank declining 5.8% and 2.5% respectively. Over the past 6, 12 and 24 months, the Kings of Capital portfolio has performed better than the Bank Nifty Index as the euphoria and investor interest in public sector banks, tier-II private banks has subsided over the past year.
Within the financial segments, the drawdown in February was most pronounced for capital market stocks, with most declining 10-20%. The hyperactivity in capital market space appears to be slowing down as evidenced by (a) CDSL’s net client additions run-rate reaching its lowest point in the last 9 months during February, (b) steep decline in trading volumes at Indian stock exchanges (read here ) and (c) decline in outstanding SIP accounts MoM in February. Read an interesting take on the broking space by Nithin Kamath here. KCP’s timely exit (only 0.5% exposure) from capital markets space continues to hold us in good sight.
As the Q3 results season concluded, earnings growth for KCP held up delivering 18% YoY EPS growth. At the same time, Nifty EPS growth has 14%, 6% and 10% respectively in Q1, Q2 and Q3 respectively. Whilst Q3 EPS growth for KCP was similar to Q2, negative surprises (vs. our expectations) by portfolio companies were significantly lower in Q3. The outcomes on asset quality turned out to be product specific (still largely unsecured), growth though continues to remain soft in banks, whilst NBFCs continue to shine.
On the regulatory front, the RBI has continued to implement its easing policy by cutting the repo rate, injecting liquidity into the system, and reducing risk weights on loans to NBFCs and microfinance loans by banks. These measures are positive for NBFCs, as they benefit from increased credit availability and lower borrowing costs.
Over the last 12-18 months, we have expanded our horizons and coverage universe in financials. While there were areas where we lacked valuation comfort, the broader market correction has made select opportunities more attractive. We continue to seek such opportunities and maintain dry powder, with cash in the portfolio at ~10% (as of 28th February), to capitalize on these opportunities.
Little Champs portfolio (LCP) and Rising Giants portfolio (RGP)
The Little Champs portfolio earnings, after seeing declining trends through FY24, continued on its path of recovery with allocation weighted average earnings witnessing a YoY growth of 17% in the recently reported 3QFY25. Similarly, Rising Giants portfolio companies’ earnings continue to hold up with a corresponding number of 12% for 3QFY25.
As discussed in our recent newsletters, some of the reasons which have contributed to recovery in the portfolios’ earnings are:
- Green shoots in the Export markets: Export markets which served as Achilles heel for both the portfolios in FY24 have come to the rescue when the domestic macro is not looking good. Most of the Exports oriented companies in both the portfolios have recorded strong double-digit growth in 3 QFY25. The average YoY PAT growth for the export-oriented portfolio companies in the Little Champs portfolio has been close to 30% whereas the number is close to 17% for the Rising Giants portfolio.
- Rural oriented stocks such as Dodla Dairy and Godrej Agrovet have done well in terms of earnings growth.
We remain sanguine about the relative prospects of the Little Champs and Rising Giants portfolios driven by our confidence around the earnings outlook, healthy balance sheets and management quality of our portfolio stocks which has historically helped them exhibit high degree of resilience during periods of market drawdowns.
However, given the concerns surrounding the broader correction in the small and mid-caps space, we have increased the proportion of the cash balances in both our Little Champs and Rising Giants portfolios. This is to serve as a risk mitigation strategy as well as keeping liquidity in hand to deploy in quality names (in our research coverage universe) that see sharp dislocation in their share prices.
There has been no change (addition/exit) in the Rising Giants PMS portfolio in the month of February 2025.
We have added L&T Technology Services to the Little Champs PMS portfolio in the month of February 2025.
Regards,
Team Marcellus
If you want to read our other published material, please visit https://marcellus.in/insights?filter
Please refer to the following link for our Responsible Investing Policy, our ESG Integration Framework and results of ESG scoring: https://marcellus.in/responsible-investing

