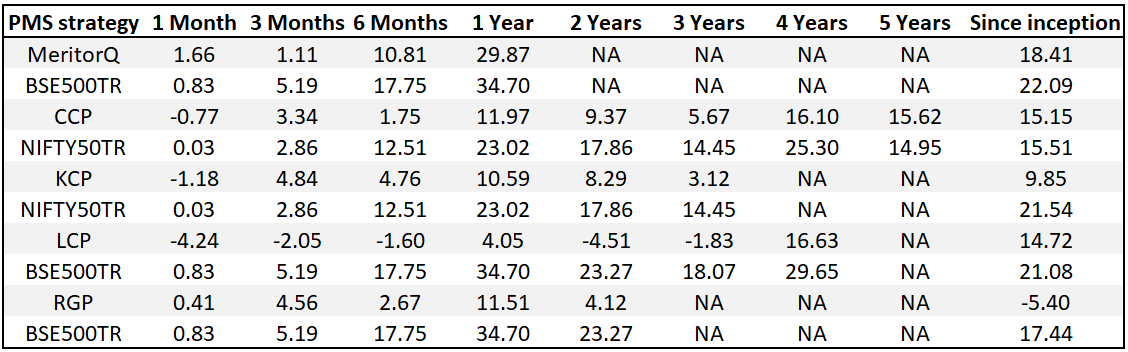
*For relative performance of particular Investment Approach to other Portfolio Managers within the selected strategy, please refer https://www.apmiindia.org/apmi/WSIAConsolidateReport.htm?action=showReportMenu Under PMS Provider Name please select Marcellus Investment Managers Private Limited and select your Investment Approach Name for viewing the stated disclosure
Consistent Compounders Portfolio (CCP)
Marcellus’ CCP Portfolio is almost entirely exposed to five sectors of the economy – premium consumption, healthcare, knowledge intensive exports, private capex and home building materials. We expect sustained tailwinds to these five sectors over the next few years.
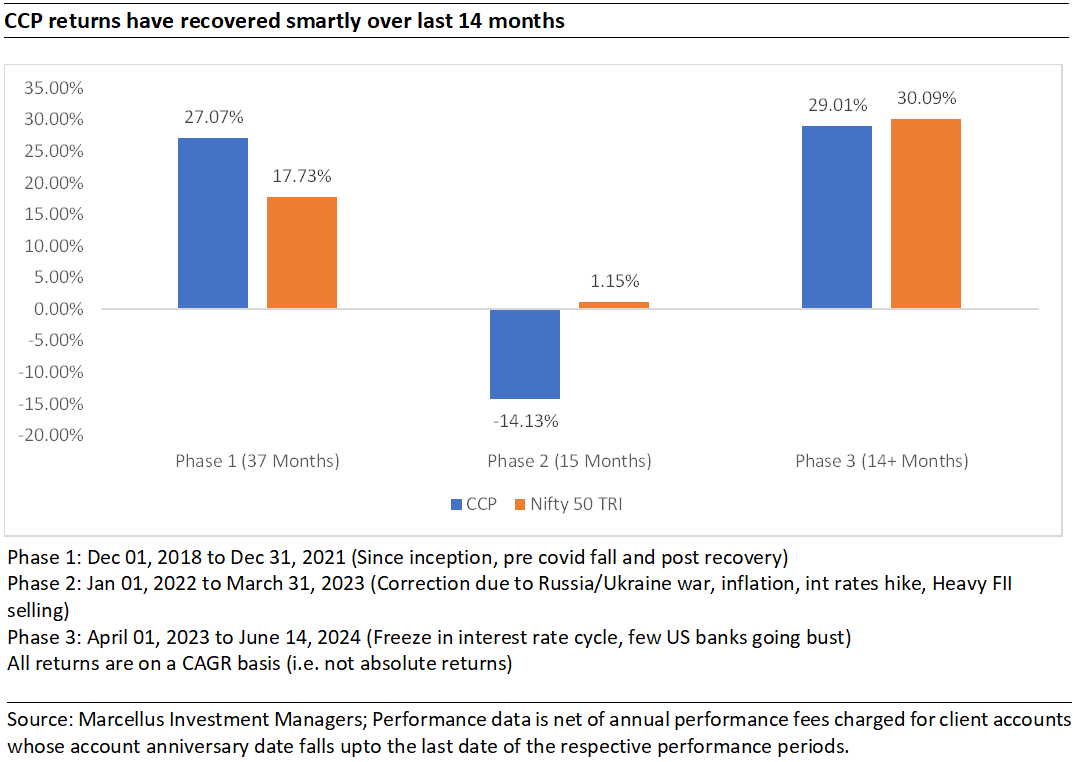
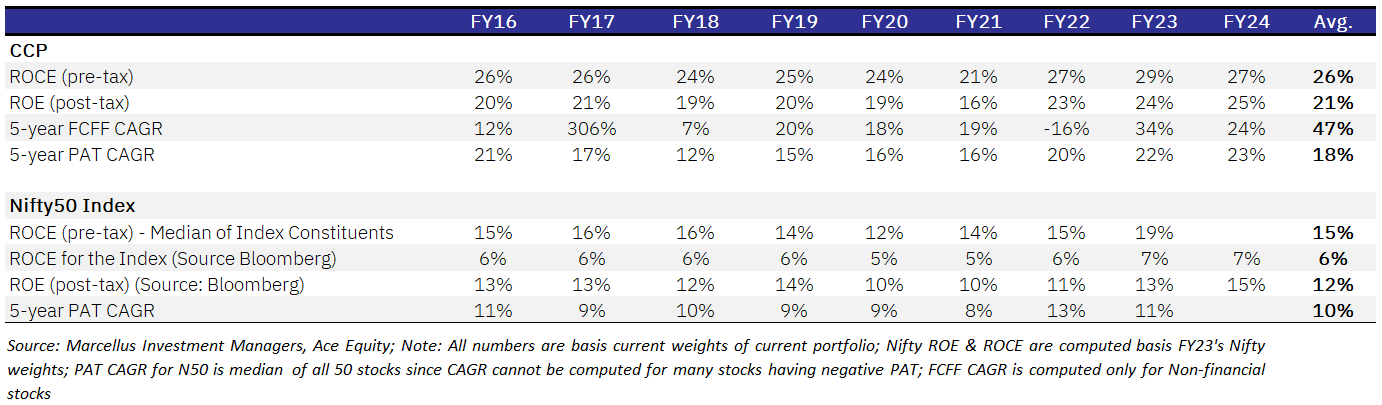
Fundamentals of Marcellus’ CCP continue to compound at a healthy and consistent rate – on the back of a median PAT CAGR of 20% over FY19-23, CCP’s portfolio constituents delivered a median PAT growth 28% YoY in FY24. We expect over 20% CAGR in PAT for our portfolio companies over the next 3-5 years, driven by 25-30% ROCE (returns on capital employed) and 70-80% rate of reinvestment of operating cash flows back into the business. As highlighted in the chart below, CCP’s performance has recovered smartly over the past 14+ months (FY24 and FY25 till date) as share prices catchup with the fundamentals of the portfolio companies. We expect to see continued recovery in performance, both in absolute terms as well as relative to the benchmark over the next 12-24 months.
Over the last 12 months, CCP has undergone a significant increase in allocation to companies (from 10% allocation previously to over 50% currently) which have seeded new business optionalities through capital allocation decisions over the last 3-5 years. These new business optionalities are expected to add incremental revenue growth drivers over the next 2-3 years, thereby helping accelerate the overall company’s earnings growth to well above 20% CAGR (in some cases, even higher than 25% CAGR). Current market valuations of these businesses do NOT factor in the upside related to the conversion of these optionalities into accelerated earnings growth. Moreover, the stocks where these allocations have increased plug directly into macro tailwinds of private capex pickup, organized healthcare penetration and building materials. After the addition of Trent, Astral and Narayana Health in FY24, during FY25 till date (i.e. since 1st April 2024) we have added three new stocks to the portfolio – Tube Investments, Cholamandalam Investment & Finance and Eicher Motors. Additionally, across the CCP portfolio, we continue to remain focused on companies with deeply moated core business, prudent capital allocation decisions and a decentralized execution through systems, processes, and professional empowerment.
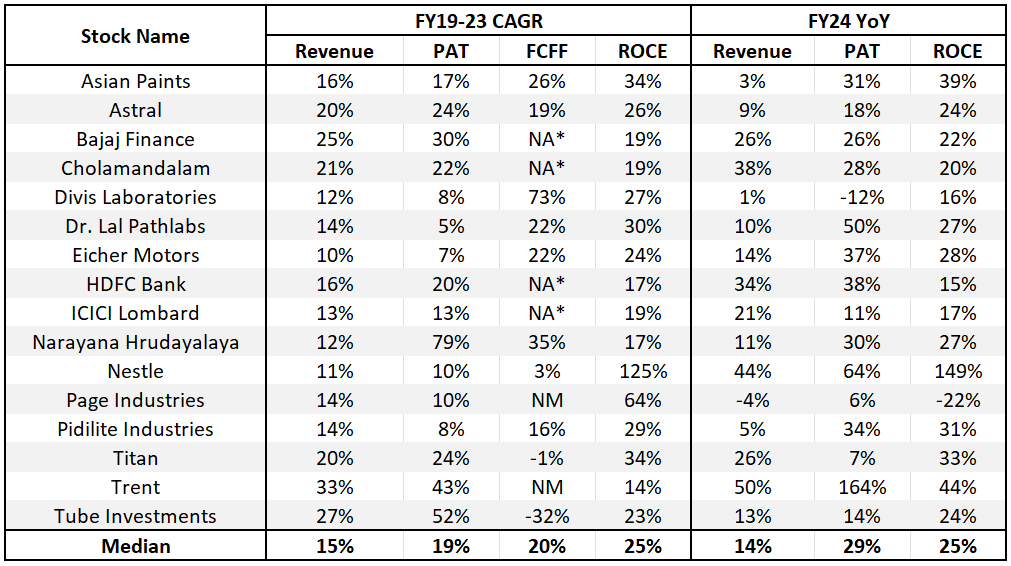
Source: Marcellus Investment Managers; Ace Equity; Note: (a) In case of ILOM, Net Written Premium (NWP) is considered as revenue, (b) In case of lenders; Total Income (Interest Income+ Other income) is considered as revenue. (c) *NA – No FCF data since these are financial stocks for which FCF is not a relevant metric. (d) Revenue/PAT numbers for HDFC bank are not comparable due to merger with HDFC ltd. Like for like EPS growth is 8% YoY for FY24.
Global Compounders Portfolio (GCP)
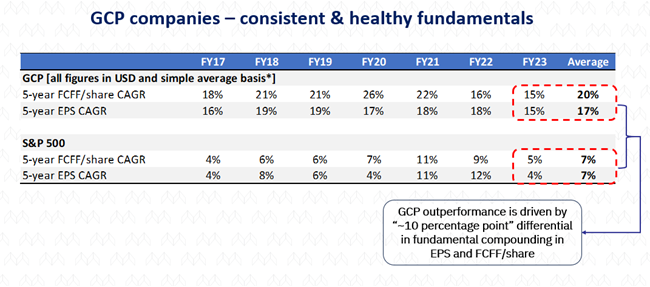
Global Compounders Portfolio has consistently outperformed the S&P 500 across key timeframes—6 months, 1 year, and since inception—despite minimal exposure to the big tech giants that have fueled the market rally since late 2022. This outperformance is primarily driven by stronger EPS growth, which has surpassed the broader index by approximately 10 points.
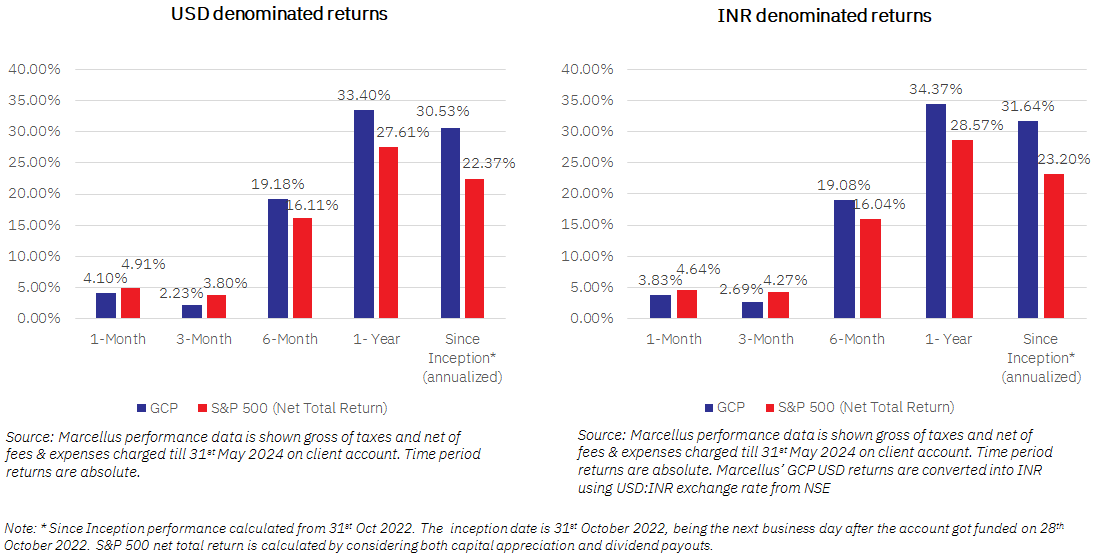
At a gross level, our portfolio’s performance mirrors its fundamental outperformance, as illustrated in the following net return chart (post-fees).
We discussed our underweight position in Big Tech. To put this into perspective, not owning Nvidia has detracted approximately 750 basis points from our performance relative to the S&P 500 since inception. This year alone (up to May 2024), Nvidia’s 150% YTD rally has detracted 340 basis points. Currently, Nvidia comprises about 7% of the benchmark index, making its absence felt more acutely on a relative basis. We regret not including Nvidia in our portfolio, as we did not anticipate the magnitude of impact of the AI-driven surge in its GPU chips. At this point, however, its valuation at ~26.5x Price to Sales (FY25) appears overly expensive. Nvidia remains a cyclical stock in our view, and we may reconsider its inclusion when the price aligns better with our valuation criteria. In a relatively tough economy, momentum chasers may continue to bid up such stocks, sometimes irrationally. However, this also presents opportunities for long-term investors to acquire undervalued companies with strong compounding potential. Valuation is crucial, and while the timing of market corrections is unpredictable, it becomes significant in the long run.
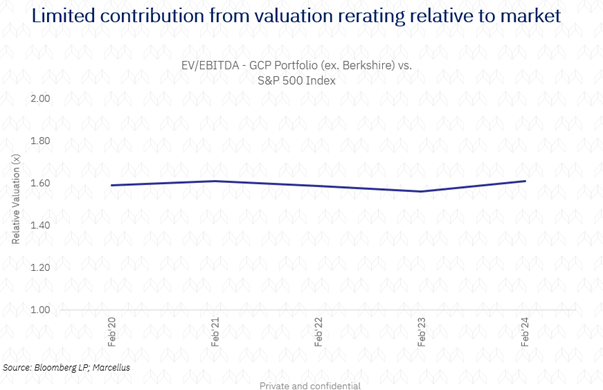
It is good to see that, our portfolio’s outperformance relative to the benchmark has been driven by strong fundamentals. The relative valuation (EV/EBITDA) compared to the benchmark has remained stable over the past five years, reinforcing our investment strategy.
We made few changes this year as some of our preferred stocks exceeded our “Margin of Safety” valuation threshold:
Exits:
A. Apple: While we maintain confidence in Apple’s robust moat and strategic initiatives, we exited due to its high valuation (approximately 24 EV/EBITDA). This valuation limits future relative returns given its EPS growth potential of 10-12% (including buybacks). Apple’s significant rerating over the last year likely limits its future relative total return.
B. Costco: Although Costco remains a strong franchise, its current valuation (approximately 30 EV/EBITDA and 40x normalized P/FCF) seems too high for its total return potential of ~10-13%. We await better entry points, as we believe Costco to be a once-in-a-generation franchise.
C. Intuitive Surgical: Despite delivering at an accelerated pace, Intuitive Surgical trades at 62x PE on consensus (53x forward normalized PE), which is too high when adjusted for Stock Based Compensation. This valuation bakes in 12-15 years of excess return of around 5-7%, which might be a tall ask.
New Position:
A. American Tower: Towers are vital connectivity hubs between mobile devices and core networks, offering a cost-effective wireless coverage solution. In the US market, where American Tower (AMT) thrives, the entry barrier is substantial, comprising approximately 55% of AMT’s total revenue. Single-tenant-owned towers present cost advantages over operator-owned multi-tenant towers, benefiting both carriers and tower operators. AMT’s US business, growing predictably at 5-7%, boasts significant cost savings and a sizable capital pool for international expansion. Positioned favorably against competitors like Crown Castle and SBA Comm, AMT focuses on less dense areas, anticipating continued growth over denser cities. With a longstanding international presence, AMT stands out, leveraging its REIT status for high leverage and competitiveness against private equities. Historically compounding intrinsic value in low double digits, coupled with a dividend yield, AMT offers a compelling low-teens total shareholder compounding. Amidst the early stages of the 5G transition and attractive relative valuation, AMT appears highly appealing.
Overall, we believe that the Global Compounders Portfolio (GCP) is progressing well toward its core objective: identifying companies that excel in capital allocation, dominate niche markets, and can sustain a compound annual growth rate (CAGR) in the teens over a cycle, all while maintaining a reasonable “Margin of Safety.” We acknowledge that there may be intermittent challenges, particularly as market momentum and herd behavior around flashy themes can create short-term anxiety. However, we are committed to staying rational in our decision-making, focusing on fundamentals, and ultimately creating long-term outperformance and wealth.
Kings of Capital Portfolio (KCP)
During FY24 (12 months ending 31st March, 2024) the Kings of Capital portfolio delivered 19% returns post fees and expenses. The 19% return was lower than the Nifty50 return of 30% as the financial services sector underperformed the broader indices – this was evidenced by the fact that Nifty Financial Services Index delivered 16% returns during FY24.
During FY24, the KCP portfolio delivered 24% operating profit growth along with 20% RoEs, this growth compares favourably versus the previous years as lending, general insurance and capital markets saw tailwinds during the year. It was only in the second half of the year that lenders faced margin pressures and challenges on deposits which were also partially offset by lower than expected credit costs.
The portfolio’s allocation of ~45% to banks, NBFCs at ~25%, insurers at ~10-15% and asset managers at ~10-15% has resulted in delivering PAT growth of 20%+ consistently across time periods. As each of these sub segments go through various cycles, increasing weights to segments which are delivering higher growth while reducing allocations to lower growth segments has resulted in ~25% PAT growth CAGR for the portfolio.
We believe the portfolio is well positioned to deliver healthy earnings growth albeit at a pace lower than what we saw during FY23 and FY24 as credit costs for lenders normalise and banking sector loan growth reverts to 12-13%. On the other hand, capital markets and general insurance continue to do well which is why we have increased our allocation to these two segments.
There were no additions/ exits from the portfolio during the past month.
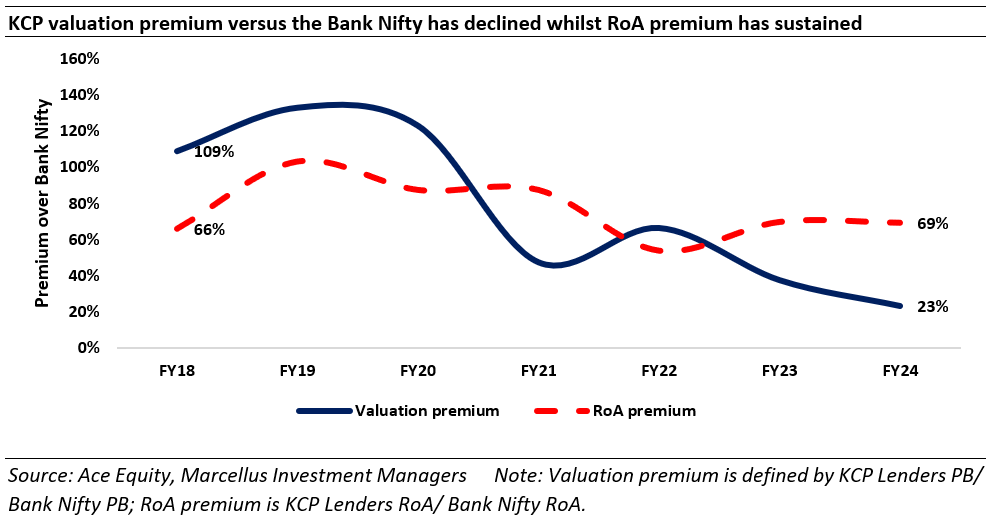
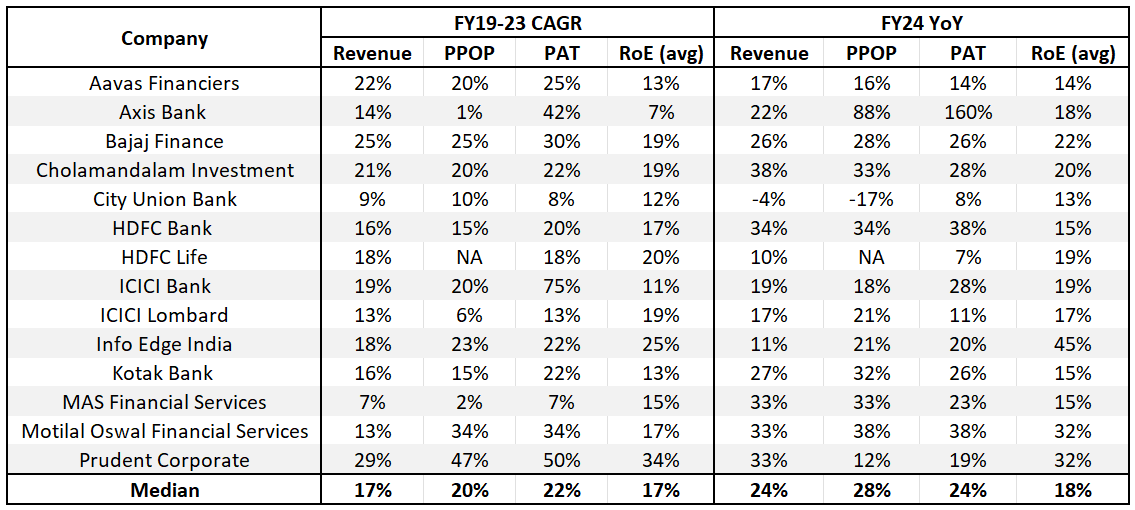
Source: Marcellus Investment Managers; Ace Equity, Bloomberg; Notes: 1. 3Yr simple average ROEs were used for portfolio companies; 2. PPOP is operating profit and revenue is total income (NII + other income); 3. Standalone data used for all portfolio banks and consolidated data used for Bajaj Finance; 4. For HDFC Life, PAT denotes value of new business (VNB); 5. For insurance companies, revenue denotes Net Written Value (NWV);6. In case of lenders; Total Income (Interest Income+ Other income) is considered as revenue; 7. Revenue/PAT numbers for HDFC bank are not comparable due to merger with HDFC ltd. Like for like EPS growth is 8% YoY for FY24.
Little Champs portfolio (LCP) and Rising Giants portfolio (RGP)
Little Champs portfolio companies have historically delivered healthy earnings growth as can be seen in the exhibit below on the back of the strong competitive advantages enjoyed by these companies and continued reinvestments in building growth drivers and management bandwidth. However, FY24 turned out to be a year of moderation in earnings for the portfolio companies. As we have discussed in our earlier communications, reason for aforementioned deceleration is related to higher exposure to the export-oriented companies that’ve witnessed muted earnings due to unfavourable demand-supply dynamics impacting the volumes as well as the realization and profits.That said, we are witnessing a bottoming out of destocking cycle that has been impacting the earnings in the recent quarters. We indeed saw some corroboration of the same in the 4QFY24 results – the median earnings growth of the portfolio companies stood at 8% in 4QFY24 compared to negative 5% in 3QFY24.As we head into FY25, the portfolio earnings would also benefit from a favourable base of FY24. Lastly, any positive development (cut) on interest rates can be an icing on the cake in terms of significantly improving the consumer sentiments for the stocks with global market exposure. The key risk for this portfolio with sizeable global exposure remains any adverse development in the geopolitical front that can create significant volatilities in demand and costs.The above commentary also applies to the Rising Giants portfolio where we see much better earnings growth trajectory in FY25.We continue to make suitable changes in the portfolio to create more diversity and bring the healthy earnings growth trajectory back in the portfolios
Additions to the portfolio:
A. Ahluwalia Contracts (India) Ltd.
We see significant opportunities in building construction coming up over the next 3-5 years, led by multiple sub-segments, including railway station redevelopment, airport terminals, hospitals, educational institutions, private residential real estate, commercial real estate etc.
ACIL is very well placed to take advantage of these opportunities, given its pre qualifications, bidding and execution experience and strong balance sheet. In a sector with low entry barriers, every cycle sees a churn in the key players in the market, with many old stars dying and new ones entering. However, ACIL has survived multiple cycles and for most of its history maintained pretty good ROCEs (10-year average of 23.2%) and a debt-free balance sheet, the latter being rare in this sector. They have achieved this through:
§ A conservative approach to bidding;
§ Limited adventures in capital allocation; and
§ Focus on execution, with a high degree of the promoters’ direct involvement.
The first two are the result of learnings from mistakes, which we believe are now ingrained in their functioning. Resultant, the company today has progressed to competing with the likes of L&T in building construction projects, with individual order sizes of Rs25bnr+. For context, the company’s F23 revenues were ~Rs2.8bn.
Exit from the portfolio:
A. Vijaya Diagnostics Limited: Vijaya Diagnostics’ share price has returned 81% in the 12 months (preceding the exit date) and has been one of the top performers in the Little Champs portfolio. Given this sharp share price run-up and basis the earnings growth, the exit multiple and dividend yield over the next five years built in by the investment team, the IRR on the stock has come down to the level where it doesn’t meet the return expectations of the Little Champs portfolio.
Changes to the Rising Giants PMS model portfolio (as at May 31, 2024)
Additions to the portfolio:
A. Poly Medicure LimitedPoly Medicure has built an enviable exports franchise in the medical devices (specialising in disposable plastic consumables) over the last three decades thanks to:
- A large addressable multi-billion-dollar global markets dominated by MNCs (such as Bector Dickinson, Baxter, Nipro, B. Braun, Fresenius etc) but yielding market share to players like PolyMed providing good quality products at much lower price.
- Consistent high reinvestments in product development, manufacturing capacities/automation, distribution expansion and building an extensive customer acquisition/service team. Furthermore, in recent years, the Company has further built a strong layer of senior management team to look after the expanded product categories and geographical spread.
The Company has also used the exports playbook to capture market share in India from higher cost MNC peers and seen good degree of success.
The result of the above is a consistent financial track record of healthy earnings growth (23%/29%/18% over 3/5/10 years) and 20%+ pre-tax RoCEs through 3/5/10 years.
Besides continual market share gains in the core infusion therapy; the company is also ramping up in categories like renal and entering newer ones like diagnostics, critical care and cardiology. This together with addition of important US geography make us project earnings growth of 21% over FY24-29.
Exits from the portfolio
A. Dr Lal Pathlabs
Dr Lal Pathlabs’ share price has returned 24% in the last 12 months preceding the date of exit. Further, aggregating the three components that makes up the expected IRR on the stock i.e. expected earnings growth, changes between the current P/E and the expected exit P/E, and the dividend/cash optionalities – the IRR on the stocks warranted an exit from the portfolio.
Little Champs witnessed moderation in FY24 earnings; but headwinds fading away makes for a better FY25 outlook
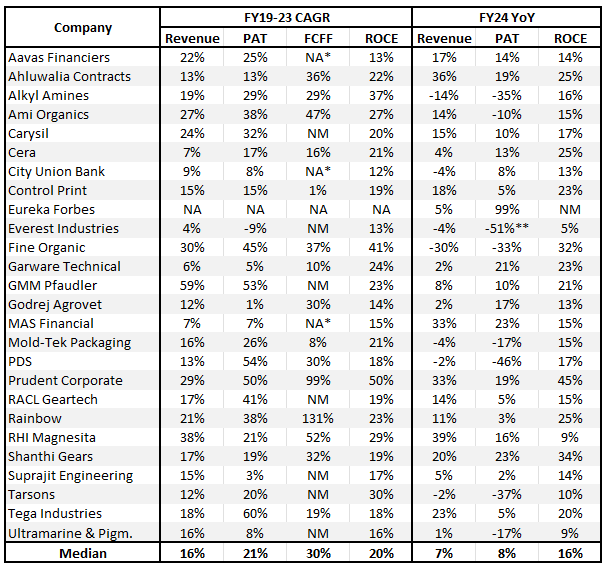
Source: Marcellus Investment Managers, Ace Equity. (1) *NA – No FCF data since these are financial stocks for which FCF is not a relevant metric (2) 3-year rolling average was used to calculate FCF CAGR and RoCEs. Portfolio composition as on 31st May, 2024. RoE given for financial firms in place of ROCE. (3) ** PBT growth considered due to certain tax one-offs in PAT figures.
Rising Giants portfolio continued to deliver decent earnings growth albeit with some moderation in FY24
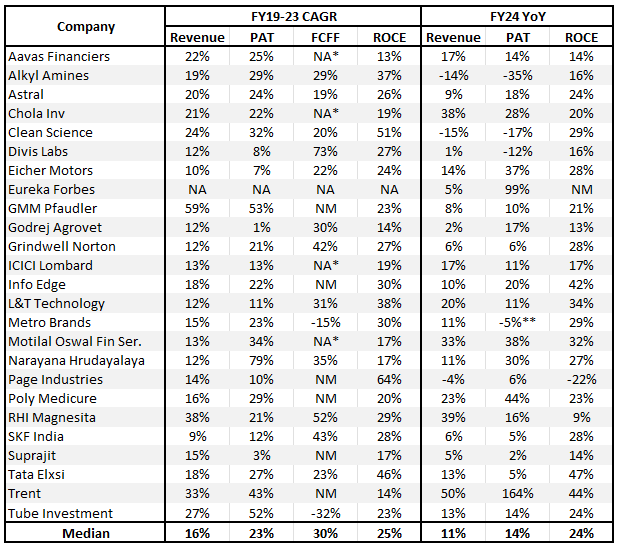
Source: Marcellus Investment Managers, Ace Equity. (1) *NA – No FCF data since these are financial stocks for which FCF is not a relevant metric (2) 3-year rolling average was used to calculate FCF CAGR and RoCEs. Portfolio composition as on 31st May, 2024. RoE given for financial firms in place of ROCE. (3) ** PBT growth considered due to certain tax one-offs in PAT figures

