After falling by about 39% from its January 2018 peak to its August 2019 trough, the BSE Smallcap index has since returned 22%. This rebound has been fairly broad-based with >70% of the BSE Smallcap stocks giving positive returns. However, this rally does not seem to be backed by any meaningful improvement in the underlying macros and corporate earnings (as seen in muted 3QFY20 quarterly results so far). History shows that earnings growth and RoCE remain the key drivers of long-term share price performance. Against this backdrop, we stick to the time-tested formula of identifying and investing in a portfolio of small-cap companies with high earnings growth and RoCEs alongside clean corporate governance rather than focusing on superficially cheap but low-quality small-cap stocks. The key objective of our small cap “Little Champs” Portfolio is to own a portfolio of about 15 sector leading franchises with stellar track records of capital allocation, clean accounts and high growth potential.
Performance update of the live Little Champs Portfolio
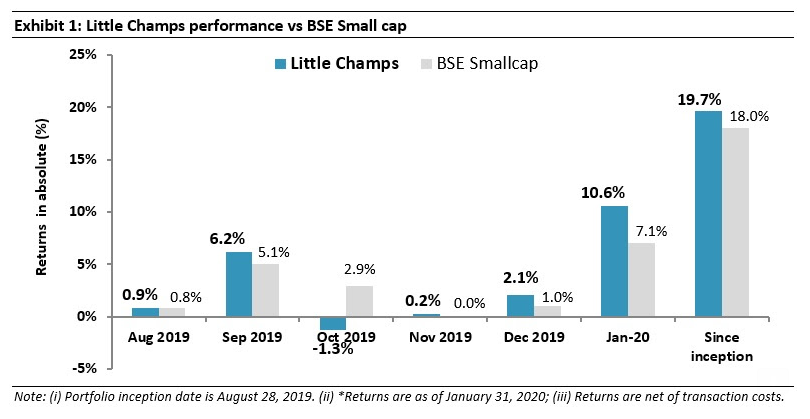
The Little Champs Portfolio went live on August 28, 2019. The performance so far is shown in the below table.
Earnings Growth and Return on Capital have been sustainable drivers of share price returns…
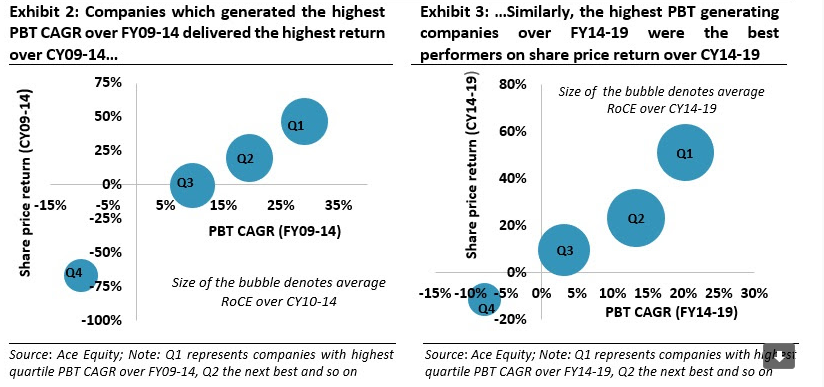
The last 10 years clearly indicate that the best performing small cap stocks have been those which have generated the highest earnings growth as well as the highest return on capital employed (ROCE). For instance, as shown in the charts below, for both the time periods FY09-14 and FY14-19, the companies which delivered the highest PBT growth also ended up delivering the highest share price returns. Interestingly for both these time periods, companies which scored the highest PBT growth (represented by bucket Quartile 1 or Q1 in below charts) also turned out to be companies generating the highest RoCE. The positive relationship between PBT growth and RoCE and vice-versa is not surprising given that companies with higher margin (and thereby higher PBT) generate higher RoCE. Similarly, higher RoCE implies higher cash generation, lower interest expenses and higher sustainable revenue growth. Hence, the inter-dependent relationship between the two.
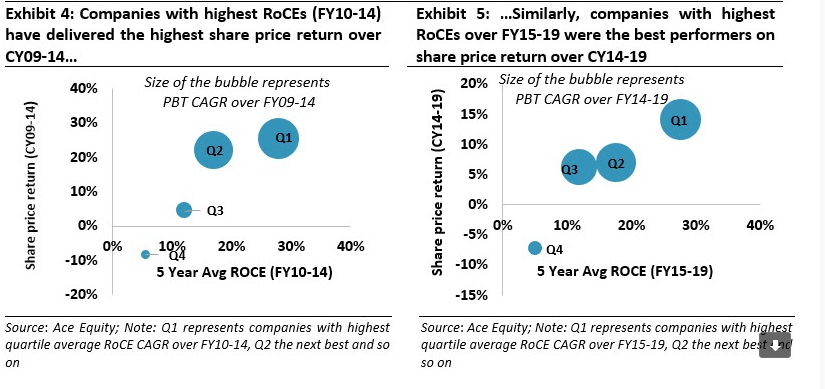
Similarly, as shown in the charts below, the highest RoCE companies have delivered highest share price returns. Interestingly here too, companies which generated the highest RoCE (represented by Quartile 1 or Q1 in below charts) also turned out to be companies generating the highest PBT CAGRs.
… rather than ‘cheap’ valuations
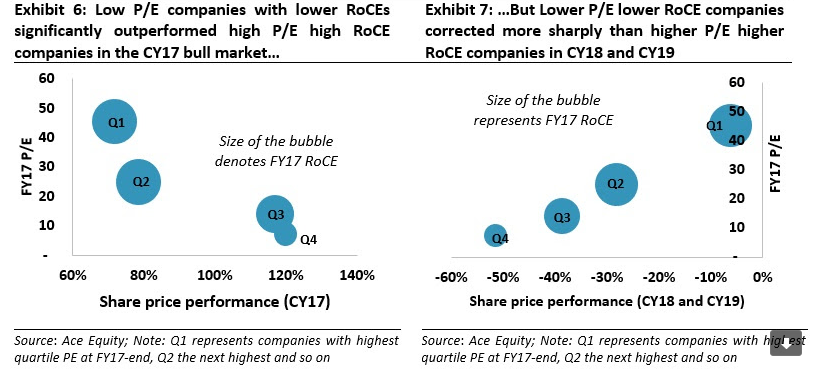
On the other hand, a common misperception amongst the investors is that ‘cheapest’ stocks generate the best returns. In reality, there is hardly any correlation between lower P/E multiples (unless they generate healthy earnings growth and RoCEs) and higher share price return. However, this relationship (lower P/E and higher share price return) may prevail for short periods of irrational exuberance (where factors such as abundant liquidity rather than company fundamentals drive share price performance). For instance, in CY17, lower P/E stocks (combined with lower RoCEs) significantly outperformed the more expensive but quality stocks (represented by higher RoCEs). But such a run does not last long – the same set of low P/E stocks which scored big time in CY17 witnessed the steepest fall in CY18 and CY19 as liquidity dried up and share prices started tracking the underlying fundamentals (growth and return on capital).
Marcellus Little Champs Investment process to navigate the tricky world of small caps
At Marcellus, the key objective of the “Little Champs” Portfolio is to own a portfolio of about 15 sector leading franchises with a stellar track record of capital allocation, clean accounts & corporate governance and at the same time high growth potential. While we intend to fill our portfolio with winners, we want to be particularly sure of staying away from dubious names where we are not convinced about the cleanliness of the accounts or the integrity of the promoters (even though business potential may sound promising) as the fruits of company’s performance may not get shared with minority shareholders. We intend to keep the portfolio churn low (not more than 25-30% p.a.) to reap the benefits of compounding as well as minimise the impact of trading costs.
We use the following process to build the Little Champs portfolio:
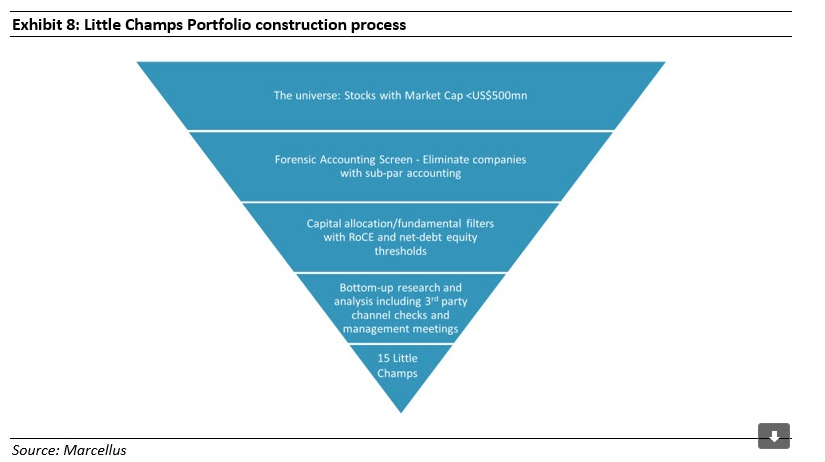
For more details on Marcellus Little Champs investment process please refer our January 2020 newsletter (LINK)
Little Champs – a portfolio of companies with healthy earnings growth and return on capital
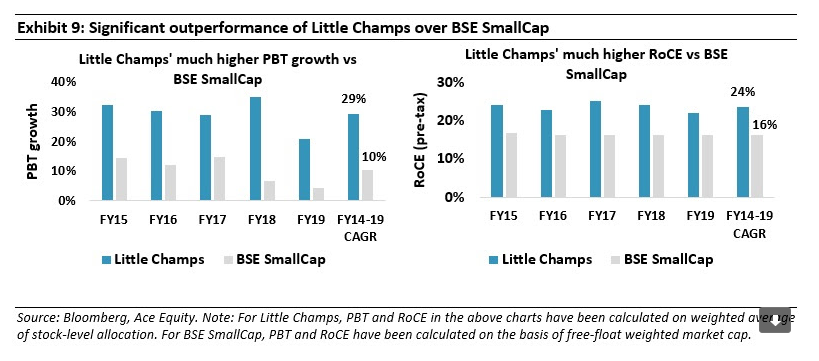
As of today, we have a total of 14 stocks in our Little Champs portfolio with equity allocation of close to 90%. While our stock selection is purely bottom-focussed, no single sector constitutes >20% of invested corpus. Backtesting results show that over the last five years in a seemingly tough period for macro-economic environment and corporate earnings, the Little Champs portfolio has, on a weighted basis, delivered a PBT CAGR of 29% over FY14-19. This earnings growth has been combined with a reasonably healthy weighted average RoCE (pretax) of 24% over FY15-19. This has been significantly better than the underlying PBT growth and RoCE for BSE Smallcap as shown in the below charts. In short, almost all of our investee companies would fall under Q1 if were to go by the classification used in the charts shown at the beginning of this note.
We will go into the details of what drives the healthy performance of Little Champs compared to its small cap counterparts in the subsequent newsletters. The objective of this newsletter is to spell out clearly that we are sticking to the time-tested formula of identifying and investing in a portfolio of small-cap companies with high earnings growth and RoCEs with clean corporate governance rather than cheap but low-quality small-cap stocks. By itself, “cheap” (i.e. low P/E) stocks are not something which are of interest to us.
Regards
Team Marcellus
If you want to read our other published material, please visit https://marcellus.in/blog/

