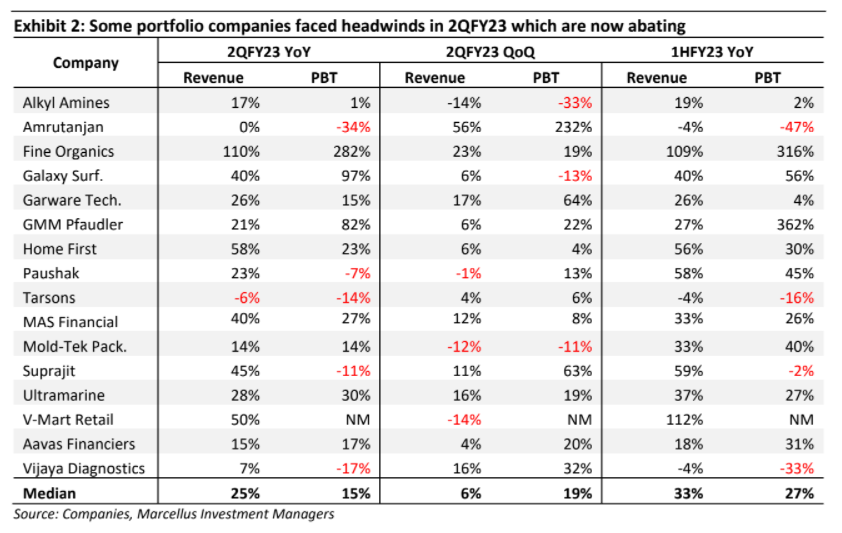
In 2QFY23, Little Champs Portfolio (LCP) witnessed median revenue growth of 24% and PBT growth of 14%. However, some portfolio companies did face headwinds around revenues (Covid-19 related revenues tapering off, impact from price hikes) and margins (raw material and energy costs up). However, these headwinds have been abating in recent months which should aid demand and margin recovery going forward. We focus in this note on the LCP stocks which have witnessed significant drawdowns (>15%) in the last 12 months: Suprajit (improving situation in the Light Duty Cable division whilst the core business continues to grow faster than the automotive industry), V-Mart (price cuts from falling raw material prices to aid demand recovery while Unlimited and Lime Road acquisitions plug key portfolio gaps), Tarsons (continues to grow faster than peers whilst investing in expanding its product portfolio), Amrutanjan (strong sales in sanitary napkins and ORS while gaining market share in the core pain balm segment), and Aavas (asset-liability matching gives confidence regarding spreads in a rising interest rate environment).
Performance update for the Little Champs Portfolio
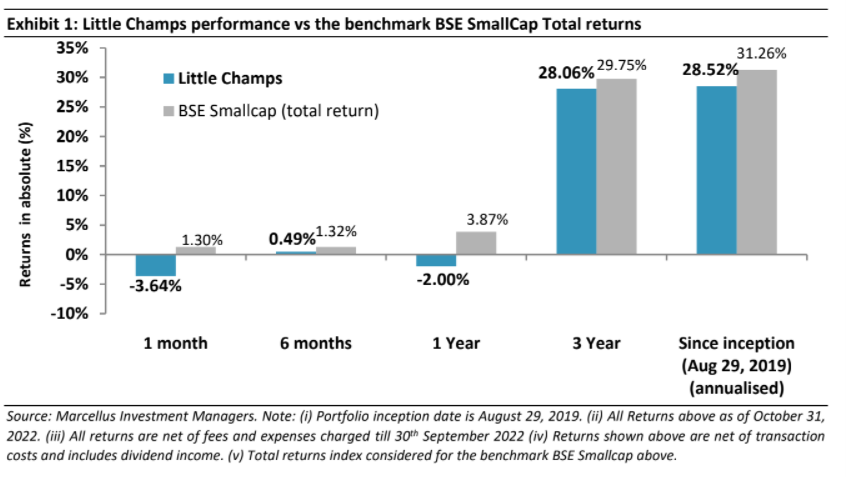
At Marcellus, the key objective of our Little Champs PMS is to own a portfolio of about 15-20 sector leading franchises with a track record of prudent capital allocation, clean accounts & corporate governance and at the same time healthy growth potential. While we intend to fill our portfolio with companies having the above attributes, we want to stay away from names where we are not convinced about the cleanliness of accounts or the integrity of the promoters (even though the business potential may sound promising) as the fruits of company’s performance may not get shared with minority shareholders. We intend to keep the portfolio churn low (not more than 25-30% per annum) to reap the benefits of compounding as well as minimize trading costs. The Little Champs Portfolio went live on August 29, 2019. The performance so far is shown in the below table.
2QFY23 results: decent show by most LCP companies
As shown in the exhibit below, most LCP companies performed relatively well in 2QFY23 with portfolio level median revenue growth being 24% and PBT growth coming in at 14%. Some portfolio companies faced the following headwinds:
▪ Factors impacting revenue growth: (i) Some portfolio companies had benefited from a Covid-19 related revenue boost in FY21 which continued through into 1HFY22. However, as Covid-19 cases came down drastically over the last nine months, such revenues have tapered off and impacted the YoY growth comparison in 2QFY23, especially for the likes of Tarsons, Vijaya Diagnostics, Amrutanjan Healthcare and Alkyl Amines; and (ii) More specifically, in Q2 FY23 demand growth was adversely impacted for V-Mart
due to price hikes.
▪ In the addition to the impact on revenue growth, elevated raw material prices impacted the gross margins of some LCP companies. Additionally, high power & fuel costs also impacted the operating margins of Alkyl Amines, Suprajit Engineering, Garware Tech, Tarsons.
However, most of the Q2 FY23 headwinds mentioned above are abating due to:
▪ Reduction in most raw material input costs in recent months ranging from chemicals to metals to agro commodities. This may not only help boost the profit margins of the LCP companies but also aid volume recovery as some of the raw material benefits have been passed on to the customers in the form of reduction in product prices.
▪ Covid-19 related revenues tapering off significantly from 3QFY22 will make YoY base far more benign from 3QFY23 onwards.
Consequently, we remain sanguine about the earnings prospects of the portfolio companies for the coming quarters and years.
Addressing near term questions for a few LCP stocks
As shown in Exhibit 1, the LCP portfolio’s value has declined by 2% in the year ending October 31, 2022. The stock-wise absolute returns for the portfolio companies for three, six months and twelve months ending November 25, 2022 are presented in the exhibit below:
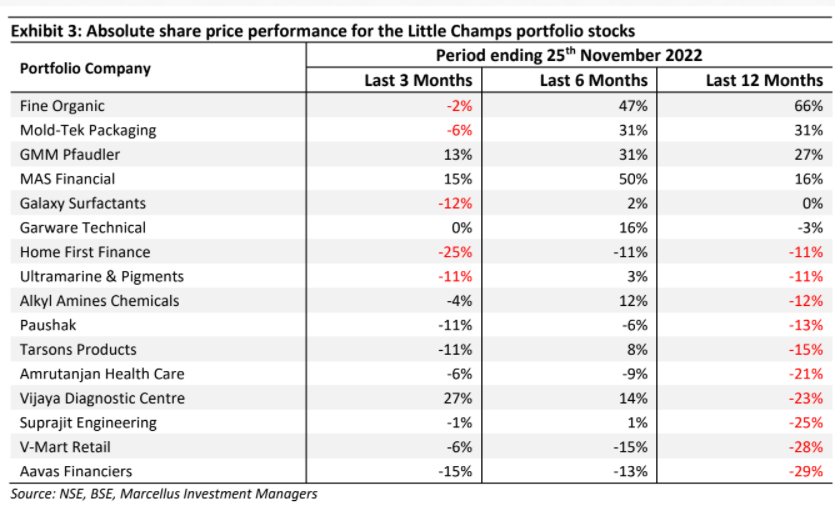
From a 12 months’ perspective, portfolio companies which have seen the sharpest drawdown (>15%) in share prices are Aavas, V-Mart, Suprajit, Vijaya Diagnostics, Amrutanjan and Tarsons. Of these, we added Vijaya Diagnostics to the portfolio in the month of August 2022. Since then, as can be seen above, the stock has delivered positive returns. In the remainder of this note, we try to address the concerns in the Indian stockmarket around the remaining five portfolio stocks.
▪ Stock #1: Suprajit Engineering
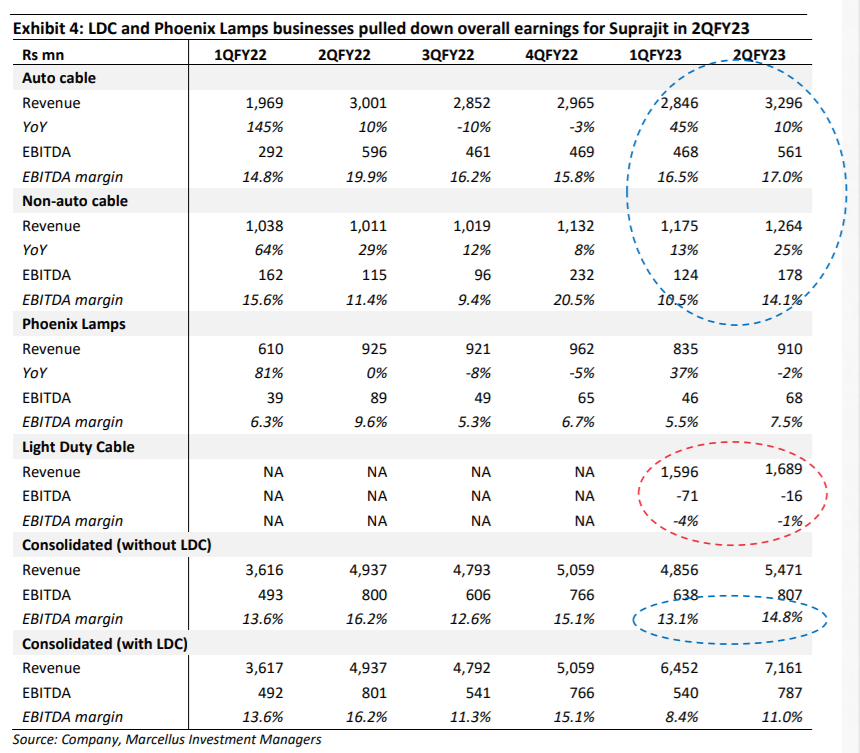
Suprajit reported 45% YoY growth in consolidated revenues (helped by consolidation of the acquired Light Duty Cable (LDC) business from 1QFY23). However, the firm’s EBITDA margin declined sharply from 16.2% in 2QFY22 to 11.0% in 2QFY23. As a result, net earnings declined by 15% YoY.
Our take: Suprajit’s 2QFY23 results were negatively impacted due to the following factors: – Challenges surrounding the LDC auto cable business acquired by Suprajit from Kongsberg in April 2022. Some of the issues faced particularly by its Hungarian plant are high energy costs, significant depreciation in the Hungarian Forint which impacts Suprajit due to the imports of raw material into Hungary and the lag in passing this cost inflation on to customers.
– Similarly, the Phoenix Lamps divisions (which makes halogen lamps for the Indian and European aftermarket) saw margins are impacted due to significant increase in some of its raw material costs.
Thankfully, both of these business headwinds for Suprajit seems to be abating with LDC’s EBITDA loss coming off sharply between 1QFY23 and 2QFY23. Furthermore, the prices of key raw materials for Phoenix Lamps have also come off in recent months which should help boost profit margins going forward.
On the other hand, a few positives from Suprajit’s 2Q performance are:
– Legacy core automotive cable business (which includes domestic OEM and aftermarket auto cables and exports from India) continue to perform well (double digit revenue growth with healthy EBITDA margin) despite a soft underlying automotive industry in India and Europe (a key export destination) thanks to market share gains in the aftermarket and in the export business.
– The non-auto cable division continues to show healthy performance (25% YOY revenue growth) on the back of order wins from new customers, new categories and multi-location facilities.
New products from Suprajit’s Tech Centre (STC). Some products which are already in the development/commercialisation phase include digital instrument clusters & braking products. Suprajit has recently commissioned its first plant for digital instrument clusters. These new products could be a potentially big revenue contributor over the next 10 years.
More details on our investment thesis on Suprajit can be read in our Dec’20 note on Suprajit. See https://marcellus.in/newsletter/little-champs/spotlighting-suprajit-engineering/.
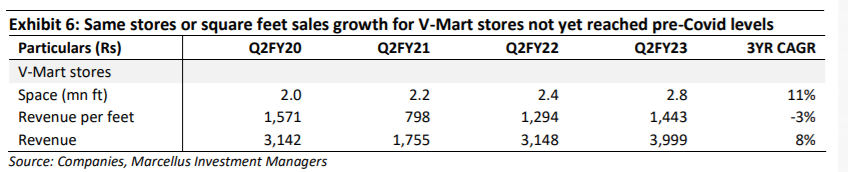
▪ Stock #2: V-Mart Retail
V-Mart reported healthy headline numbers in 2QFY23 with growth of 50% YoY growth in revenue and 160% in EBITDA. However, the sharp YoY increase in revenues/EBITDA can be attributed to the acquisition of Unlimited brand of stores (accounted for in V-Mart’s financials from 2QFY22). Furthermore, due to seasonality (2Q being one of the weaker quarters) and high fixed costs (including depreciation) in the business, V-Mart reported a PBT level loss of Rs16 crores (adjusted for Ind AS 116 the profit would be Rs 11cr for Q2FY23).
Beyond the headline numbers, a key disappointment for us in V-Mart has been slower than expected recovery in the sales per square feet (or same store sales growth) for V-Mart stores (excluding the Unlimited brand of stores). For instance, the 2QFY23 sales per square feet for V-Mart stores was still down about 8% compared to pre-Covid 2QFY20 numbers.
Our take: One of the key reasons for this sluggishness in revenue is the significant increase pushed through by V-Mart in the clothes it sells to account for the increase in the raw material (particularly cotton) prices. V-Mart’s average selling price rose from Rs302 per piece in 2QFY22 to Rs376 in 2QFY23 i.e. an increase of nearly 24%. Besides the increase in the price of clothes, V-Mart’s typical consumer belongs to the bottom of the pyramid and is feeling the pinch of generalised price inflation. However, in recent months, as cotton prices have come off sharply, V-Mart has passed on the benefits by cutting prices by more than 25%. This we believe should help drive a recovery in V-Mart’s same store sales.
In addition, there are positives emerging for V-Mart:
– Unlimited stores (accounted for 21% of revenues in 2QFY23) witnessed 15-16% growth over last year and has reached above pre-covid levels. This implies the business has witnessed improvement since being taken over by V-Mart for a consideration of Rs 150 crores (initial outlay) on 22-Jul-21.
– V-Mart continues opening stores at a healthy rate with 31 net store additions (V-Mart only) in the last 12 months. Total store count (excluding Unlimited) now stands at 326.
– The Company recently acquired Lime Road, an online market platform for value fashion, for a total consideration of Rs67 crores (gross of assumed liabilities the net cash consideration is Rs53 crores). This is expected to augment’s V-Mart online capabilities, an area where V-Mart has been lacking.
More details on our investment thesis on V-Mart can be found in our Oct’20 note. See: https://marcellus.in/newsletter/little-champs/spotlighting-v-mart-retail/
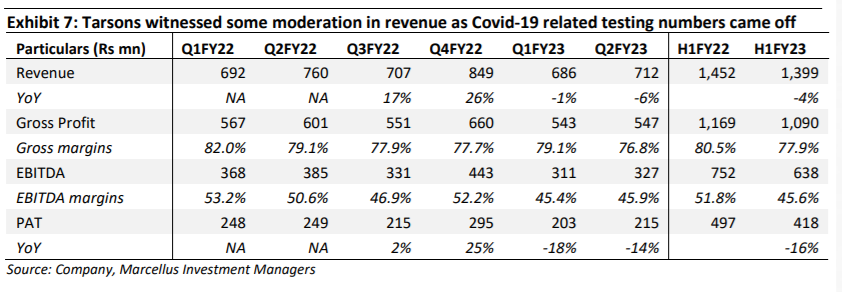
▪ Stock #3: Tarsons Products
In H1FY23, Tarsons’ domestic revenue was down by 10% YoY while exports increased by 13% YoY. As a result, overall revenue was down by 4% YoY. Similarly, Gross profit and EBITDA are down by 7% YoY and 15% YoY, respectively. In H1FY22, Tarsons’ revenues had benefited from a spike in Covid testing (due to the second Covid wave in India). Out of the total revenue of Rs145 crores in H1FY22, approximately Rs.35- 40 crores is from selling Covid related products. In contrast, in H1FY23, Covid related revenue was negligible.
Our take:
– Whilst Covid revenues are non-recurring in nature, in the more enduring non-covid segment, Tarsons’ revenue increased by a healthy rate of ~25-30% suggesting strong market share gains. Furthermore, our on-ground channel checks with distributors, customers, sales officers suggest that Tarsons’ competitors are witnessing a steeper decline in revenue.
– On the margins front, EBITDA margins are down by 618bps mainly because of the increase in raw material prices, high freight rates and increase in packaging cost. Additionally, employee cost is up by 12% YoY in H1FY23 because Tarsons is strengthening its senior management team and has recruited people in sales department, production department, etc. To pass on these costs, company has already taken price hikes of 7% in its domestic business, the full benefit of which will be realised in the following quarter.
– Post launching its PCR (polymerase chain reaction) range of products, company has received good response from customers. Currently, many of its customers are testing the products with dispatches having started to a few of them.
– With its new Panchla facility slated to come online by Q2FY24, the company will be entering the Cell Culture product segment. Response in the PCR segment and Tarsons’ success in the Liquid Handling segment gives us confidence of the success in the Cell Culture segment.
– Additionally, the company’s fulfilment and sterilisation centre will also be coming online by Q2FY24. Having a centralised warehouse centre should help the company reduce its inventory. Similarly having an in-house sterilisation centre will help to reduce costs.
More details on our investment thesis on Tarsons Products can be found in April’22 note. See https://marcellus.in/newsletter/little-champs/spotlighting-tarsons-products/
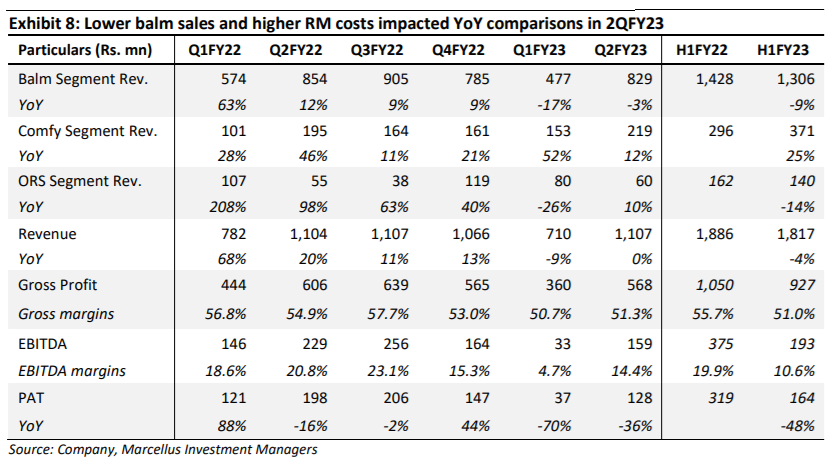
▪ Stock #4: Amrutanjan Healthcare
Amrutanjan’s 2QFY23 performance witnessed a stark improvement on a QoQ basis. However, on YoY basis, revenue and earnings are lower with Revenues flat YoY but EBITDA down by 31%.
Our take:
– Balm Segment: During Covid, Balm sales had shot up because of higher usage (Eg. people used balm while taking steam). With Covid gone, balm sales have declined by 3% YoY in Q2FY23. However, a silver lining has emerged – Amrutanjan’s H1FY23 balm revenues declined by only 9% YoY whereas Zandu’s sales declined by 21% YoY.
– Comfy Segment: Amrutanjan continues to perform well in the Sanitary Napkin segment with revenue growth of 12% in Q2FY23 and 25% in H1FY23. Amrutanjan has introduced new products like XL Value Packs, Tampons, Period Cups and Period Pain Roll-On (PPRO) to further drive the growth for this business.
ORSSegment: Similar to the Balm segment, ORS (Oral Rehydration Solutions) sales were higher during Covid as it was consumed as an immunity booster. Nonetheless, performance has improved in Q2F23 where sales of this segment are again on an uptrend and up by 10% YoY in Q2FY23.
– On the profitability front, Gross margins have declined by 361bps in Q2FY23. This is mainly because of increase in the prices of certain raw materials, increase in packing material prices and change in product mix (Comfy sales have grown whereas Balm sales have declined; Comfy has lower gross margins). The Company has taken price hikes across product segments to cover the rise.
– EBITDA margins have declined by 640bps YoY in Q2FY23 which is mainly due to decline in gross margins and increase in travel related costs which were suppressed last year due to on-going lockdowns. The Company has begun to control these costs by employing various reengineering process and by also reducing sales head count where need be.
More details on our investment thesis on Amrutanjan Healthcare can be found in April’21 note. See https://marcellus.in/newsletter/little-champs/spotlighting-amrutanjan-healthcare/
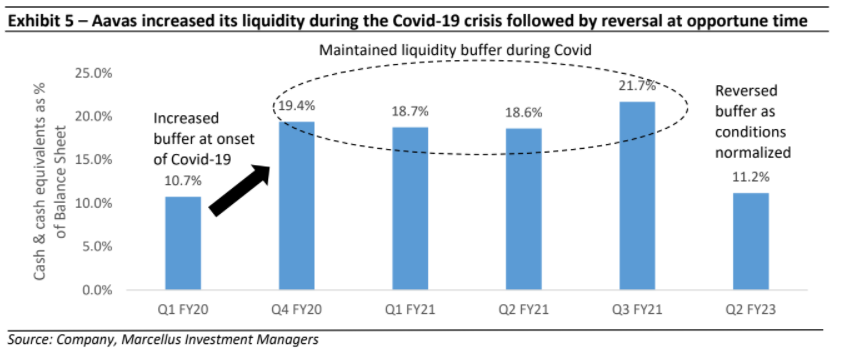
▪ Stock #5: Aavas Financiers
Aavas witnessed Total Net Income growth of 21.1% YoY in 2QFY23 led by YoY AUM growth (September 2022-end AUM up by 23.6% vs September 2021-end) and healthy spread of 5.86% for the quarter (higher by 13bps YoY). However operating expenses continued to remain elevated rising 33% YoY resulting in somewhat muted growth of 16% in net earnings.
The key reason for higher operating expenses has been continuous investments in the franchise – largely stemming from investments in talent, technology and continuous branch additions. With customer service, TAT (turn-around time) and increase in demand, the Company continues to invest in technology, to setup better controls and scale systems.
We appreciate Aavas’ decision to invest more in the franchise (this is an opportune time since they are currently earning extraordinarily high spreads) and thereby build distinct capabilities ahead of the time which will support company in scaling up the business. We expect costs to remain elevated for the next 15- 18 months as many projects reach completion. Following this time period, we expect to see the investments bearing fruit thus driving earnings acceleration.
Another concern around Aavas Financiers appears to be narrowing of spreads for NBFCs in a rising interest rate environment. For Aavas, the fixed rate loan book is backed by fixed rate liabilities and its
shareholders’ equity, whereas the lender’s floating rate assets are backed by floating rate liabilities. In the event of floating rate liabilities getting repriced (due to rising interest rates), the floating nature of the loan book (~57% of the assets) means that they too can be repriced accordingly. This would allow spreads to revert to the mean, albeit with a slight lag. In fact, the management has shown evidence of being agile and has already raised its prime lending rate by an aggregate of 125 bps since the time RBI started raising repo rates.
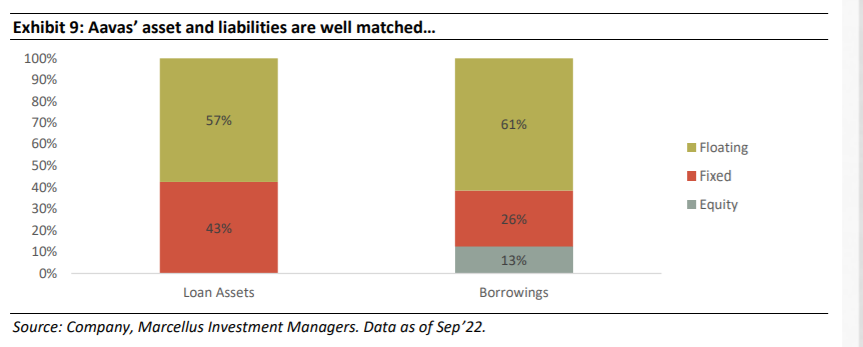
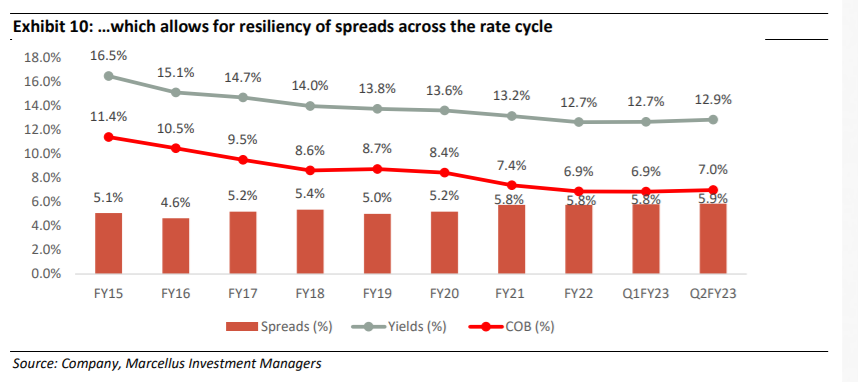
Moreover, over the last eight years, Aavas’ spreads have consistently remained upwards of 5% as the matched loan book and liability composition (fixed vs. floating) allows for resilience across the rate cycles. While there may be quarter-to-quarter volatility in spreads, over longer time horizons, we expect Aavas’ spreads to remain over 5%+.
In summary, we continue to have high visibility on the Little Champs’ ability to compound your wealth at a healthy clip in the ongoing economic recovery.

