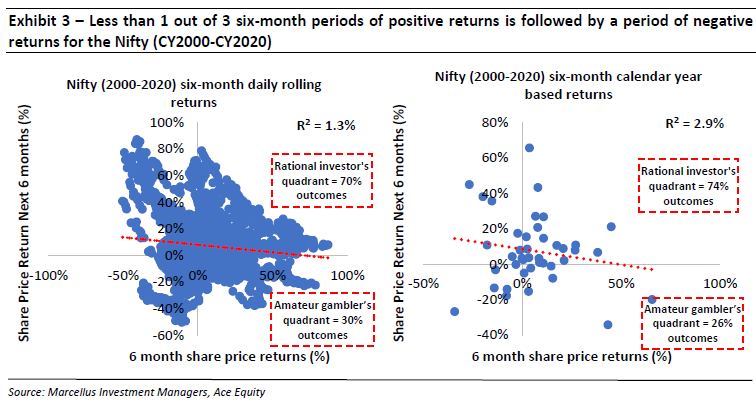
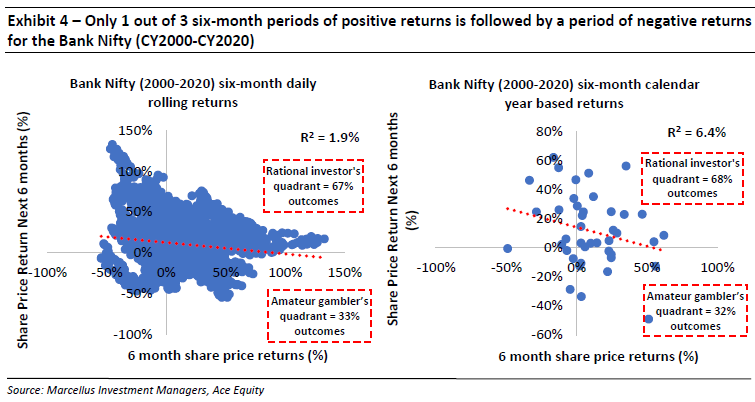
Many investors erroneously believe that because the markets have run up in the past few months, the probability of the markets delivering negative returns in the future is now higher. The past twenty-one years (2000-2020) of data suggests that there is no significant correlation between returns delivered in the previous six months and the next six months by the Nifty (R-squared of 1.3%) or the Bank Nifty (R-squared of 1.9%). In fact, the data shows that an investor who bets (by not investing) on the Bank Nifty delivering a negative return over the next 6 months because it had delivered a positive return over the previous six months only has a 33% chance of being right. The investor’s odds fall further to 26% when the Bank Nifty has delivered a return of greater than 45% over the previous 6 months (similar to Bank Nifty’s 46% returns during 1st July, 2020 to 31st Dec, 2020), as the Bank Nifty has then gone on to deliver a positive return in the next six months in 74% of cases! On the other hand, consider a smart albeit unlucky investor who invests in an equal weighted portfolio of five Kings of Capital stocks every time the Nifty hits an all-time high. However, even with such ostensible misfortune of timing, data since CY2000 shows that the median 5-year returns for such an investor end up being 26% on a CAGR basis!
Performance update of the live fund
The key objective of our “Kings of Capital” strategy is to own a portfolio of 10 to 14 high quality financial companies (banks, NBFCs, life insurers, general insurers, asset managers, brokers) that have good corporate governance, prudent capital allocation skills and high barriers to entry. By owning these high-quality financial companies, we intend to benefit from the consolidation in the lending sector and the financialization of household savings over the next decade. The latest performance of our PMS is shown in the chart below.
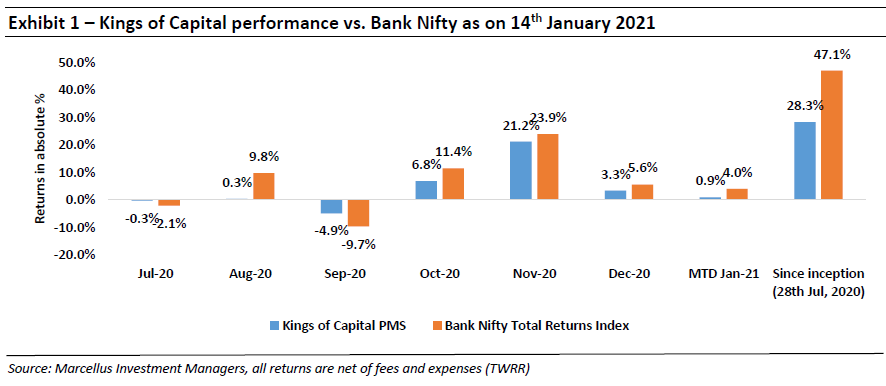
Under the TWRR method of calculating portfolio performance the initial performance looks optically lower in an upward trending market because of large inflows on a relatively small AUM. As on 14th Jan, the first customer of the Kings of Capital PMS had generated returns of 32.3% vs 47.1% for the Bank Nifty since inception.
As the broader markets and most stocks have rallied over the past few months, we have received questions around “Whether this is the right time to invest given that the markets are trading at an all-time high” or “Will investors still be able to make decent returns over the next few years or is it too late to enter?”. We try and answer these questions around investing when markets are at an all-time high in this newsletter.
The last 21 years of data clearly shows that investors should avoid the Gambler’s Fallacy by investing/ staying invested irrespective of how well markets have performed in the recent past.
The Gambler’s Fallacy is the name given to the phenomenon where the gambler misunderstands probabilities basis the limited set of outcomes he has seen over the course of whatever game he’s playing. Basis this incorrect estimation of odds, he then gambles incorrectly and thus suffers financially. A simple example of this is a game of coin toss – if after losing ten rounds in a row, the gambler walks away from playing the eleventh round even though he’s being offered more than 50:50 odds, you and I know that the gambler is being irrational. If the coin is a fair coin, the gambler’s odds of winning the eleventh round is 50% and therefore he should take the bet if the odds being offered are better than 50:50. Unfortunately, for many such gamblers, after losing ten rounds in a row, they start believing that the probability of winning is much lower than 50% because “luck is not working out” in their favour. We routinely see such irrational behaviour by investors in the stock market based on a flawed understanding of probabilities. So, let’s start by understanding probabilities correctly basis the last 21 years of data.
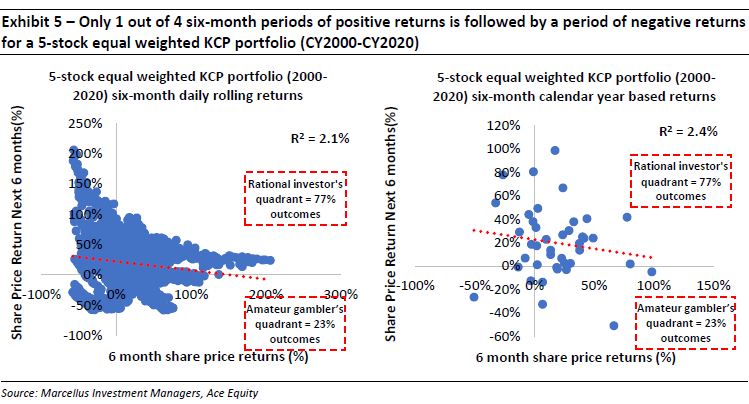
To calculate the correlation of returns between one period and the next, we have plotted absolute returns (in %) of a six-month period on the x-axis (horizontal axis) and the returns of the next six-month period on the y-axis (vertical axis) in Exhibits 3, 4 and 5. This has been done for the CY2000-CY2020 period on a calendar year basis i.e. for 41 observations as well as on a daily rolling basis i.e. for 4,979 observations. Apart from the Nifty and the Bank Nifty, these observations have also been plotted for a portfolio of KCP stocks. To avoid any selection bias, we created an equal weighted portfolio of all KCP stocks which have been listed since 1st Jan, 2000. The equal weighted portfolio for Exhibits 2 and 5 therefore consists of HDFC Bank, Kotak Bank, Bajaj Finance, Axis Bank and City Union Bank.
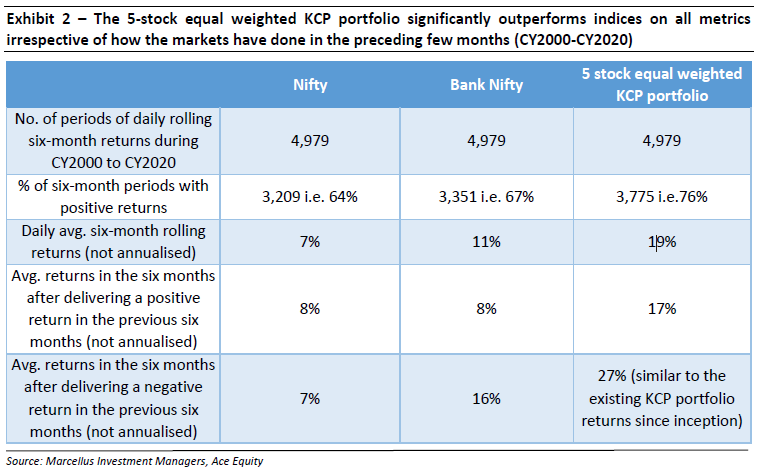
- No significant correlation between returns of one six-month period and the next: As illustrated in Exhibits 3, 4 and 5 below, data from CY2000 to CY2020 suggests that there is no significant correlation between returns from one six-month period to the next six-month period either for the Nifty (R2=1.3%), the Bank Nifty (R2=1.9%) or an equal weighted portfolio of five KCP stocks (R2=2.1%).
- Odds of a six-month period of positive returns being followed by a six-month period of negative returns are 33% or lower: While many investors believe that a six-month period of positive returns is likely to be followed by a six-month period of negative returns (denoted by the ‘amateur gambler’s quadrant’ in Exhibits 3, 4 and 5), data suggests that the odds of this happening are only about 33% for the Nifty and Bank Nifty and only about 25% for an equal weighted 5 stock portfolio of KCP stocks. As equity markets are upward trending in nature in the long run, unlike a gambler betting on a coin toss, the odds remain in favour of an investor betting on the fact that equity markets will deliver a positive return in any given period irrespective of the returns in the previous period.
- A six-month period of high returns has been usually followed by another six-month period of positive returns: During the six months ending 31st Dec, 2020, the Nifty and Bank Nifty have delivered an absolute return of 36% and 46% respectively. The Nifty, Bank Nifty and 5 stock KCP portfolio have in the past delivered a 45% or higher six month return in 4%, 8% and 15% of the 4,979 rolling six-month observations during CY2000 to CY2020. After delivering a 45% or higher return in the preceding six months, the Nifty, Bank Nifty and 5 stock KCP portfolio have delivered an average return of 3%, 9% and 15% respectively in the next six months and a positive return in the next six months in 71%, 74% and 70% cases respectively.
Investing in KCP stocks at all-time highs
Hitting all-time highs is not a rare occurrence for KCP stocks: During CY2000-CY2020, an equal weighted portfolio of 5 KCP stocks has hit an all-time high in 49 of the 84 quarters i.e. in 58% cases. On the other hand, the Nifty has hit an all-time high in only 29 of the 84 quarters i.e. in 35% cases. Because KCP stocks hit an all-time high in about 3 out of every 5 quarters, it is difficult for an investor to time his investment such that KCP stocks are not at an all-time high.
Investing in KCP stocks even at all-time highs delivers healthy returns: The Nifty has hit an all-time high on 246 instances during CY2000-CY2015. As illustrated in Exhibit 6 below, assuming an investor invested in an equal weighted 5 stock KCP portfolio on each of these 246 instances i.e. every time the Nifty hits an all-time high, the 5-year median CAGR returns for such an investor would have been 26% vs. 15% for the Bank Nifty. Further, the portfolio delivers a greater than 15% CAGR return in 98% cases vs. only 53% cases for the Bank Nifty.
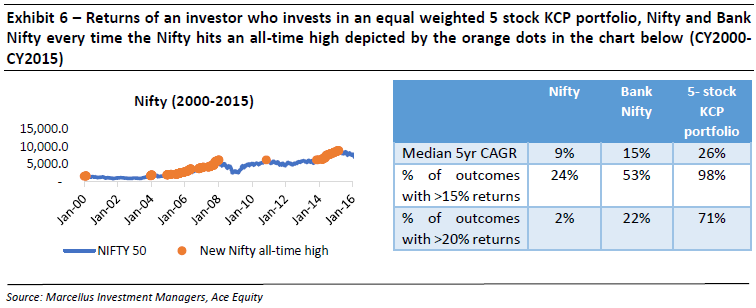
Investments made at all-time highs during CY2010-CY2015 delivered better returns than investments made at all-time highs during CY2000-CY2010: Many investors have the apprehension that the returns in Exhibit 6 above look good because the likes of HDFC Bank, Kotak Bank, Axis Bank delivered healthy returns during their initial years as they were growing off a small base. However, an investment in the equal weighted 5 stock KCP portfolio every time the Nifty hit an all-time high during CY2010-CY2015 delivered a 5-year median CAGR return of 33% vs. a 5-year median CAGR return of 23% when the investment was made at all time Nifty highs during CY2000-CY2010.
Note: HDFC Bank, Kotak Bank, Bajaj Finance, Axis Bank and City Union Bank are a part of most Marcellus’ portfolios.
If you want to read our other published material, please visit https://marcellus.in/blog/
Note: the above material is neither investment research, nor investment advice. Marcellus does not seek payment for or business from this publication in any shape or form. Marcellus Investment Managers is regulated by the Securities and Exchange Board of India as a provider of Portfolio Management Services and as an Investment Advisor. The performance related information provided herein is not verified by SEBI.
Copyright © 2020 Marcellus Investment Managers Pvt Ltd, All rights reserved.

