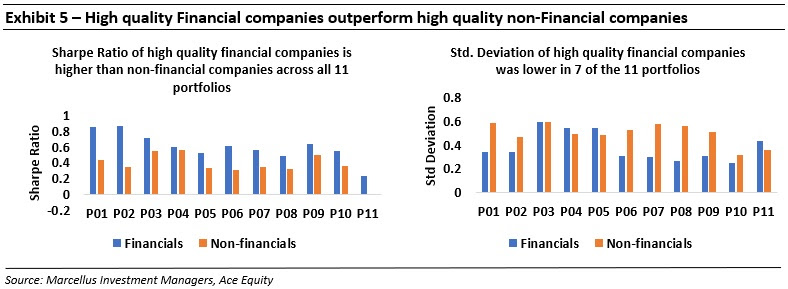
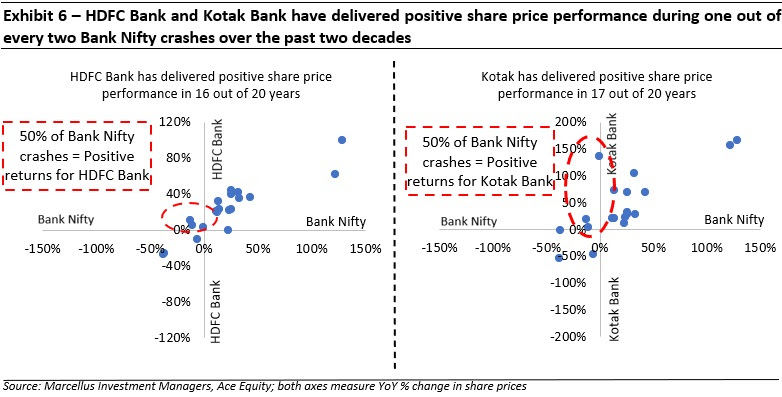
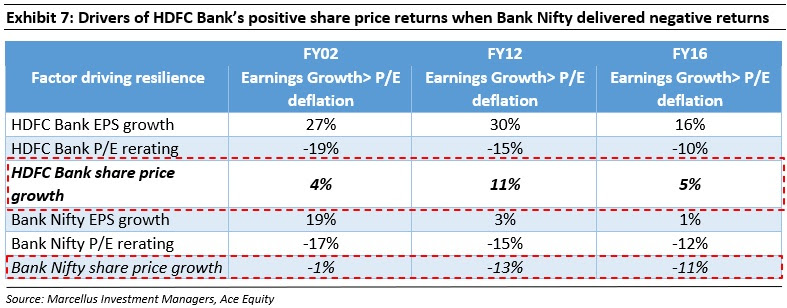
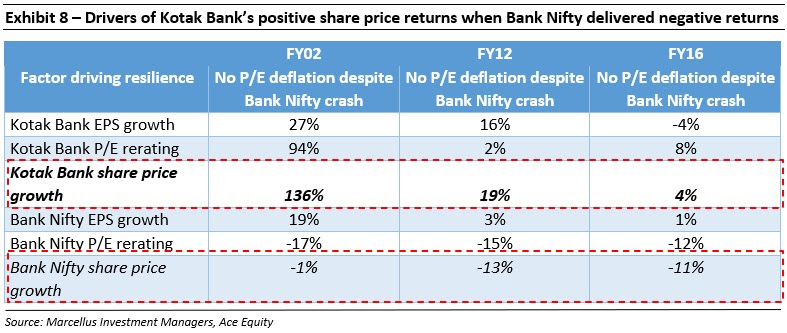
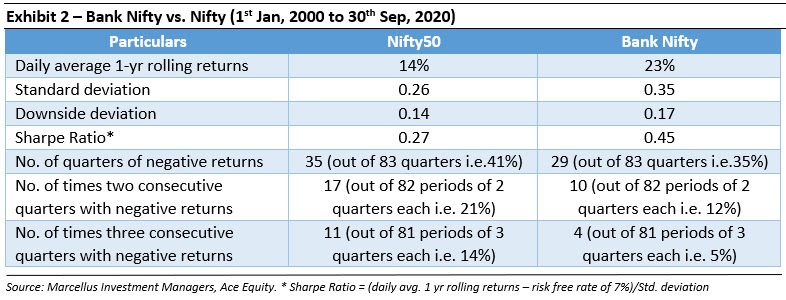
In this newsletter we illustrate why investing in Indian Financial Services stocks is highly rewarding for long term investors not only in terms of absolute returns but also in terms of risk adjusted returns. The data over the past two decades suggests that: (i) the Bank Nifty has delivered far higher absolute returns than the Nifty (23% vs 14%); (ii) Investors in Financial Services stocks are more than compensated for higher volatility as the Bank Nifty has delivered over 60% higher returns per unit of risk (Sharpe Ratio of the Bank Nifty over the past two decades is 0.45 versus 0.27 for the Nifty); (iii) high quality Financial Services stocks have delivered better risk adjusted returns than high quality non-Financial stocks across all time periods; and (iv) high quality Financial Services stocks such as HDFC Bank and Kotak Bank have delivered positive returns in one out of every two market crashes even when the Bank Nifty has delivered negative returns.
Performance update of live fund
The key objective of our “Kings of Capital” strategy is to own a portfolio of 10 to 14 high quality financial companies (banks, NBFCs, life insurers, general insurers, asset managers, brokers) that have good corporate governance, prudent capital allocation skills and high barriers to entry. By owning these high-quality financial companies, we intend to benefit from the consolidation in the lending sector and the financialization of household savings over the next decade. The latest performance of our PMS is shown in the chart below.
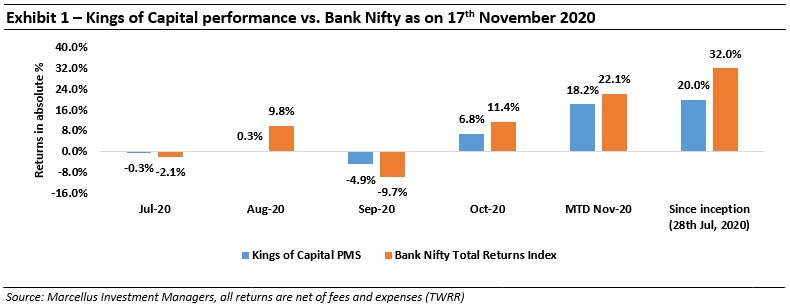
Under the TWRR method of calculating portfolio performance the initial performance looks optically lower in an upward trending market because of large inflows on a relatively small AUM. As on 17th Nov, the first customer of the Kings of Capital PMS had generated returns of 23.6% vs 32.0% for the Bank Nifty since inception.
At Marcellus we don’t believe in timing the market and hence deploy the money into our strategies as soon as the investor transfers the funds to us. However, we do recognize the emotional aspect of loss aversion in the short term and have launched a STP (Systematic Transfer Plan) plan using which clients can stagger their investment in tranches spread over 5 months. For more details please refer to our FAQs here.
The most frequently asked question that we have been asked since we launched the Kings of Capital PMS earlier in July this year is “Why invest in a portfolio which invests only in the Indian Financial Services sector?” or “Won’t a portfolio of only Financial Services companies be far more volatile than other portfolios?” We try and answer both questions in this newsletter.
Busting some myths around India’s Financial Services sector
-
Bank Nifty has outperformed the Nifty by a massive 9% per annum over the past twenty years:
As illustrated in Exhibit 2 above, over the past twenty years the Bank Nifty has outperformed the Nifty by a massive 9% CAGR. We have calculated this return on a daily rolling 1-year period basis so as to remove any bias due to beginning and ending of the period values. However, even if we were to calculate the returns on a CAGR basis, the Bank Nifty has delivered a 16% CAGR versus a 10% CAGR for the Nifty during the same period. The results are similar or even more favourable for the Bank Nifty if we were to take 3 year or 5 year rolling returns.
-
Risk adjusted returns of the Bank Nifty are over 60% higher than the Nifty:
Many investors believe that investing in Financial Services stocks is riskier than investing in other sectors. As shown in Exhibit 2, the Sharpe Ratio of the Bank Nifty over the Mar, 2000 to Sep, 2020 period is 0.45 versus 0.27 for the Nifty i.e. the Bank Nifty has delivered over 60% higher returns per unit of risk taken.
-
The real volatility of Financial stocks is not very different from the volatility of the broader index:
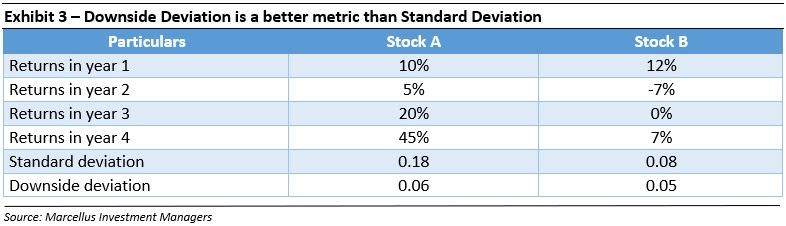
A drawback of the standard deviation calculation is that it gives an equal weight to downside and upside volatility. To illustrate this by way of an example, let’s compare the standard deviation of stock A and stock B below. As illustrated in Exhibit 3 below, Stock A has a standard deviation almost twice that of stock B because standard deviation penalizes downside and upside volatility equally. To overcome this drawback, we calculate the downside standard deviation which ignores the ‘good volatility’ and instead focuses only on the downside returns. As a result, the downside deviation of Stock A and Stock B is similar.
|
|
Applying the same principle to compare the volatility of the Bank Nifty with the Nifty, we see that while the standard deviation of the Bank Nifty is higher than the Nifty, their downside deviation is similar. In addition to this, as illustrated in Exhibit 2 above, the number of quarters where the Bank Nifty has delivered negative returns are lower than the Nifty and the number of times the Bank Nifty has delivered three consecutive quarters of negative returns is less than half that of the Nifty.
-
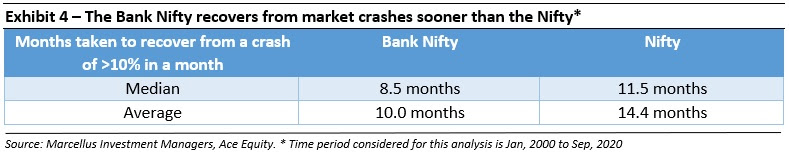
The Bank Nifty recovers from market crashes sooner than the Nifty:
While public memory is short and during the Covid-19 crisis, the broader markets have recovered more quickly than the Bank Nifty, over the past two decades whenever the Bank Nifty has seen a drawdown of 10% or greater in a month, it has on average taken 10 months to recover versus 14 months for the Nifty. |
|