Marcellus’ Global Compounders Portfolio (GCP) strategically invests in 25-30 deeply moated global companies aligned with megatrends, fostering a consistent mid to high teens compounding of free cash flow/earnings. This portfolio is agnostic to market cap or sectors, and targets to deliver excess return through different periods in the cycle. As India catapults into the most formidable economies in the world, Indians are getting wealthier and more connected to the rest of the world. Hence, they need to have portfolios which benefit from global megatrends AND diversify their asset base to cater to future forex liabilities. As we see incremental positive measures being taken to smoothen the journey of an Indian investor to global investing, the global market is also going through some interesting developments – which we address in this newsletter.
Permissible Accredited Investors* can now invests in GCP Strategy with minimum ticket size USD 25,000.
*Accredited Investors shall qualify eligible criteria as defined under IFSCA-IF-10PR/1/2023-Capital Markets dated January 25, 2024.
For non-accredited investors, Investment in Marcellus’ GCP is through Separately Managed Accounts (i.e., SMAs, just like a PMS) via GIFT City (regulated by IFSCA) with a minimum investment amount of USD 150,000.
Latest regulatory changes pertaining to Global Investment:
· For Resident Indian investors, Long Term Capital Gains (LTCG) on global equities reduced to 12.5% in recent budget Vs 20% (with indexation benefit) earlier
· Salaried personnel investing in GCP can now set off the TCS paid (at the time of LRS transaction) against TDS to be deducted on salaries
· Resident Indians can now open a ‘Foreign Currency Account (FCA)’ in IFSC and can use the funds for any current or capital account transactions in other foreign jurisdictions (outside IFSCs)
· IFSCA issued consultation paper on 5th August 2024 which proposed to reduce minimum investment amount in GIFT PMS to be USD 75,000.
These recent changes, which simplify and align long-term capital gains tax with domestic equities and allow resident Indians to open foreign bank accounts in GIFT City, significantly reduce friction. We are grateful to the regulators and the finance ministry for these changes.
We dived deeper into these aspects in detail during our recent webinar. Click here to view the webinar.
The case for Global Diversification goes much beyond the need for matching assets with future potential rising USD liabilities for aspirational and affluent India
As investors, we often emphasize CAGR as the key measure of returns, which is reasonable, but it’s crucial to also consider the journey towards achieving that CAGR for long-term wealth creation. Volatility and drawdowns are frequently overlooked in this context. An illustration from our blog (linked here: Are You Benefitting from Double Engine Compounding?) demonstrates this:

Drawing from this blog, if you had started a 50:50 Indo-American portfolio 20 years ago, rebalancing annually to maintain the 50:50 ratio, your risk-adjusted return (return per unit of risk) would have been 1.26, with a CAGR of 14.4% in INR. This outperforms the standalone Nifty50, which had a risk-adjusted return of 0.76 and a CAGR of 14.2%. While the difference in CAGR (14.4% vs 14.2%) appears small, the impact of the higher risk-adjusted return (1.26 vs 0.76) is significant for long-term wealth creation.
To illustrate this further, let’s consider a practical example. Most investors regularly deploy surplus income, whether annually or monthly. We simulated two hypothetical scenarios:
Scenario 1 (India Only): If an investor had invested ₹100 every year starting from 2005 solely in the NIFTY 50, what would their net wealth be by the end of 2023?
Scenario 2 (US and India Combined): If an investor had invested ₹100 every year starting from 2005 in both the NIFTY 50 and S&P 500, rebalancing annually to maintain a 50:50 allocation, what would their net wealth be by the end of 2023?
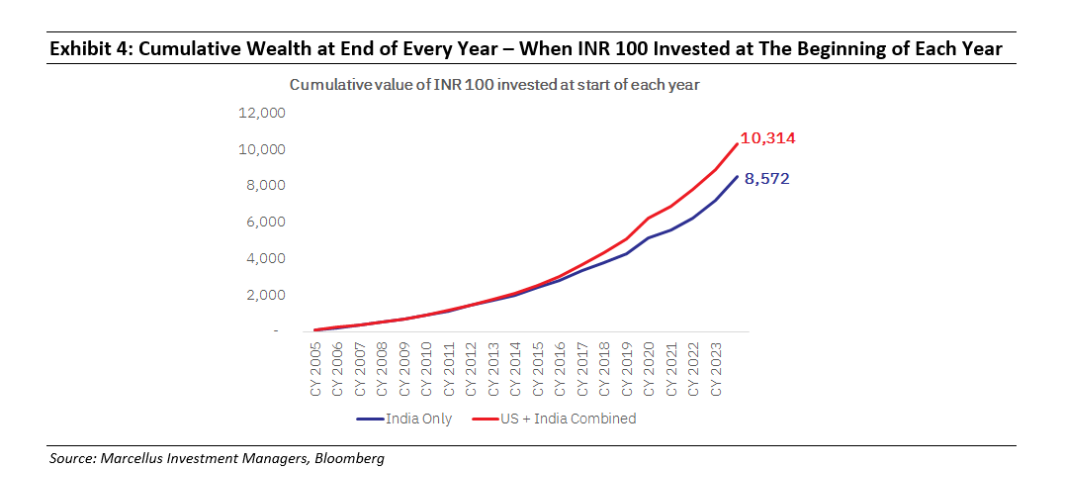
An annually rebalanced 50:50 US and India portfolio (Scenario 2) would have generated ~20% additional wealth. This underscores the importance of considering risk-adjusted returns in wealth-building strategies.
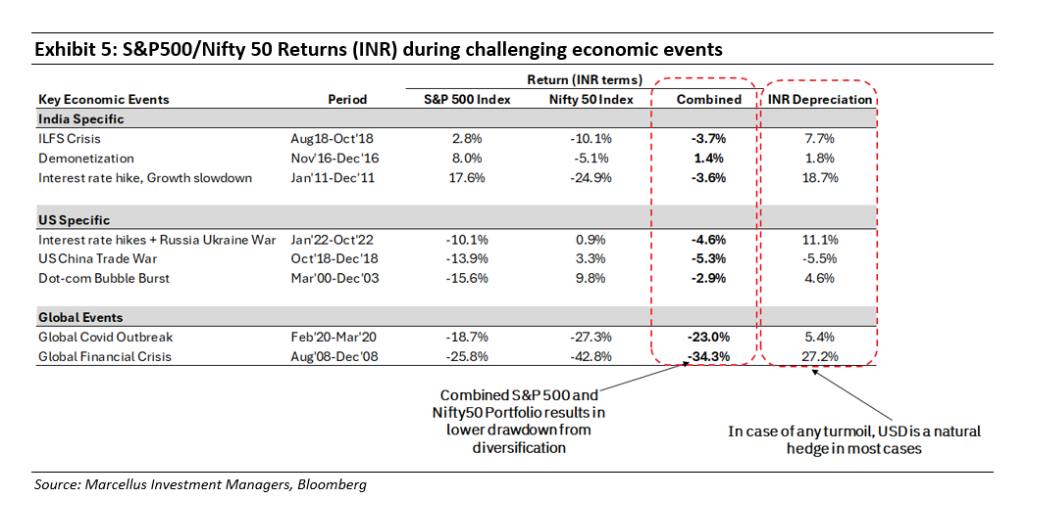
Diversification Benefits Are Most Pronounced in Bear Markets
The benefits of diversification become even more evident during bear markets. Over the past 25 years, a combined US-India portfolio has consistently shown reduced drawdowns during major market downturns in both countries. For Indian investors, USD tends to appreciate against INR during global crises, acting as a natural hedge against macroeconomic volatility.
….As we navigate the ongoing volatility in the stock markets, July and early August of 2024 have been particularly eventful.
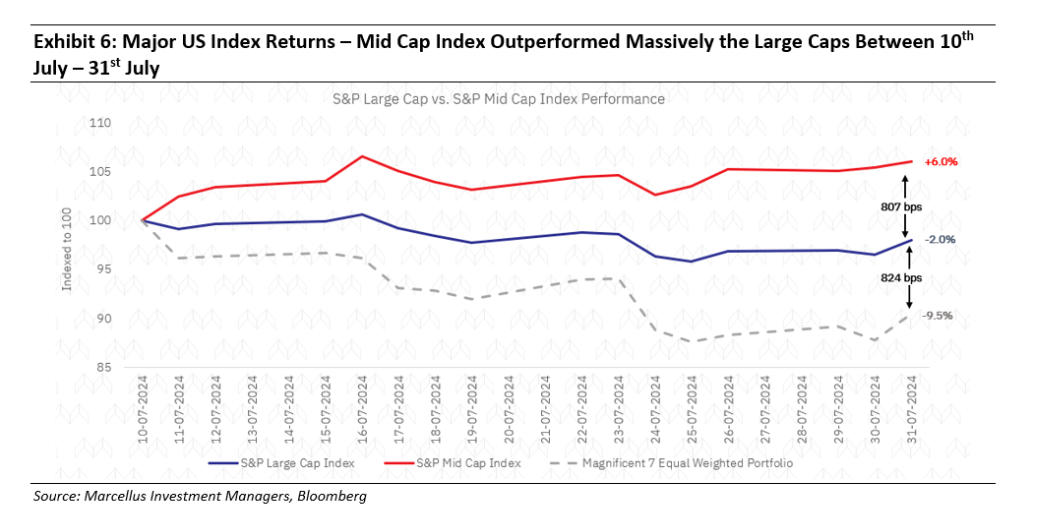
The turbulence kicked off with a “momentum reversal” in the U.S. markets in mid-July, where Megacap stocks experienced a pullback while laggards rallied. This shift led the Russell 2000 (Small Cap) to outperform the S&P 500 by about 12% over just 12 trading days—a rare occurrence over the past 25 years. The market was further shaken by weaker-than-expected U.S. job data, which dampened sentiment, while weak demand from China caused oil prices to dip, even as geopolitical tensions in the Middle East rose. The Federal Reserve’s hint at a potential rate cut in September offered some relief, but the Bank of Japan’s unexpected rate hike disrupted the “yen carry trade.”
The drawdowns linked to weak U.S. job data and the unwinding of the yen carry trade have mostly reversed, thanks to better-than-expected inflation data. The unwinding of the yen carry trade appears to be largely behind us. However, the most significant development was likely the “momentum reversal” between July 10th and July 31st.
Understanding Momentum Reversal: A Key Market Signal
“Momentum Reversal” or “Rotation” occurs when the top-performing stocks of recent times start to lag behind those that have been underperforming. Between July 10th and July 31st, major indexes like the S&P 500 and Nasdaq 100 significantly underperformed compared to the laggard Mid Cap and Small Cap Indexes.
Such extreme events typically follow periods when market leadership is excessively narrow, and there is a significant valuation gap. The following chart shows the percentage of S&P 500 stocks that have outperformed the underlying index based on the past year’s returns—it has never been this low since 1982!
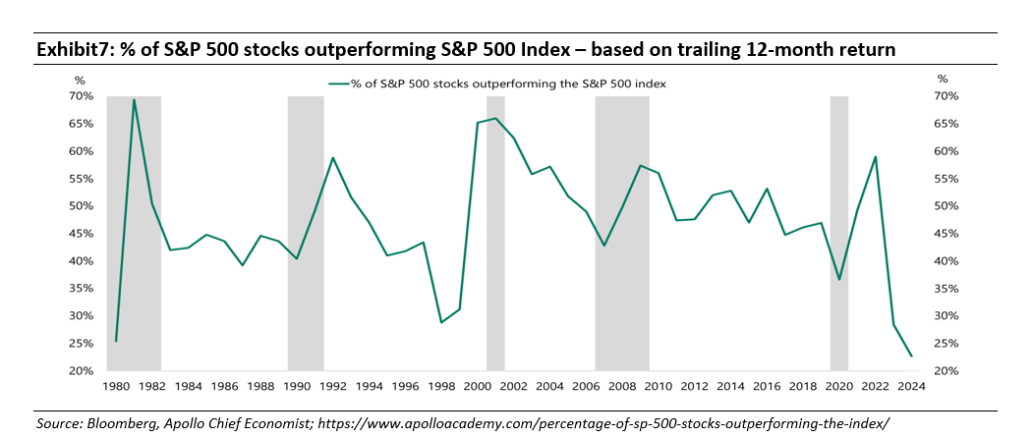
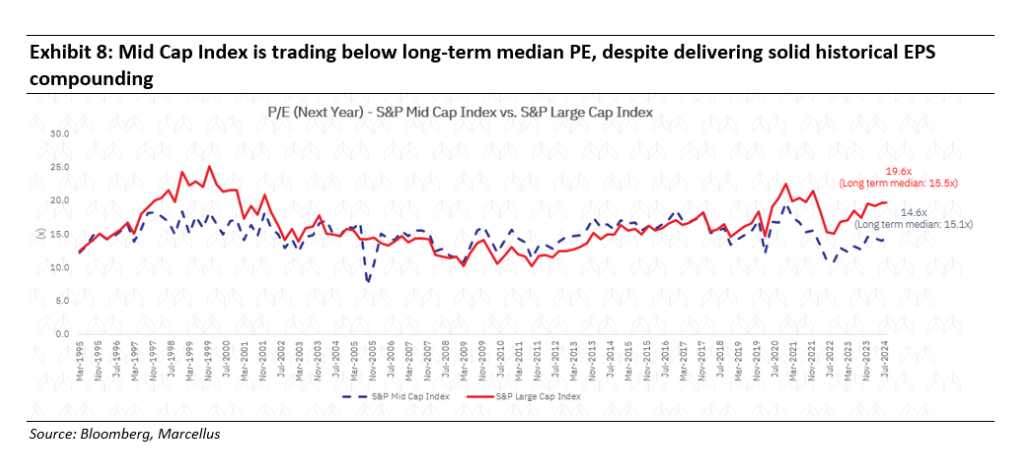
Historically, this kind of extreme concentration in returns does not persist. For example, since we launched in October 2022, 50% of the S&P 500’s total return has come from just seven stocks—the “Magnificent 7.” While it remains to be seen whether we are at a turning point, the current valuation disparities across different market segments are noteworthy.
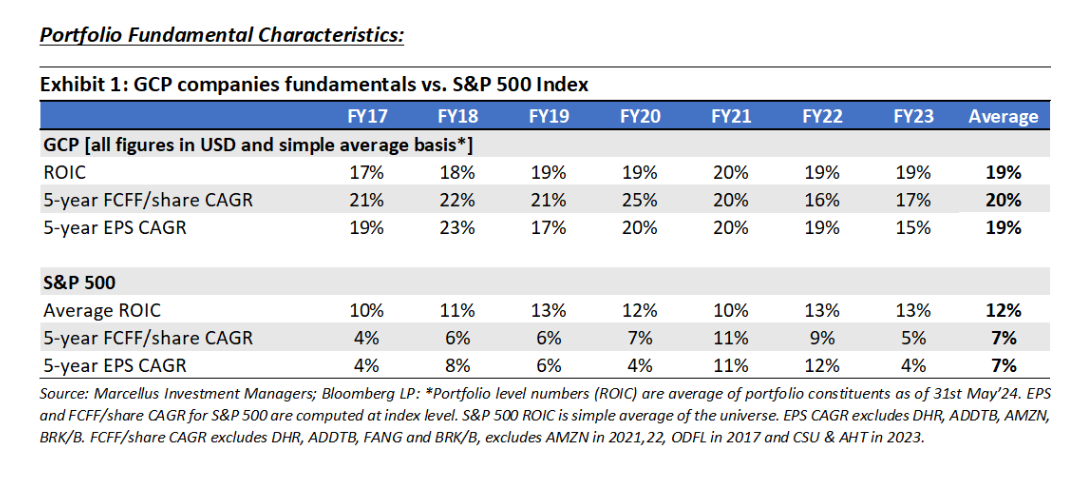
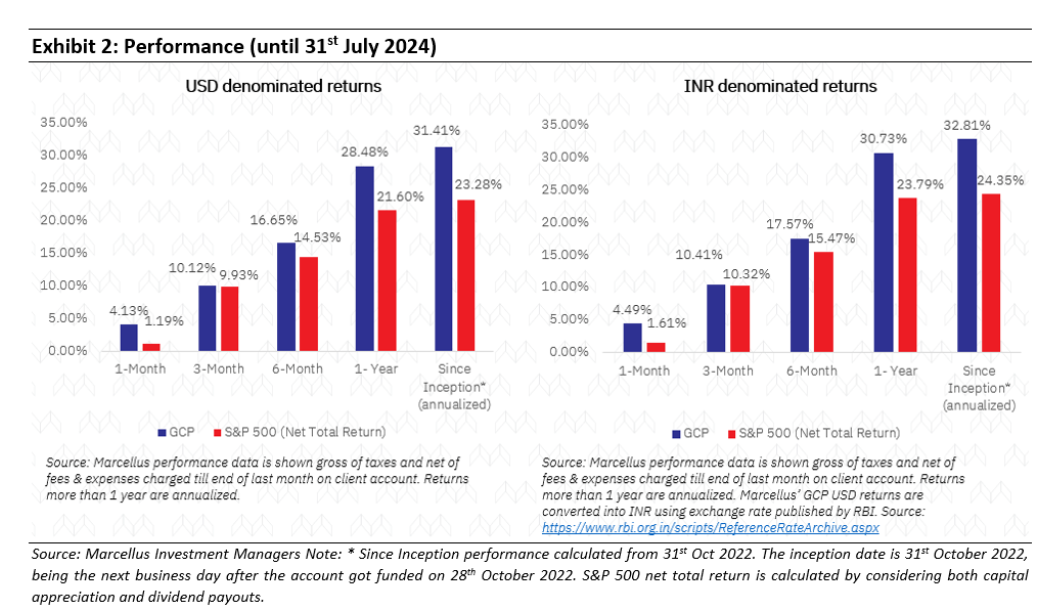
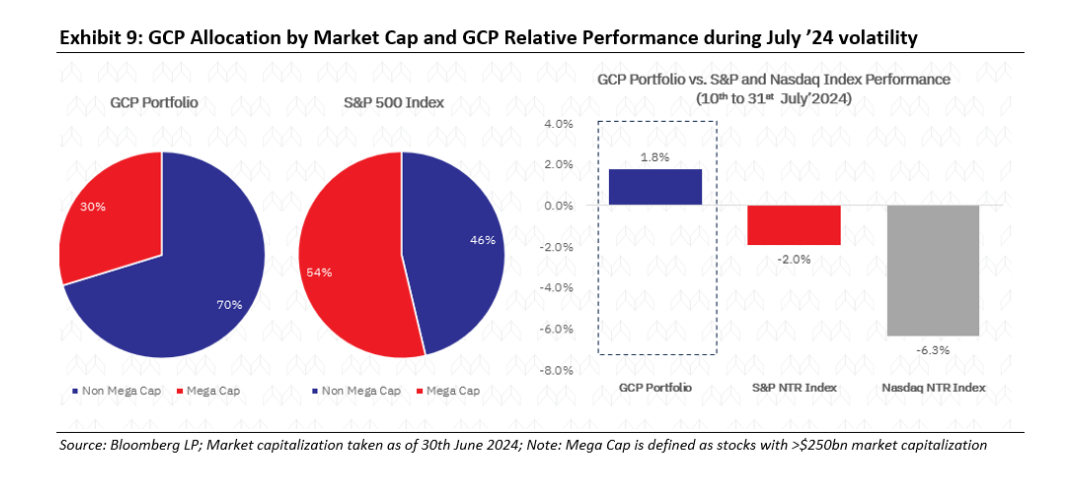
Marcellus’ Global Compounders Portfolio (GCP) is well-positioned to capitalize on a similar outcome. The GCP portfolio’s allocation to Megacaps (Market Cap > $250B) is significantly lower than the benchmark S&P 500. This strategic allocation beyond Megacaps paid off during the July volatility, as GCP outperformed the benchmark by 380 basis points.
At the portfolio level, we have been strategically reducing the relative valuation while maintaining growth rates, positioning GCP favourably with respect to the portfolio PEG ratio.
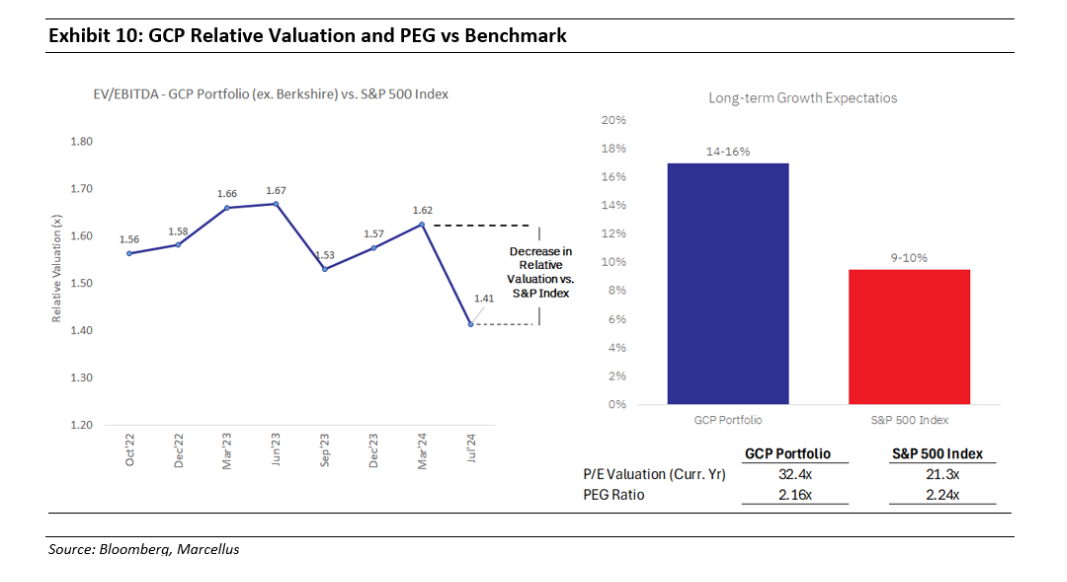
In summary, it’s reassuring to see that the GCP has delivered strong results both in absolute and relative terms since its inception, despite operating in a narrow market and omitting some of the “heavyweights” from its portfolio. The portfolio’s resilience during the volatility of July 2024 further underscores its strength. While the current market turbulence may persist in the coming months due to a series of upcoming events, we remain steadfast in our approach, recognizing that significant opportunities are emerging from this highly polarized market. As Warren Buffet wisely advised, “Look at market fluctuations as your friend rather than your enemy. Profit from folly rather than participate in it.”
Happy Investing!
Regards,
Team Marcellus
If you want to read our other published material, please visit https://marcellus.in/


