Marcellus Investment Managers - One of the Best Portfolio Management Service Companies in India
  • Region
    India USA
  • Our Philosophy
  • Offerings

    Portfolio Management Services (PMS)


    Indian Equities
    Consistent Compounders Rising Giants Little Champs Kings of Capital MeritorQ PMS Curation Portfolio
    Global Equities
    Global Compounders PMS
    Global Equities Fund (Retail)
    Multi Asset
    Multi Asset PMS

    Asset Allocation Services


    Asset Allocation        

    Portfolio Advisory Services


    Indian Equities
    MeritorQ Advisory (Smallcase)        
    Multi Asset
    Aggressive Allocation Balanced Allocation Conservative Allocation
  • Insights

    Newsletters


    Consistent Compounders Kings Of Capital Little Champs Rising Giants Marcellus Erudite MeritorQ PMS Global Compounders

    Insights


    Recents Blogs Newsletters Portfolio Updates 3 Longs and 3 Shorts

    Videos


    Featured Webinars Client Exclusive

    Podcasts


    All MeritorQ Podcasts (English) MeritorQ Podcasts (Hindi)
    Client Exclusive Content

    Others


    Client Exclusive Content Three Longs & Three Shorts Blogs Videos Media Centre
  • Resources
    Support Resources Online Access Guide Marcellus’ Forms UPI Payment
    Disclosure document GIFT City Disclosure PMS Fees Calculator
  • Team
  • PLAN YOUR GOALS
    • Invest Now
      • Portfolio Management Services (PMS)
      • Investment Advisory Services
      • Global Equities Fund (Retail)
  • Subscribe
  • Connect
  • Login
  1. Newsletter
  2. September 2024
Sep 2024 MeritorQ PMS

MeritorQ: CAPE Fear

Published on Sep 07, 2024 · 3 Min Read

In this newsletter, we look at current market valuation levels implied by the cyclically adjusted price to earnings ratio (CAPE). Going by past history, our analysis suggests that at current CAPE levels, Indian investors should be more cautious on forward-looking market returns. Irrespective of market valuation, we believe MeritorQ’s low-risk approach of picking profitable, low-debt and undervalued companies can help preserve and grow investor’s wealth over long term.
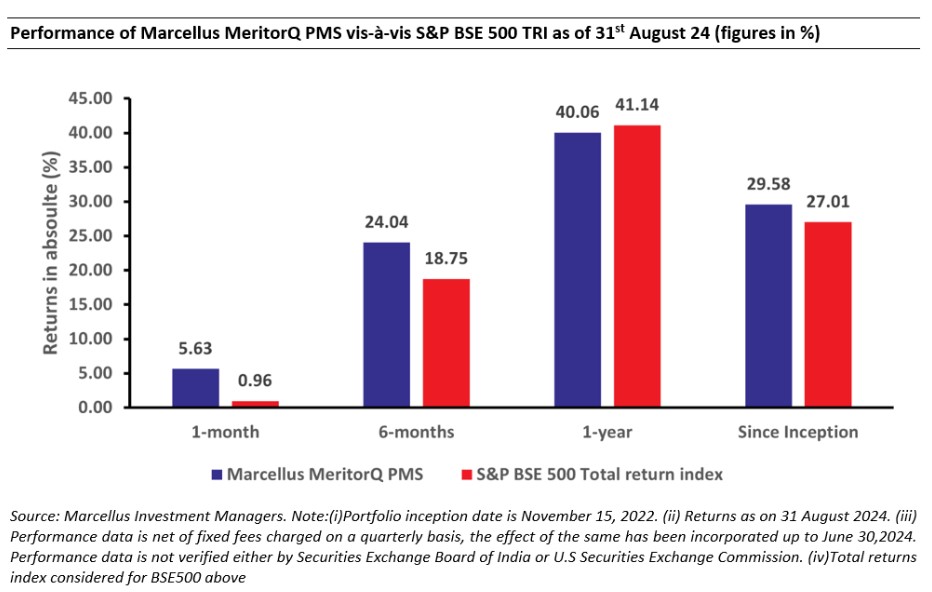
*For relative performance of particular Investment Approach to other Portfolio Managers within the selected strategy, please refer this link . Under PMS Provider Name please select Marcellus Investment Managers Private Limited and select your Investment Approach Name for viewing the stated disclosure

What is CAPE? 

It has been said that the most powerful force in financial markets is mean reversion. The rough idea is that an asset can’t move far away from “fair value” indefinitely. This holds true for equities more than any other asset class (for example, commodities like gold, metals etc.) as valuation of a company cannot keep drifting higher than its earnings forever, just due to higher demand for company’s shares. Comparing the share price with fundamental measures like earnings, cash flow or book value of a company then tells us if the share price is reasonably valued compared to its fundamentals.

In 1988, Campbell and Shiller proposed the idea of “CAPE” “Cyclically Adjusted Price to E arnings ratio”. Earnings are first adjusted for inflation over a trailing 10-year period to ensure that they are comparable to each other. To mitigate the impact of transient spikes or drops in earnings due to economic booms or recessions, earnings are averaged over a business cycle (typically 10 years), offering a clearer picture of the underlying long-term earnings power. We can think of CAPE as a relatively stable and noise-free price to earnings ratio. Despite its shortcomings, studies in various countries and time periods show an inverse relationship between starting CAPE values of the market index and future “real” equity returns (adjusted for inflation).

Where does CAPE stand today?

Exhibit 1 shows the historical CAPE series of Nifty 50 and Nifty 500 Index over last 20 years. As of end-July, Nifty 50 CAPE stood at 37.8x which was roughly 97th percentile of CAPE values since Jan-2004. Nifty 50 CAPE was roughly 2 standard deviations away from Nifty 50’s historical average CAPE of 25.9x.

CAPE of Nifty 500 Index which includes small and midcaps, was even higher at 45.5x which was roughly 99.5 percentile of Nifty 500 CAPE value since Jan-2007!  This should not come as a surprise as small and midcaps have relatively outperformed large caps over last four years.  Exhibit 1 also shows that valuations implied by CAPE have been rising since 2020 and are currently comparable to pre-2008 levels which was reached just before the global financial crisis.
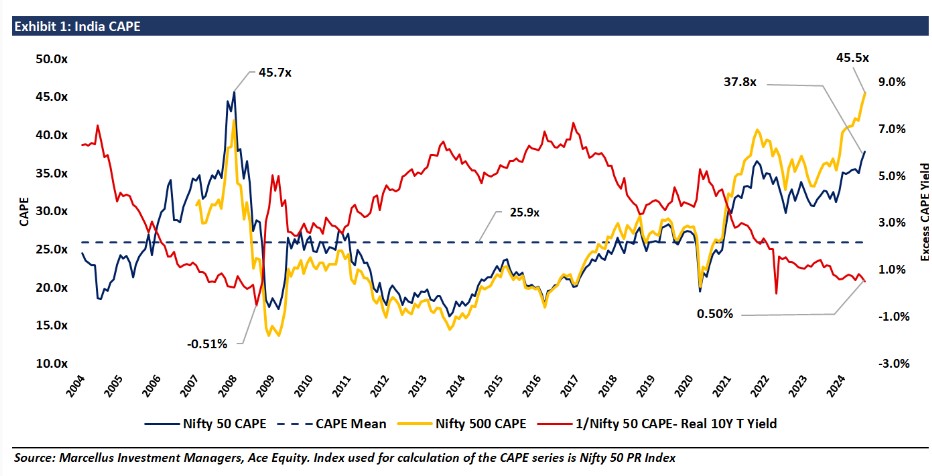
Since equity and debt are among the two major asset classes in India, one could look at the spread between the earnings yield implied by CAPE of Nifty 50 and inflation adjusted India 10 Yr bond yield (this then becomes the real bond yield). The lower this spread the more expensive are equities compared to debt. This spread, shown with a red line in Exhibit 1, stood at 0.5% as of July-2024 which was 94th percentile of spread values since Jan-2004.

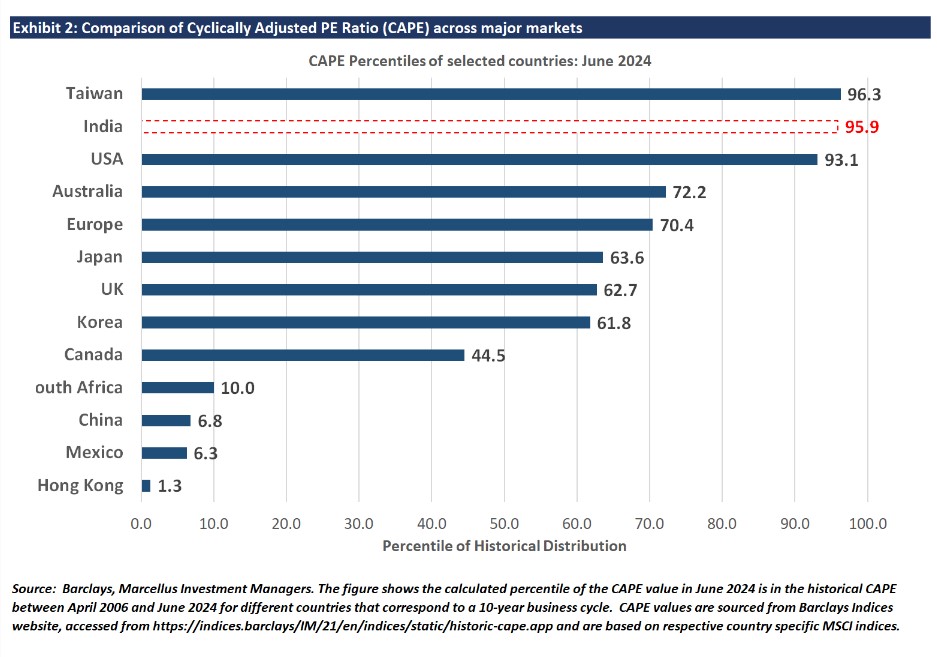
While the analysis above shows the CAPE of Nifty 50 and Nifty 500 versus its own history, Exhibit 2 shows that the Indian market CAPE (calculated on MSCI India Index) was amongst the second most highest when compared to other major markets as June-end.
Implications for forward looking returns

CAPE has been shown to be an effective gauge of forward-looking long-term returns in US and other international equity markets.  To check whether this holds true for India, we regress the starting CAPE of Nifty 50 every month between Dec-2003 to July-2014 against the subsequent 10-year inflation adjusted real returns of Nifty 50. Results as shown in Exhibit 3 imply a statistically significant inverse relationship between starting CAPE and subsequent long-term returns, hence confirming our hypothesis. Small cap Index returns being cyclical, show even stronger inverse relationship between starting CAPE and subsequent returns (not shown here for sake of brevity).
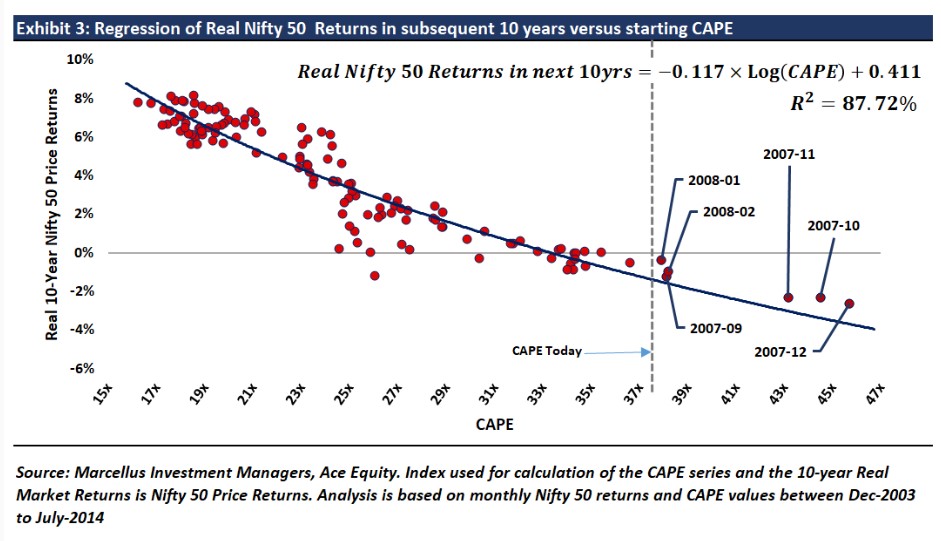
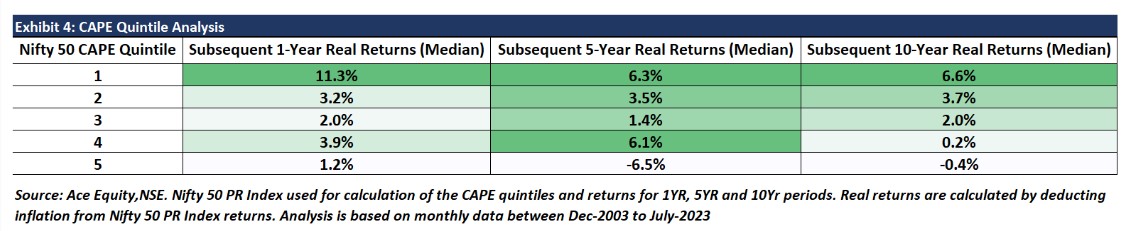
Exhibit 3 also shows that subsequent inflation adjusted 10-year returns of Nifty 50 have been negative every time its CAPE has been above 35x (which is the case today).  Exhibit 4 shows median real returns on CAPE quintiles formed monthly between Dec-2003 to July-2023 and subsequent 1, 5 and 10-year inflation adjusted annualized returns. Here again we see that inflation adjusted market returns are better for the cheapest quintile 1 for all horizons. Similarly, real market returns have been mostly low or negative over different horizons in the most expensive quintile 5, where markets are today.
We caveat the above analysis by noting that market valuation metrics like CAPE can at the best guide investors on possible future return scenarios and should not be considered for market timing. Also, since CAPE uses average of last 10-year earnings to smoothen out the effect of business cycles, it will be slower to change, in case there has been a regime change post-Covid. Hence, in periods of high growth, the 10-year average real EPS is biased downward because recent higher earnings are underrepresented; the result is that CAPE is artificially pushed higher. For example, Nifty 50 EPS has grown by 22.3% annualized over last 3 years aided partly by post-Covid topline recovery (FY22-23) and then from commodity cool-off (FY 23-24). If this growth can be sustained into the future, then investors can expect similar growth in the broad index, assuming no change in valuations from current levels.

For MeritorQ portfolio, we note that price to earnings ratio (PE) of the portfolio has been below the PE of the average stock in the investment universe since inception. This is shown in Exhibit 5.
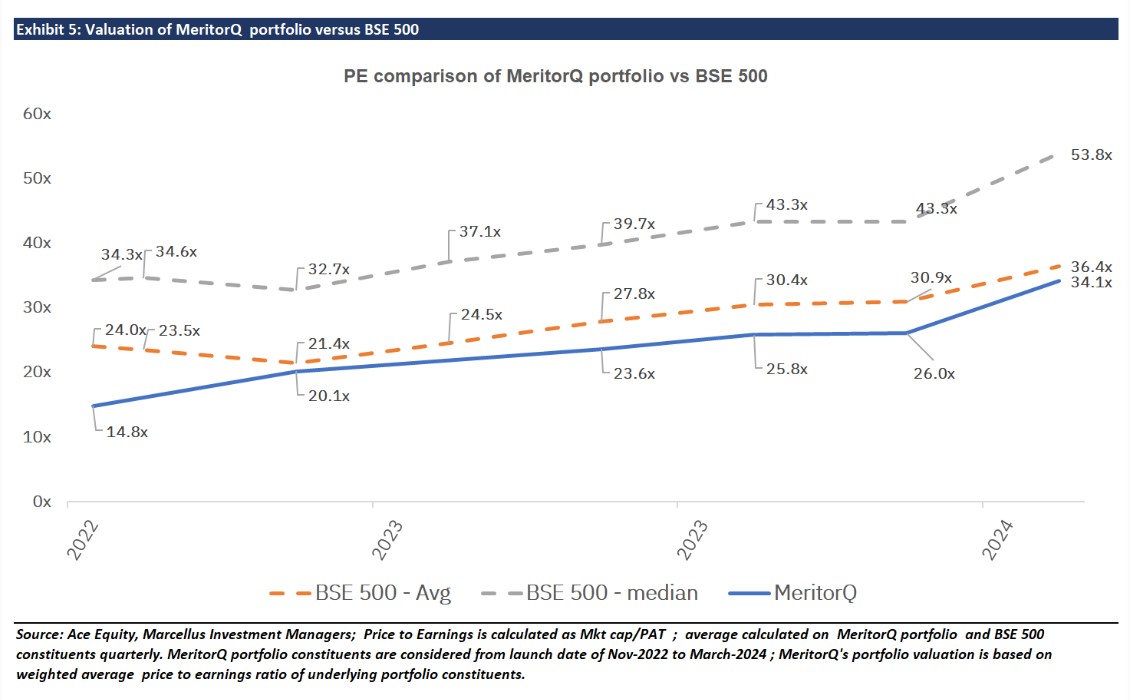
Secondly, MeritorQ’s lower valuations versus the benchmark has sustained despite the strategy’s focus on clean, profitable, cash flow generating companies. Thirdly, MeritorQ’s  multi-cap investment universe in MeritorQ allows flexible allocation across large, mid, and small cap stocks based on their fundamentals and valuations. As a result, large cap weightage in current portfolio stands at 41% from 15% in November-2022.

Investment returns ultimately come from three sources: earnings growth, dividends received, and change in the earnings multiple. Our approach in MeritorQ could be summarized as taking care of fundamentals by focusing on quality while controlling valuation risk by seeking to avoid overreach on free cash flow multiple. This in our opinion should be help the strategy, in case, the broad index valuations indeed revert back to more normal levels.


Disclaimer:

Note: the above material is neither investment research, nor investment advice. Marcellus does not seek payment for or business from this material/email in any shape or form. Marcellus Investment Managers Private Limited (“Marcellus”) is regulated by the Securities and Exchange Board of India (“SEBI”) as a provider of Portfolio Management Services. Marcellus is also a US Securities & Exchange Commission (“US SEC”) registered Investment Advisor. No content of this publication including the performance related information is verified by SEBI or US SEC. If any recipient or reader of this material is based outside India and USA, please note that Marcellus may not be regulated in such jurisdiction and this material is not a solicitation to use Marcellus’s services. This communication is confidential and privileged and is directed to and for the use of the addressee only. The recipient of this material is urged to consult their own legal and tax consultants/advisors before making any investments. The recipient, if not the addressee, should not use this material if erroneously received, and access and use of this material in any manner by anyone other than the addressee is unauthorized. If you are not the intended recipient, please notify the sender by return email and immediately destroy all copies of this message and any attachments and delete it from your computer system, permanently. No liability whatsoever is assumed by Marcellus as a result of the recipient or any other person relying upon the opinion unless otherwise agreed in writing. The recipient acknowledges that Marcellus may be unable to exercise control or ensure or guarantee the integrity of the text of the material/email message and the text is not warranted as to its completeness and accuracy. The material, names and branding of the investment style do not provide any impression or a claim that these products/strategies achieve the respective objectives. Further, past performance is not indicative of future results. Marcellus and/or its associates, the authors of this material (including their relatives) may have financial interest by way of investments in the companies covered in this material. Marcellus does not receive compensation from the companies for their coverage in this material. Marcellus does not provide any market making service to any company covered in this material. In the past 12 months, Marcellus and its associates have never i) managed or co-managed any public offering of securities; ii) have not offered investment banking or merchant banking or brokerage services; or iii) have received any compensation or other benefits from the company or third party in connection with this coverage. Authors of this material have never served the companies in a capacity of a director, officer or an employee. All recipients of this material must before dealing and or transacting in any of the products referred to in this material must make their own investigation, seek appropriate professional advice and carefully read the Private Placement Memorandum/Disclosure Document, Form ADV, Form CRS and any other documents or disclosures provided to them by Marcellus, as applicable.

The stocks described about in the presentation do form the part of our Marcellus’ portfolio so we as Marcellus, our clients and our immediate relatives do have interest and stakes in the described stocks. The described stocks are for illustration purpose only and not recommendatory.

This material may contain confidential or proprietary information and user shall take prior written consent from Marcellus before any reproduction in any form.

Regards, Team Marcellus

If you want to read our other published material, please visit https://marcellus.in/pms-investment-blog/


Copyright © 2026 Marcellus Investment Managers Pvt Ltd, All rights reserved


RELATED NEWSLETTERS

  • Aug 12, 2026

    Marcellus Portfolio Updates & Insights – August 2026

    READ MORE
  • Aug 06, 2026

    Global Compounders: Why have we underperformed the S&P500 in 2026?

    READ MORE
  • Jul 27, 2026

    Isaac Newton and the Madness of Men

    READ MORE

RELATED NEWSLETTERS

  • Aug 12, 2026

    Marcellus Portfolio Updates & Insights – August 2026

    READ MORE READ MORE
  • Aug 06, 2026

    Global Compounders: Why have we underperformed the S&P500 in 2026?

    READ MORE READ MORE
  • Jul 27, 2026

    Isaac Newton and the Madness of Men

    READ MORE READ MORE
PREV ISSUE

Global Compounders Portfolio: Update on Favourable Policy/Regulatory Change


Published on Aug 20, 2024
NEXT ISSUE

Portfolio Performance and Update on Fundamentals - August 2024


Published on Sep 20, 2024

Did`t receive OTP? 00:00 Resend
Be the First to Know

Marcellus logo

At Marcellus, our Purpose is to make wealth creation simple and accessible by being trustworthy and transparent capital allocators.

  • Twitter-Marcellus Investment
  • LinkedIn-Marcellus Investment

Marcellus Investment Managers Private Limited

Please reach out to us at

Board Line : 0806-9199-400

Sales Desk: 0806-9199-401

e-mail: invest@marcellus.in


Marcellus Investment Managers
102, First Floor, Boston House, Suren Road,
Near 'Western Express Highway' Metro Station,
Andheri East, Mumbai 400093

Please reach out to us at

e-mail: help.gift@marcellus.in


Marcellus Investment Managers
IFSC Branch – Unit no. 431 and 432, Signature Building, Fourth Floor, Block 13B, Zone-1, GIFT SEZ, GIFT City, Gandhinagar – 382 355/382 050

  • Home
  • Our Team
  • Invest with us
  • GIFT City Corporate Disclosures
  • Marketing Disclosure
  • Investing Books
  • FAQs
  • Videos
  • Newsletters
  • Corporate Regulatory Disclosure
  • Company Information
  • Terms & Conditions
  • Privacy Policy
  • Responsible Investing
  • Contact Us

2026 © | All rights reserved.

Privacy Policy | Terms and Conditions

Please read the following carefully and select your residency jurisdiction


If accessing this website by giving false declaration, the person shall be solely liable/responsible for any adverse consequences suffered, legally as well as financially, pursuant to use of any information contained in this website

Beware of fraudulent websites and applications!

Marcellus or its employees will never ask you to join WhatsApp groups or social media accounts created by or on behalf of Marcellus. Marcellus does not have any App facilitating trading in securities, nor does Marcellus issue any advertisement for investment in any specific stocks or for any cash transactions.

If you come across any such activity, please report to the appropriate law enforcement authorities, and inform us on compliance@marcellus.in.

Click here for the list of our official social media handles.

Close