Marcellus’ Consistent Compounders portfolio has shown resilience since inception in 2018. This resilience is not uncommon for share prices of great companies. Over the past 2 decades, in stock market crashes,stocks like Asian Paints and HDFC Bank have, more often than not, delivered positive and healthy returns.More importantly, in the few instances that these stocks have delivered negative returns during stock market crashes, their drawdowns have been smaller than that of the market, and the recovery has been sooner and sharper vs the market. This outperformance during periods of market crash is due to a combination of two factors: a) earnings growth of such stocks more than offsets the P/E multiple compression; and b) the degree of P/E multiple compression for consistent compounders is lower than that for the broader market.
Performance update – as on 31st August 2019
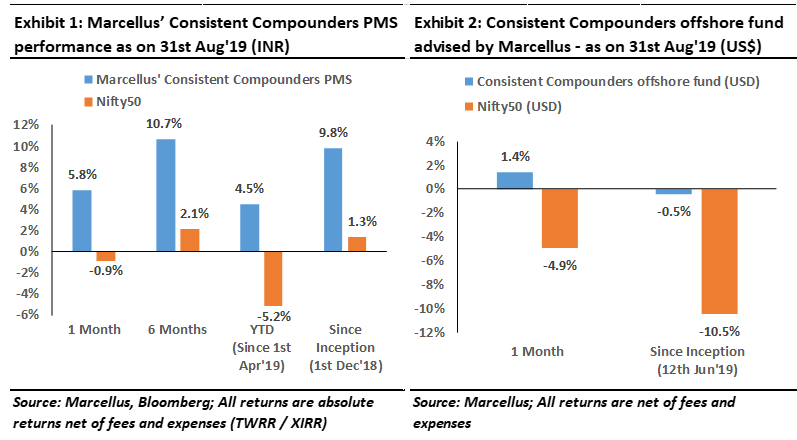
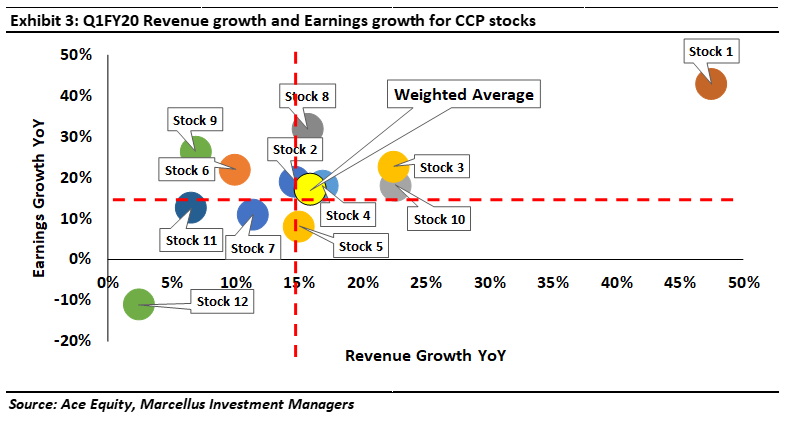
We have a coverage universe of around 25 stocks, which have historically delivered a high degree of consistency in ROCE and revenue growth rates. Our research team of five analysts focuses on understanding the reasons why companies in our coverage universe have consistently delivered superior financial performance. Based on this understanding, we construct a concentrated portfolio of companies with a intended average holding period of stocks of 8-10 years or longer. The latest performance of our PMS and offshore fund (USD denominated) portfolios is shown in the charts below.
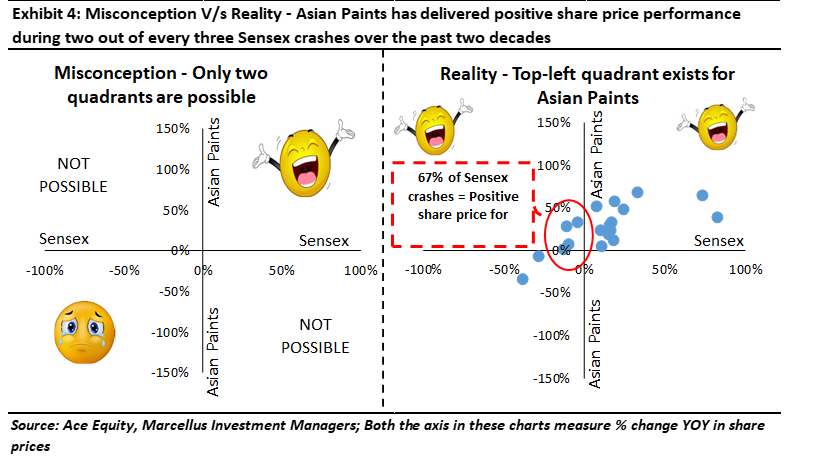
This performance has been well supported by robust underlying fundamentals of our portfolio companies. As highlighted in the chart below, revenue growth and earnings growth of our portfolio companies (weighted by the % of portfolio in that stock) have been 16% YoY and 17% YoY respectively.
This robust performance has been delivered during a period when the broader economic environment is undergoing substantial moderation, in particular for the B2C consumption oriented categories. Most of our portfolio constituents are companies involved in products and services associated with middle class household consumption.
Consistent compounders outperform during market stress
“’Only when the tide goes out do you discover who’s been swimming naked’. This insight from Warren Buffett has repeatedly proved to be correct when it comes to investing in stocks. When the broader market is
undergoing a euphoric or bullish phase, most stocks do well regardless of the quality of their underlying fundamentals. However, when the euphoria ends, stocks with poor underlying fundamentals are decimated, leading to significant capital erosion for investors who did not adequately understand the weak fundamentals of their portfolio companies.”– from ‘Coffee Can Investing: The low risk route to stupendous wealth’ (2018)by Rakshit Ranjan, Saurabh Mukherjea & Pranab Uniyal
BSE Sensex Index has delivered 12% CAGR over the past 20 financial years (FY99-FY19). Out of these 20 years, the Sensex has delivered a negative return in six years.
In each of these six years, an investor would have ideally wanted to sit out in cash and hence avoid any drawdown in his portfolio. However, staying invested in a portfolio of consistent compounders throughout these 20 years, including the six years of Sensex crash would have been more prudent.
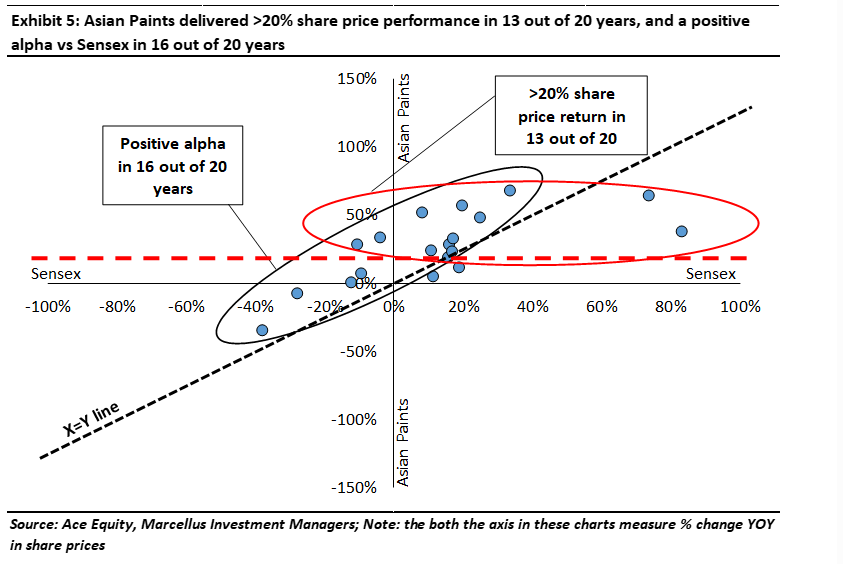
Let us first understand this using Asian Paints’ example in the chart below.
The horizontal axis of the chart shows Sensex’s one-year performance for a financial year (1st April to 31st March). The vertical axis of the chart shows Asian Paints’ one-year performance for the same financial year. Here is the difference between misconception and reality:
• The misconception:
When an investor tries to time his entry and exit from Asian Paints based on his expected direction of Sensex, he is assuming that investments in Asian Paints will either fall in the top right quadrant of this chart or in the bottom left quadrant of this chart.
• The reality:
As shown in exhibit 4, there are more data points in the top-left quadrant of the chartthan there are in the bottom-left quadrant of the chart! Hence, even if an investor can predict a Sensexcrash correctly, in 67% of such Sensex crashes historically, Asian Paints has delivered a positive share price performance. This has made it futile to time entry and exit from Asian Paints based on an investor’s view of the broader stock market direction!
And here are some added benefits of staying invested in Asian Paints (see exhibit 5):
• 20%+ share price increase per annum in 13 out of 20 years:
Data points above the red dotted horizontal line in exhibit 5 below show that in 13 out of 20 financial years, Asian Paints has delivered more than 20% share price return. Most importantly, two of these 13 instances are those where Sensex was negative (and still Asian Paints delivered more than 20% share price rise in these years).
Hence, if an investor sits out in cash waiting for the market to correct, it could be a year when the investor’s call on the market is right, but Asian Paints is (more likely than not) to rise by 20% or more even in such circumstances.
• Positive alpha in 16 out of 20 years:
The black dotted line is an ‘X=Y’ line. Data points above this line are where Asian Paints’ share price has outperformed vs Sensex. Asian Paints has outperformed vs Sensex in 16 out of 20 years i.e. 80% of the instances!
Lastly, there are no data points in the bottom right quadrant i.e. there are ZERO instances of Asian Paints delivering a negative return when Sensex delivered a positive return.
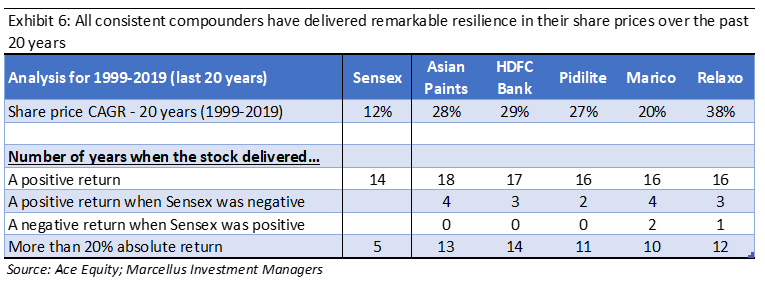
Asian Paints is not an exception – all consistent compounders deliver similar outcomes
As highlighted in the table below, the observations highlighted for Asian Paints in the analysis above are common across all consistent compounders.
Why do consistent compounders outperform during market stress?
Let’s consider a simple equation – share price is a product of two factors – ‘P/E multiple’ and ‘Earnings’.
The broader market delivers no more than 10-12% annualized earnings compounding, but in an inconsistent manner. Hence, when periods of weak earnings growth (say 0-5%) coincide with P/E multiple compression, we see a stock market crash.
Consistent compounders (the kind of stocks highlighted in exhibit 4 above), have historically delivered 20-25% annualized earnings compounding in a very consistent manner. Even during periods of weak economic growth
these firms tend to deliver 15-17% annualized earnings growth. Moreover, given their consistency of healthy of healthy fundamentals during periods of P/E multiple compression these stocks undergo a low degree of P/E multiple compression than the border market.The interplay between these two markets for consistent compounders ensures that:
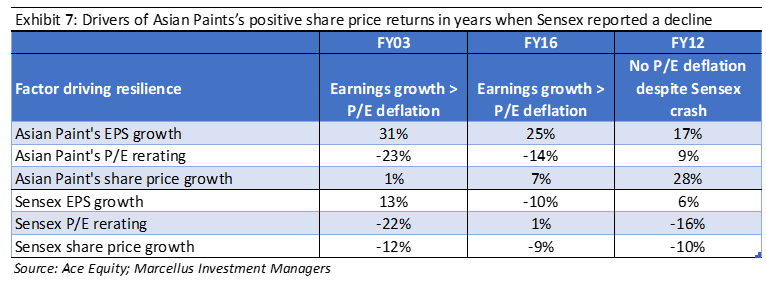
1. Earnings growth more than offsets the P/E de-rating:
For example, in FY03 and FY16 (see exhibit 7 below), Asian Paints managed to maintain healthy earnings growth even in a disruptive external environment. Hence, the ripple effect of a stressed stock market’s P/E multiple de-rating has been more than offset by Asian Paints’s earnings growth during the same period.
2. P/E does not de-rate because the market incrementally factors in longevity of earnings:
In FY12, Asian Paints’s P/E multiple expanded by 9% with an EPS growth of 17%, in a year when the Sensex’s P/E multiple deflated by 16% and Sensex’s earnings grew by 6%.
Investment implications – The trinity of uncertainty
At any point of time for an equity investor, there is no shortage of uncertain / unexpected events around the next 12 month’s macro-economic environment. For example – 2019 has been about politics (general elections),union budget, US-China trade war etc. 2018 was about the union budget (long term capital gains tax), SEBI regulations for mutual funds (large cap MF can’t hold too much exposure to mid and small caps), IL&FS crisis, crude oil price rally in September etc. 2017 had GST, 2016 had demonetization – so on and so forth. Amidst
all this ‘excitement’, most equity investors tend to predict three layers of uncertainty:
1. Outcome of major global/national events–
for instance, not too many investors could have predicted a thumping victory for the BJP in 2019, let alone predicting events like demonetization and the extent of the trade war between the USA and China!
2. Direction of the stock market based on the outcome of these events–
for example, sitting in November 2016, it was difficult to think that demonetization will be followed by one of the biggest stock markets rally in 2017. Similarly, not too many investors could foresee that the BJP’s crushing victory in the 2019 elections would be followed by a stock market correction.
3. Share price movements in your stock portfolio, based on the direction of the stock market–
logically speaking, only the P/E multiple of a stock can have some correlation with the broader market, not the stock’s fundamentals (earnings). Hence, weak fundamentals will lead to a share price fall in a rising market and vice a versa. A recent example of this is Asian Paints’ 17-18% YoY volume growth in 1QFY20 amidst broader consumption slowdown, which has led to a 18% rally in its share price over the past two months when Sensex has fallen by 5%.
Given the difficultly of predicting the outcome of this trinity of uncertainty, over the longer term it becomes a speculative and futile exercise for an equity investor to time entry and exit from the stock market based on these events.
Our Consistent Compounders Portfolio (CCP) overcomes this challenge by building a portfolio of companies whose consistency of healthy fundamentals results in a low-volatility of their share prices. In cricketing parlance, predicting when Rahul Dravid would make a half century, did not require someone to analyse factors like pitch-report, weather-report, opposition bowlers’ strength, whether it is a league match or a high pressure series final etc. However, predicting the batting performance of most other batsmen, would have required all this analysis!
Regards
Team Marcellus
If you want to read our other published material, please click here
Note: the above material is neither investment research, nor investment advice. Marcellus does not seek payment for or business from this emaihttps://marcellus.in/blog/l in any shape or form. Marcellus Investment Managers is regulated by the Securities and Exchange Board of India as a provider of Portfolio Management Services and as an Investment Advisor.
Copyright © 2018 Marcellus Investment Managers Pvt Ltd, All rights reserved.
This communication is confidential and privileged and is directed to and for the use of the addressee only. The recipient if not the addressee should not use this message if erroneously received, and access and use of this e-mail in any manner by anyone other than the addressee is unauthorized. If you are not the intended recipient, please notify the sender by return email and immediately destroy all copies of this message and any attachments and delete it from your computer system, permanently. Any opinions or advice contained in this email are subject to the terms and conditions expressed in a duly executed contract or written agreement between Marcellus Investment Managers Private Limited and the intended recipient. No liability whatsoever is assumed by the sender as a result of the recipient or any other person relying upon the opinion unless otherwise agreed in writing. The recipient acknowledges that Marcellus Investment Managers Private Limited may be unable to exercise control or ensure or guarantee the integrity of the text of the email message and the text is not warranted as to its completeness and accuracy

