In FY19, our portfolio companies reported 18% revenue growth, 16% earnings growth and 37% ROCE. Whilst this was a healthy performance at an overall level, the external environment facing our companies deteriorated towards the end of FY19 due to tight credit conditions accentuated by the challenges in the NBFC sector (and hence challenges faced by the distribution channel in getting working capital finance). With earnings contributing to 80% of the share price movement of our portfolio companies over FY15-19, we continue to be comfortable with the current valuations of our portfolio companies, given the sustenance of their competitive advantages (and hence healthy ROCEs) over the long term in future. Last month we also added Kotak Mahindra Bank as a new stock to the portfolios of our clients, taking our exposure to the Financial Services sector towards 25% of the portfolio.
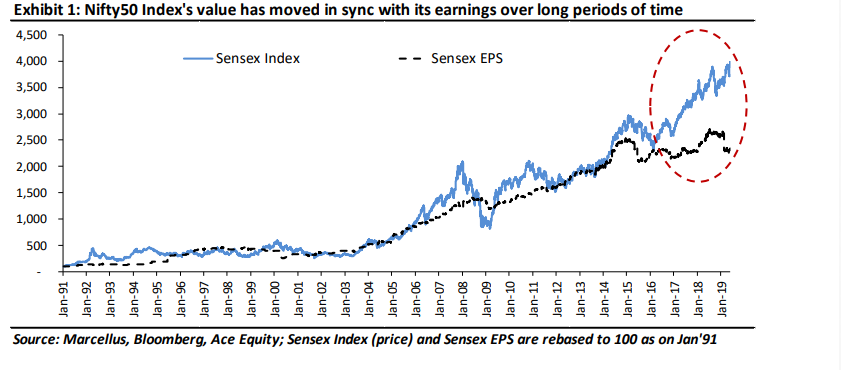
Earnings growth is the biggest driver of share prices over the longer term. This is best depicted by the chart shown below. Whilst in the short term, a gap might open-up between earnings trajectory and share prices, this gap always vanishes over the longer term.
Against this backdrop, it is worth analyzing the recently reported performance of our portfolio companies’ fundamentals in FY19, as summarized below (on a weighted average basis, where weights equate to stockwise allocations in our model portfolio).
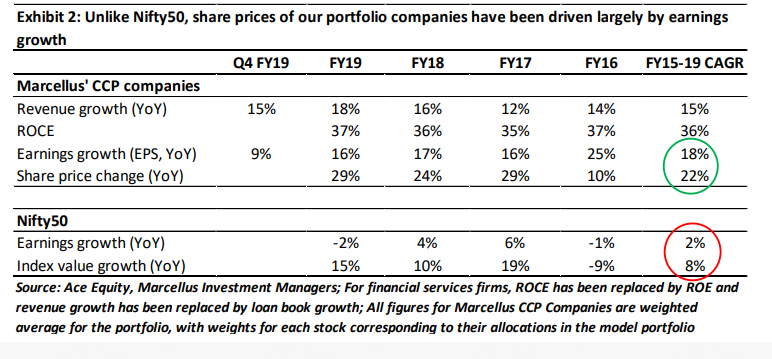
Revenue and earnings growth rates: Our portfolio companies reported revenue growth of 18% YoY in FY19, supported by an average volume growth of 12% YoY. This growth reflected market share gains for almost all firms in our portfolio, despite a difficult macro-economic environment for middle class consumption.
The first half of FY19 saw some improvement in the demand conditions with trade and supply channels recovering from the past disruptions caused by demonetisation and the implementation of GST. However, Q4 FY19 was particularly weak with revenue growth of 15% YoY (supported by volume growth of 9% YoY) being lower than the historical long-term average of 20-25% CAGR reported by our portfolio companies. Our reading is that the weakness in Q4 FY19 arose from:
- Tight credit conditions accentuated by the challenges in the NBFC sector (and hence challenges faced
by the distribution channel in getting working capital finance) - Rising unemployment
- Low rural and urban income growth.
For instance, Page Industries, a firm which has reported volume growth above 10% YoY in most quarters historically, reported only 1% YoY growth in Q4 FY19. This included volume decline on a YoY basis for the multibrand outlets (like hosiery stores – which rely substantially on working capital finance), whilst volumes grew at a relatively healthy pace for the exclusive brand outlets (Jockey branded stores) and large format stores (like Lifestyle and Pantaloons). Some of our portfolio companies in the paints industry, footwear industry, diagnostic lab industry etc. reported healthy volume growth rates of more than 10% YoY in Q4 FY19, driven by market share gains.
We expect the weakness in revenue growth related to the issues faced by the distribution channel to be temporary in nature. Hence revenue growth rates of our portfolio companies should see a recovery as FY20 progresses.
Moving on from topline growth towards bottomline growth, earnings growth of our portfolio companies was at 16% YoY in FY19 and only 9% YoY in Q4 FY19. Margins in Q4 FY19 were adversely affected by higher raw material prices for firms in the paints, adhesives and footwear industries, compared to Q4 FY18. As highlighted in our April 2019 Newsletter, fluctuations in crude oil prices and currencies has always caused volatility in quarterly earnings for a firm like Asian Paints as it takes a few months for them to pass on the adverse impact / benefits of raw material prices to its customers by means of price hikes / cuts. Since we remain convinced about the strength of the competitive advantages (and hence about the pricing power) possessed by our portfolio companies, we are not worried about one or two quarter compression in margins and hence earnings growth of these firms.
Return on Capital Employed (ROCE):
The most sustainable way for a firm to grow its earnings over the longer term is to deliver ROCE substantially higher than the cost of capital (around 15% in India), then be able to plough this free cash flow back into the business to grow the capital employed, sustain its high ROCE and thereby grow its earnings. As shown in the exhibit 2 above, our portfolio companies have consistently delivered ROCE of 35-37% historically whilst re-deploying 50-60% of their operating cash flows back into the business.
Share price movements and P/E multiples
As highlighted in exhibit 2 (see encircled figures), for Nifty50 Index, earnings growth has contributed to only one-fifth of the index return over FY15-19 (i.e. 2% earnings CAGR vs 8% index value CAGR), and hence the bulk of the index return has come from P/E multiple expansion. On the contrary, for our portfolio companies, earnings growth has contributed to four-fifth (i.e. 80%) of the share price returns, with P/E expansion being only a small contributor to the portfolio’s performance. In other words, our portfolio companies have delivered returns in sync with their earnings growth over FY15-19. Moreover, since the P/E multiples do NOT adequately capture the longevity of a business, we continue to be comfortable with the current valuations of our portfolio companies, given the sustenance of their competitive advantages (and hence healthy ROCEs) over the long term in future.
Changes made to our portfolio
Last month we added Kotak Mahindra Bank as a new stock to the portfolios of our clients. Kotak has demonstrated highly consistent and healthy historical track record – a pre-requisite for inclusion in our Consistent Compounders Philosophy. Kotak’s loan book has grown at a CAGR of 27% over FY09 – FY19. Consolidated earnings growth CAGR during the same period (FY09-19) was at 27%. Kotak’s loan book grew by greater than 15% YoY in 9 out of the last 11 years.
Even more interestingly, Kotak’s net NPA ratio has been at 0.87% during FY09-FY19 (one of the lowest in the industry). Over the last five years, while other banks have struggled with asset quality issues in their corporate loan book, Kotak’s corporate loan book has grown at more than 20% CAGR in a challenging environment.
Kotak’s key strengths include: (a) CASA (current account savings account) contributes to 53% of its total funds (up from 30% in FY13) – this is the stickiest source of funding which is related to trust built with its retail customers, and most importantly it helps in understanding the customers better (HDFC Bank’s CASA contributes to 40% of its total funds); (b) prudence in managing risk, which is reflected in its NPA numbers; (c) anticipating market cycles well ahead of peers; and (d) capital allocation discipline. A strong retail franchise, exceptional management and healthy capitalization (Tier1 capital of 17.6%), place Kotak Mahindra Bank in a sweet spot to capitalize on growth opportunities and gain market share in future, especially as other banks and NBFCs struggle with poor asset quality and difficulties in raising low cost funds.
Marcellus’ Consistent Compounders PMS – Performance update
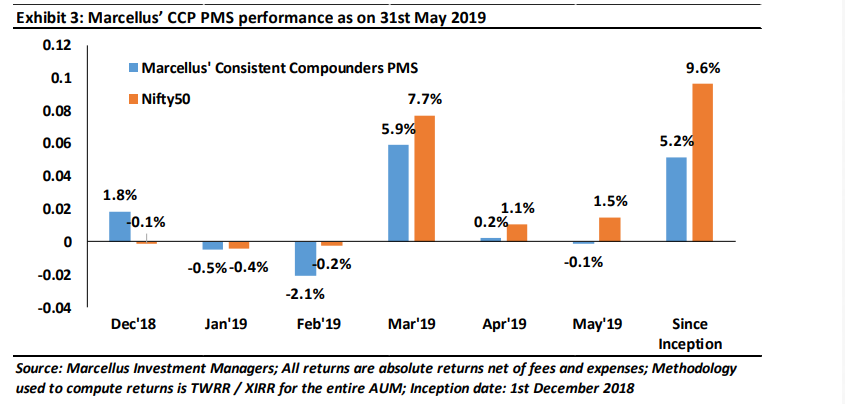
Marcellus’ Consistent Compounders PMS has a coverage universe of over a couple of dozen stocks, which have historically delivered a high degree of consistency in ROCE and revenue growth rates. Our research process involves understanding the reasons why companies in our coverage universe have consistently delivered superior financial performance. Based on this understanding, we construct a portfolio of 10-15 companies with an intended average holding period of stocks of 8-10 years or longer. The latest performance of our PMS is shown in the chart below.
Regards
Team Marcellus
If you want to read our other published material, please click here
Note: the above material is neither investment research, nor investment advice. Marcellus does not seek
payment for or business from this email in any shape or form. Marcellus Investment Managers is regulated
by the Securities and Exchange Board of India as a provider of Portfolio Management Services and as an Investment Advisor.
Copyright © 2018 Marcellus Investment Managers Pvt Ltd, All rights reserved.

