Investors’ decision making is often underpinned by a key psychological trait – loss aversion. As explained by Noble laureate Daniel Kahneman, the result of ‘loss aversion’ is that our pain from losses is more than twice the joy from equal amounts of gain. Juxtaposing this idea to the CCP investing approach discussed in our book ‘Diamonds in the Dust’ shows how a short term (sub-3-years) horizon focused investor tends to be perennially unhappy despite her portfolio generating very healthy returns over longer time periods. In contrast, with the same portfolio and with the same returns, an investor with a longer time horizon experiences happiness. This extraordinary paradox lies at the heart of why so few investors succeed in achieving satisfactory results from investing in equity markets.
Performance update – as on 31st January 2023
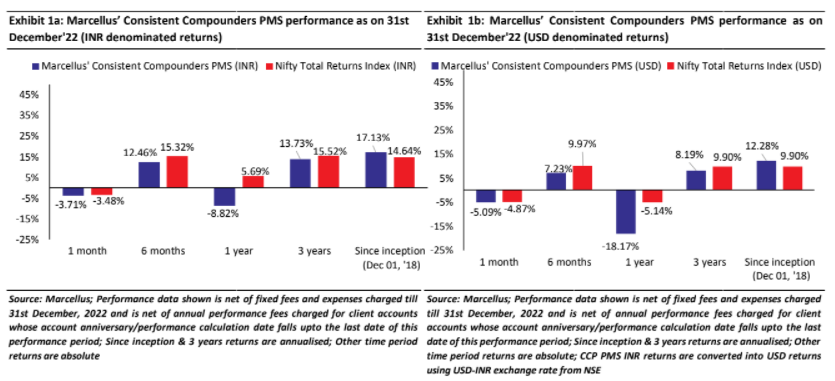
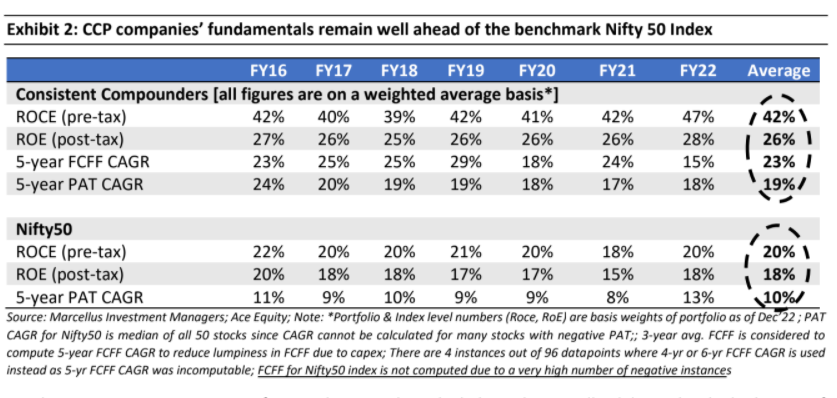
We have a coverage universe of around 25 stocks, which have historically delivered a high degree of consistency in ROCE and revenue growth rates. Our research team focuses on understanding the reasons why these companies have delivered healthy and consistent historical track record and which of these companies are likely to sustain their superior financial performance in future. Based on this understanding, we construct a concentrated portfolio of 13-15 companies with an intended average holding period of stocks of 8-10 years or longer. The latest performance of our PMS portfolio and the underlying fundamentals of the constituent stocks is shown in the charts above.
Some of our recent newsletters highlighted how the combination of high-quality stocks and long-time horizon provides the lowest risk, highest return outcome (see our Aug’22 Newsletter) and how long-term absolute performance objectives are far more important wealth drivers than short term relative performance objectives (see our Sep’22 Newsletter).
In this newsletter, we extend this argument to include the impact of time horizons on human psychology through the lens of ‘loss aversion’ – a human behavioural trait that was discussed in ‘Thinking, Fast and Slow’ by Nobel prize winning author and psychologist Daniel Kahneman.
‘Loss aversion’ – Losses loom larger than gains in human psyche
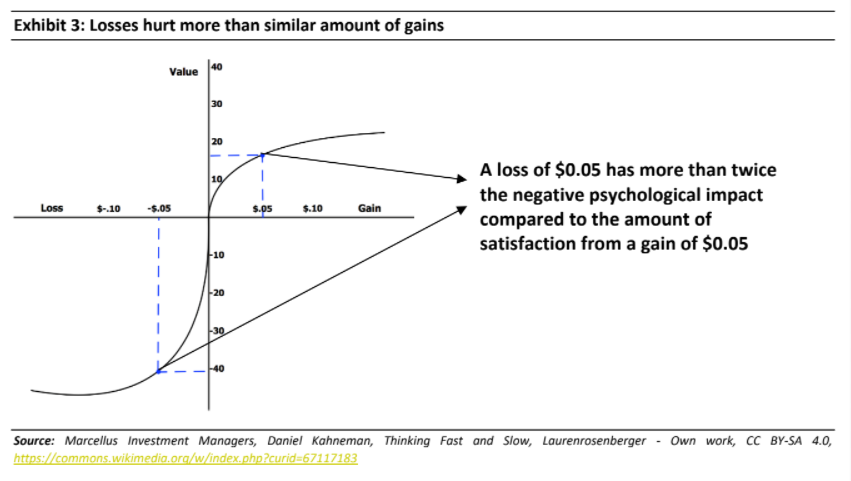
According to this theory, humans are risk averse creatures and are terrified of losses – whether in personal life or in financial investments. Simply put, humans experience significantly higher amount of pain from losing a certain amount of money than the joy we would experience from gaining that same amount of money – see the exhibit below for an illustration. According to the study referenced in the book “Thinking Fast and Slow” by Daniel Kahneman, the ratio of negative to positive emotion or “loss aversion ratio” lies within a range of 1.5 to 2.5.
Marketeers and advertisers have used this idea actively in their campaigns to sign up the users for their products/services. For instance, the ‘free trial/cancel at any time’ option given by OTT service Netflix is designed to smartly play on a person’s reluctance (or aversion) to lose out on quality content if they choose to cancel after the trial period. In a similar vein, many companies offer discounted products with an urgent time limit like – “Only 1 hour left to order for next day delivery” or “Only 2 of these items left in stock” to capitalise on a customer’s loss aversion – the feeling of losing out a discounted offer which was available with the customer.
Whenever an equity investor looks at her portfolio, she feels pleasure or disappointment basis either the absolute returns or relative returns, or both. Absolute returns is the rate at which a portfolio has
compounded over a certain period of time whereas relative return is the way such portfolio has compounded relative to either an equity benchmark index or a fixed deposit or any such measure of return threshold. A negative relative performance implies opportunity loss (vis-à-vis investment in benchmark) whereas a negative absolute performance implies capital loss.
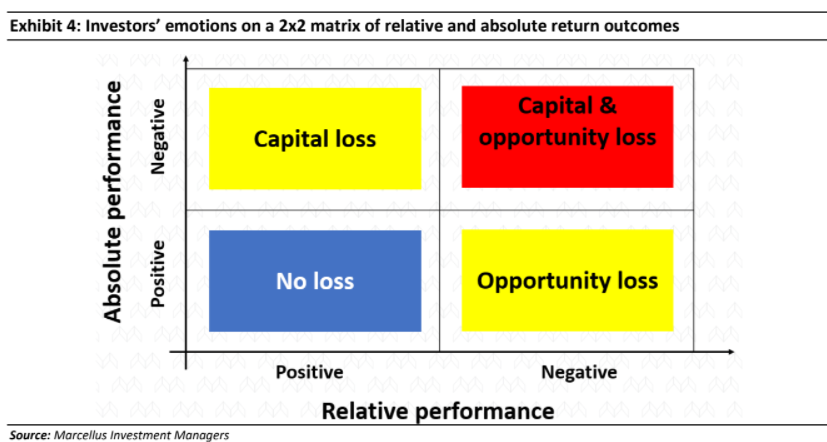
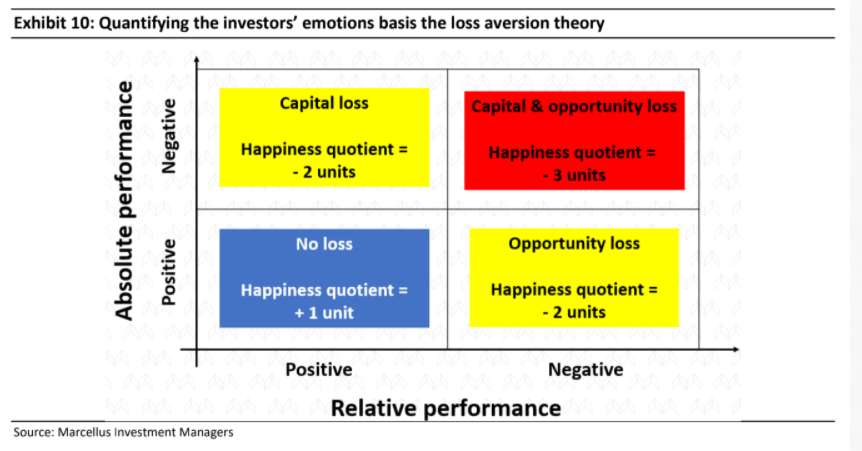
Combining the possibilities created by relative performance (or lack thereof) and absolute performance (or lack thereof) gives us the 2×2 matrix shown in the exhibit below which highlights the four types of investment performance that are experienced by an investor:
-
Blue
coloured quadrant denotes the scenario where a portfolio has given a positive return both on an absolute as well as relative basis. An investor is therefore happy in this scenario.
-
Yellow
coloured quadrant represent the scenario where investor has experienced a negative outcome on either an absolute or relative basis (i.e. one positive outcome and one negative outcome). An investor is somewhat unhappy under this scenario because the negative outcome has a greater bearing on the investor’s psychology compared to the positive outcome.
-
Red
coloured quadrant represents the scenario where the portfolio has underperformed both on absolute as well as relative basis. An investor is very unhappy under this scenario.
The shorter the investment horizon, the more long lasting are periods of unhappiness for an equity investor
“I never attempt to make money on the stock market. I buy on the assumption that they could close the market the next day and not reopen it for five years.” – Warren Buffet
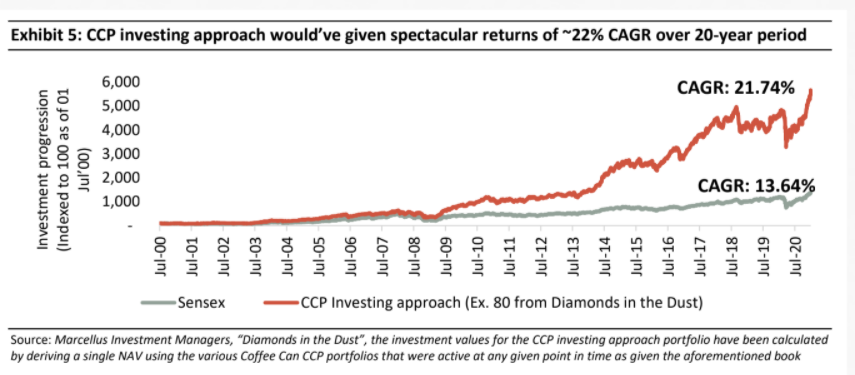
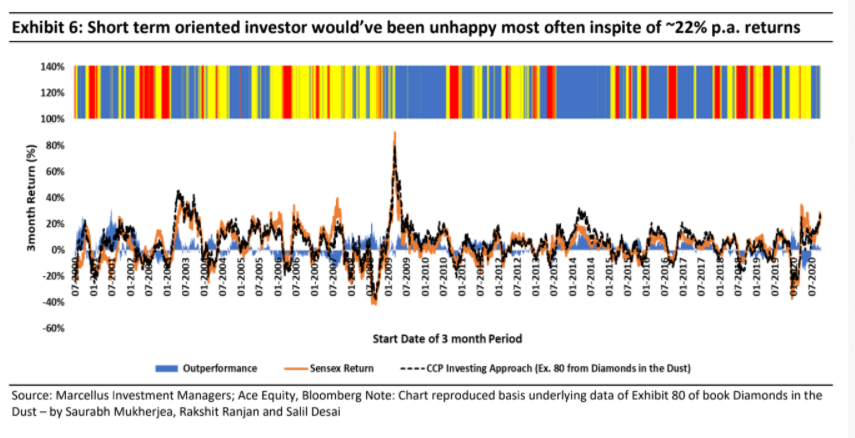
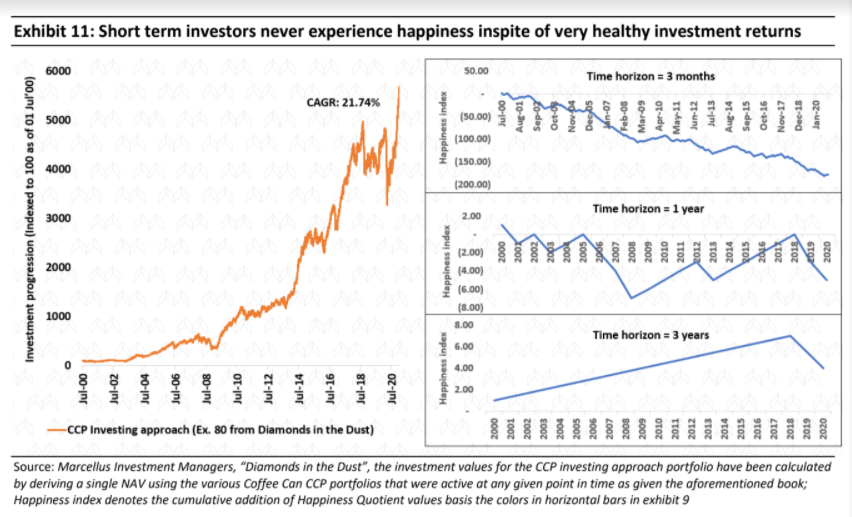
Consider the chart below – the RED line reflects the NAV of a portfolio which has compounded at nearly 22% CAGR over 20 years, beating the benchmark by a healthy 8% points in this rate of compounding.
This chart has been picked up from our bestselling book ‘Diamonds in the Dust – Consistent Compounding for Extraordinary Wealth Creation’ (this is Exhibit 80 from the book, converted into an NAV chart; this chart is the backtest of the filter based portfolios highlighted in the appendix of that book). Most investors looking at this chart would say this is a demonstration of absolutely outstanding performance over a period as long as 20 years!
However, there are several types of investors who would have been unhappy for most of the 20-year period of investment shown in this chart. Here is how.
Let’s use the colour coding we discussed in exhibit 4 to describe the periods of happiness / unhappiness of different types of investors who would have stayed invested in the portfolio shown in the chart above (and compounded their investment at a staggering 21.74% CAGR over 20 years!):
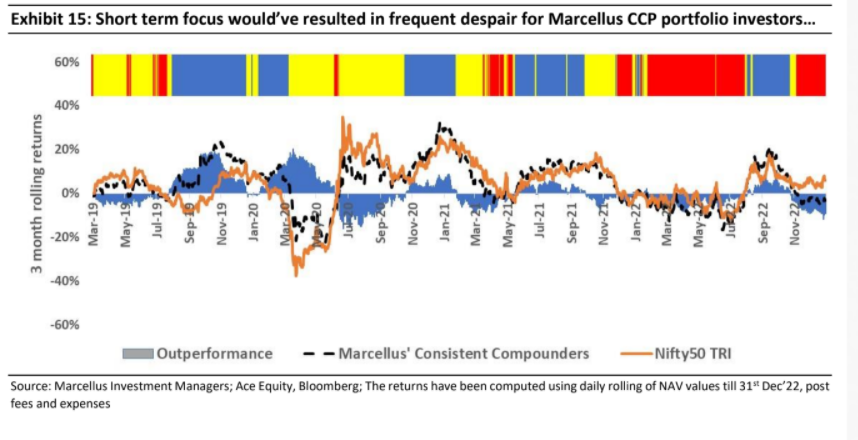
a)‘3-month-horizon-investor’:
If we break down the chart above into periods of 3-month performance (i.e. at any point of time the investor looked at succeeding 3 months of CCP investing approach portfolio & Sensex returns), we get the chart as shown below. The colourful horizontal bar on top of the chart denotes the psychological impact of returns assessment on the investor using the 2×2 matrix described above – Blue denotes happiness, Yellow – some unhappiness, and Red – extreme unhappiness.
Conclusion –
Investors who check their portfolio returns over time periods as short as 3 months, are likely to experience very few instances of happiness (BLUE shades) and several instances of unhappiness (RED and YELLOW shades) even in a portfolio which delivers great outcomes over the long term.
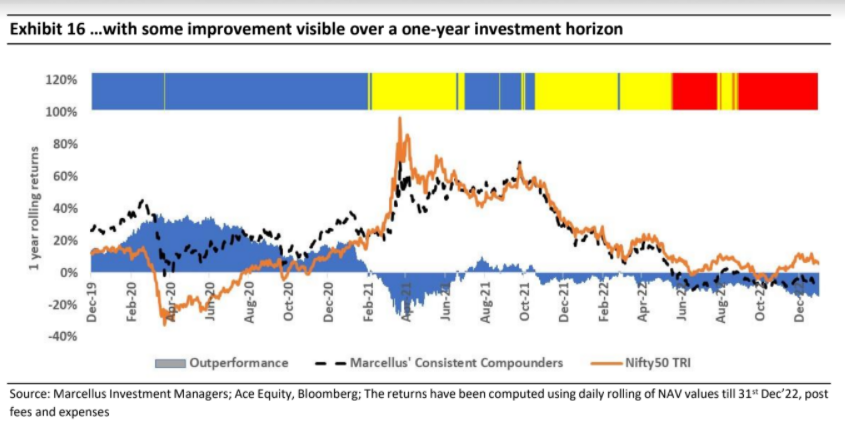
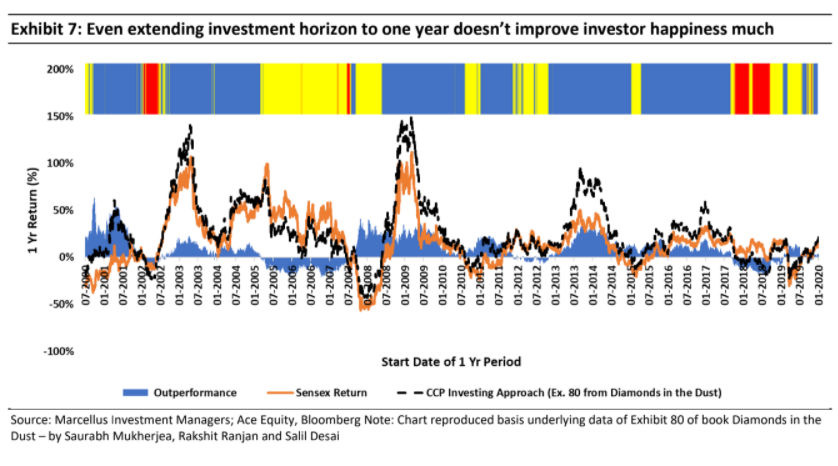
b)’12-month-horizon-investor’:
The moment the investment horizon is increased to one year from three months on the same portfolio NAV, there is a remarkable change in the shading of the horizontal bar – BLUE appears a lot more frequently (more than 50% of the times) vis-à-vis the 3-month scenario discussed above.
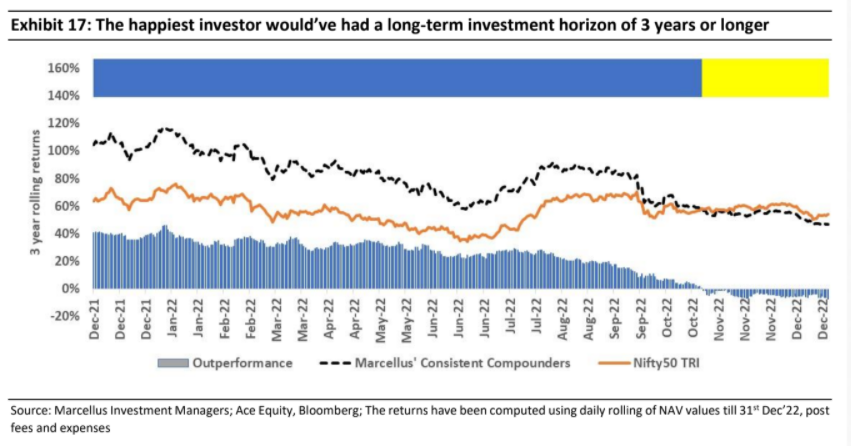
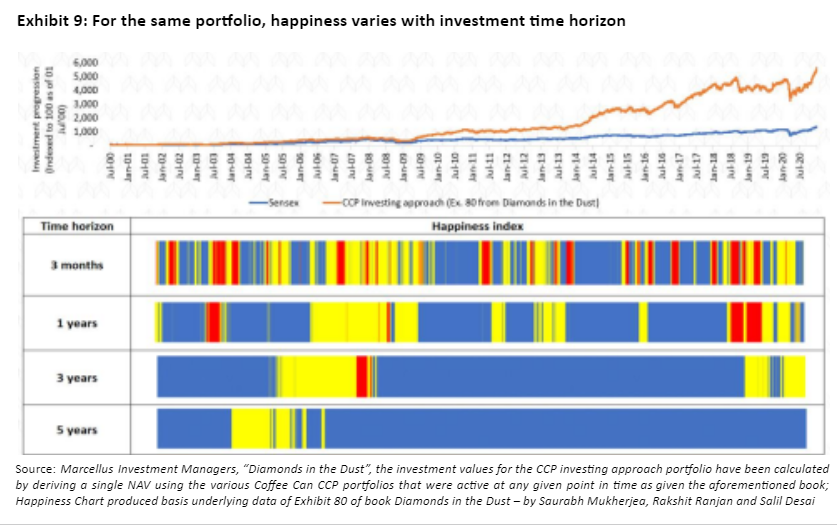
c)‘3-year-horizon-investor’ and ‘5-year-horizon-investor’:
Extending this logic to longer time frame of 3 and 5 years produces even better results as the instances of unhappiness almost disappear.
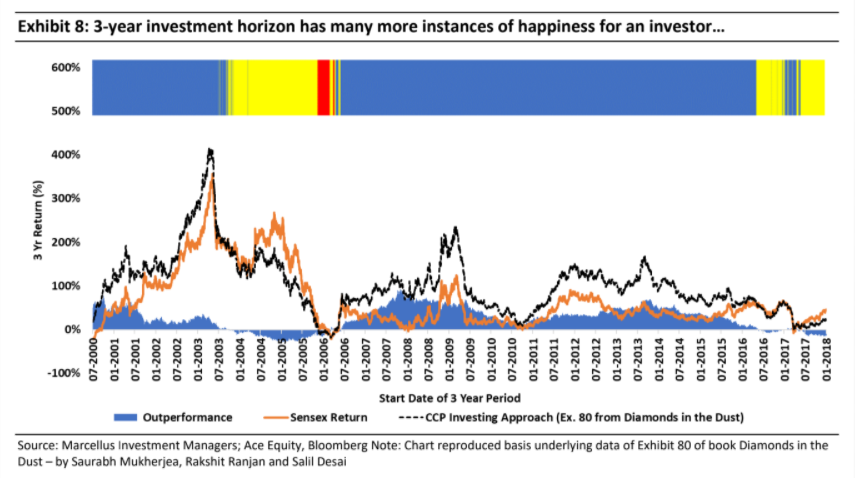
So, why does the BLUE shading (indicating happiness) increase when we stretch the time horizon out? The reason this happens is because while in short term there can be temporary dissonance between share prices of CCP companies and underlying business fundamentals (leading to underperformance on relative and/or absolute basis), as the time horizon increases such dissonance is resolved. Consequently, the longer the time horizon under consideration, the more reflective CCP portfolio returns become of business economics (vis-à- vis weaker fundamentals of the benchmark index).
In summary, for a portfolio with great long-term rate of compounding, investors can remain happy and hence invested in the portfolio throughout the investment journey only if they choose a long enough time horizon for performance assessment.
Marrying loss aversion with time horizon to compute the ‘happiness index’ of an investor
Using Kahneman’s quantification of loss aversion, let us quantify the happiness quotient for the 2×2 matrix highlighted earlier in this note. Let’s assume that the happiness quotient of the BLUE quadrant is +1 unit. And assume that in the yellow quadrants (i.e. if you undergo either an opportunity loss or a capital loss), the happiness quotient is -2 units(as Kahneman quantified that losses loom larger than gains). Finally, let’s assume that the happiness quotient of the RED quadrant (underperformance with capital erosion) is -3 units.
Now if we were to plot a ‘Happiness index’ on a cumulative basis of all sequential happiness quotients, we get some very interesting results. For the 3-month investment horizon, as there are multiple instances of unhappiness (YELLOWs and REDs) and few instances of happiness (BLUEs), the cumulative worm plot (successive additions of Happiness Quotient values basis the colours in horizontal bars in exhibit 6), never goes into the positive. This is because every instance of BLUE (which pushes the line upwards) is followed by multiple instances of YELLOW/RED which push the chart downwards.
This is how powerful the psychological concept of ‘loss aversion’ is for equity investors. Only once the investment horizon increases to 3 years or longer is there a discernible change for the better in the investor’s Happiness index.
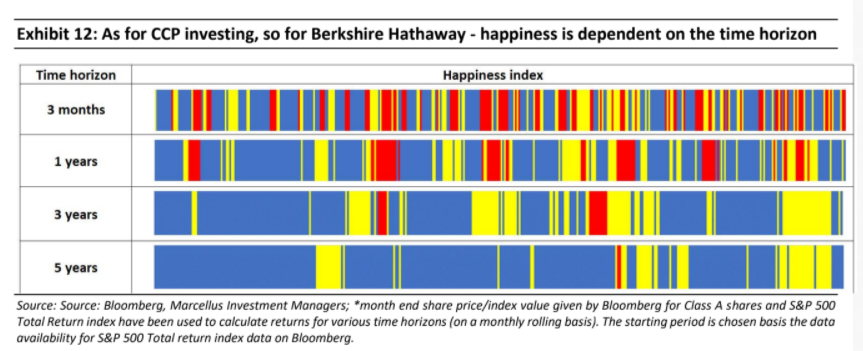
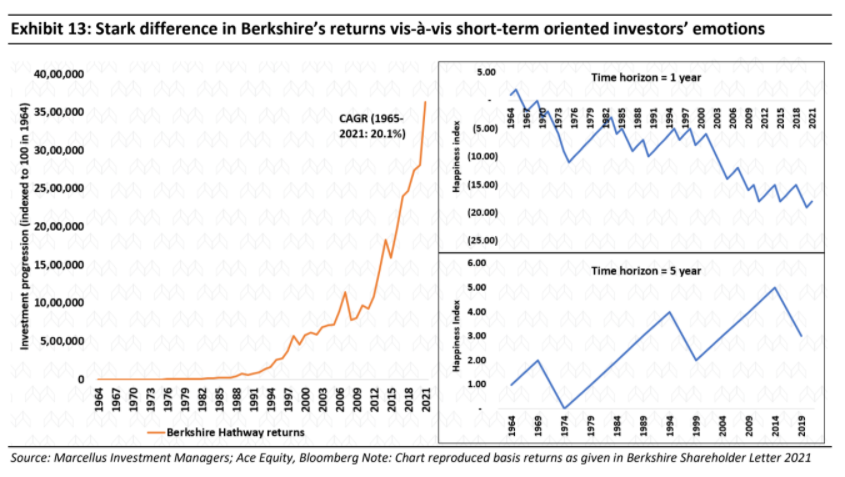
Loss aversion theory applied to a Berskhire Hathway investor produces similar results
If we were to apply the same loss aversion happiness quotients discussed above on Berkshire Hathaway over the last 60 years, the results are very similar – as highlighted in the exhibits below:
Loss aversion theory applied to a Berskhire Hathway investor produces similar results
If we were to apply the same loss aversion happiness quotients discussed above on Berkshire Hathaway over the last 60 years, the results are very similar – as highlighted in the exhibits below:
Investment Implication
At Marcellus, amidst all the noise surrounding global macro, India’s Union Budget, climate change, geo political developments, corporate governance scandals, Virat Kohli’s return to form, etc, the research analysts and fund managers have remained doggedly focused on building client portfolios for the long haul. This is important as at any point in time, there are two choices for the portfolio managers – either focus on short term attributes (which are all over media/broker reports) or long-term attributes(which actually affect a company’s competitive moat and wealth compounding potential) – as highlighted in the exhibit below.
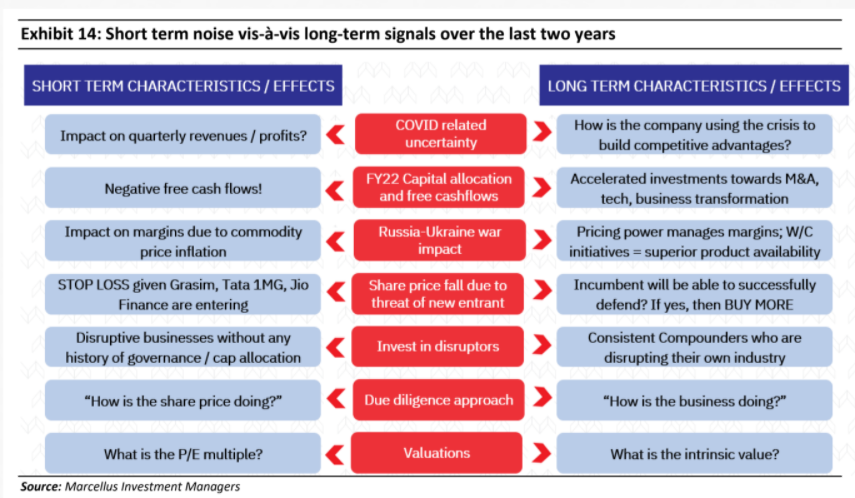
Investors should not focus on short term attributes because the loss aversion related unhappiness is bound to force short-horizon-investors to commit significant mistakes which jeopardise the long-term compounding prospects of their portfolios.