Marcellus Investment Managers - One of the Best Portfolio Management Service Companies in India
  • Region
    India USA
  • Our Philosophy
  • Offerings

    Portfolio Management Services (PMS)


    Indian Equities
    Consistent Compounders Rising Giants Little Champs Kings of Capital MeritorQ PMS Curation Portfolio
    Global Equities
    Global Compounders PMS
    Global Equities Fund (Retail)
    Multi Asset
    Multi Asset PMS

    Asset Allocation Services


    Asset Allocation        

    Portfolio Advisory Services


    Indian Equities
    MeritorQ Advisory (Smallcase)        
    Multi Asset
    Aggressive Allocation Balanced Allocation Conservative Allocation
  • Insights

    Newsletters


    Consistent Compounders Kings Of Capital Little Champs Rising Giants Marcellus Erudite MeritorQ PMS Global Compounders

    Insights


    Recents Blogs Newsletters Portfolio Updates 3 Longs and 3 Shorts

    Videos


    Featured Webinars Client Exclusive

    Podcasts


    All MeritorQ Podcasts (English) MeritorQ Podcasts (Hindi)
    Client Exclusive Content

    Others


    Client Exclusive Content Three Longs & Three Shorts Blogs Videos Media Centre
  • Resources
    Support Resources Online Access Guide Marcellus’ Forms UPI Payment
    Disclosure document GIFT City Disclosure PMS Fees Calculator
  • Team
  • PLAN YOUR GOALS
    • Invest Now
      • Portfolio Management Services (PMS)
      • Investment Advisory Services
      • Global Equities Fund (Retail)
  • Subscribe
  • Connect
  • Login
  1. Newsletter
  2. April 2021
Apr 2021 Consistent Compounders

The Science Behind Portfolio Concentration

Published on Apr 05, 2021 · 3 Min Read
Diversification in an equity portfolio reduces stock-specific risk but excessive diversification reduces returns, substantially more than it reduces risk. Marcellus’ proprietary framework for arriving at the number stocks in a portfolio is based on the most critical driver of portfolio concentration, namely, the “gradient” of the characteristics that the fund manager seeks within her coverage universe (the steeper the gradient, the fewer the number of stocks in an optimal portfolio). We elaborate on this driver of portfolio concentration in this newsletter and also discuss Titan, a new addition to our CCP portfolio.

Performance update – as on 31st March 2021

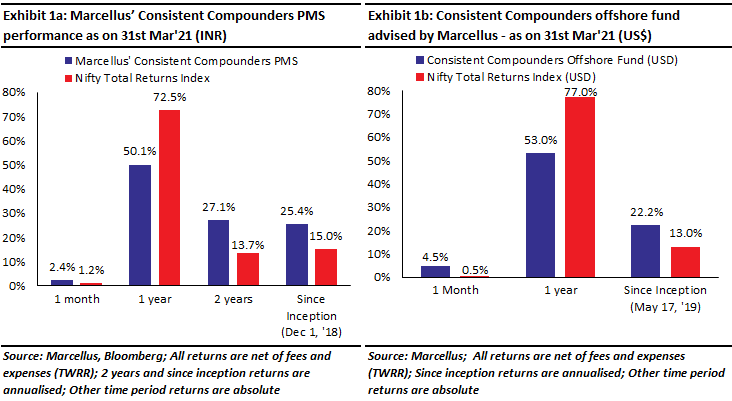
We have a coverage universe of around 25 stocks, which have historically delivered a high degree of consistency in ROCE and revenue growth rates. Our research team of eleven analysts focuses on understanding the reasons why companies in our coverage universe have consistently delivered superior financial performance. Based on this understanding, we construct a concentrated portfolio of companies with an intended average holding period of stocks of 8-10 years or longer. The latest performance of our PMS and offshore fund (USD denominated) portfolios is shown in the charts below

“Diversification may preserve wealth, but concentration builds wealth” – Warren Buffett

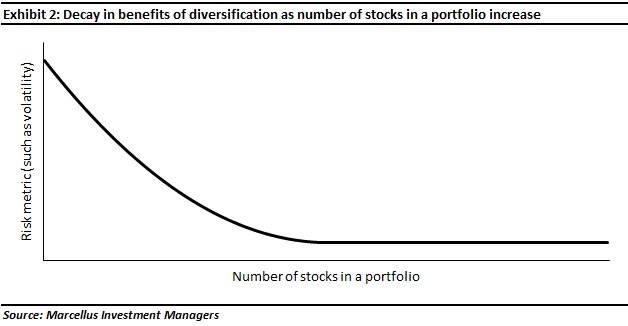
One of the main goals of portfolio construction is to optimize risk vs reward (or returns). As the number of stocks increase in a portfolio, diversification reduces the stock-specific risks involved in the portfolio. However, excessive diversification reduces returns more than it reduces risk, because: a) every incremental stock added to the portfolio is likely to be inferior in quality compared to the previous stocks in the portfolio; b) in a fundamental research-based portfolio, the wider the coverage universe, more difficult it is for the research team to conduct deep research; and c) the diversification benefits from every incremental stock added to the portfolio, reduce as the number of stocks in the portfolio increases (see exhibit 2 below).

So how many stocks in a portfolio make it optimally balanced? The answer to this question might not be a ‘one-size-fits-all’ approach. Some of the most successful funds globally call a 30-40 stock portfolio as “concentrated” and above 50 stocks in a portfolio as being over-diversified. However, there are other successful funds which view a 10-20 stock portfolio as being “concentrated” and a 30 stock portfolio as being overdiversified. For instance, in 1968, in a famous paper published in the Journal of Finance, JL Evans & SH Archer concluded that approximately 10 stocks make for a diversified portfolio, but in 1987 Meir Statman said in another landmark paper published in the Journal of Financial and Quantitative Analysis (click here) that no less than 30 stocks are needed for a well-diversified portfolio.

At Marcellus, we use our proprietary framework for arriving at the number stocks in a portfolio, based on few factors that drive portfolio concentration. One of the biggest factors in our framework is the “gradient” of the characteristics that the fund manager seeks within her coverage universe. In this newsletter we lay out the science behind this factor to optimize the risk-reward tradeoff embedded in our portfolios.

The “gradient” of characteristics that a fund philosophy seeks, and its impact on portfolio performance

There are various ways to make money in the stock market – timing cyclical stocks / buying and holding high fundamental high quality stocks / timing business turnarounds / stock-discovery based valuation expansion (i.e. P/E multiple expansion) / macro-based themes / sectoral themes / disruption-based themes / unicorn-hunt, and many more. Hence, every equity fund manager’s investment philosophy seeks a different ‘characteristic’ in the stocks that are selected in their portfolio.

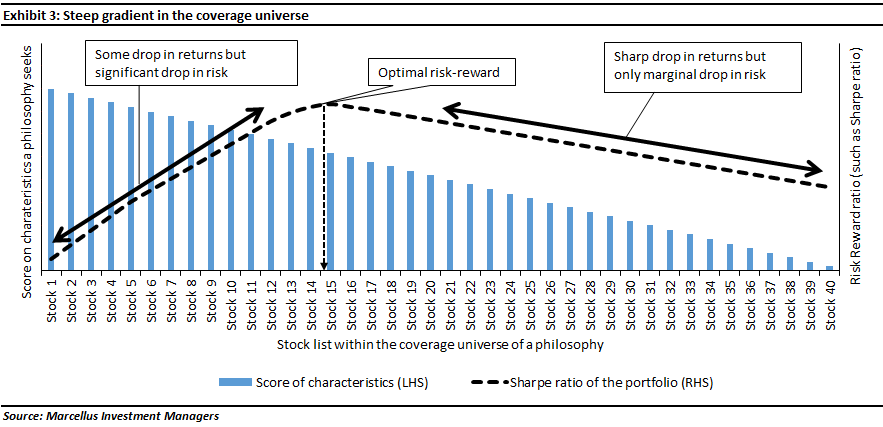
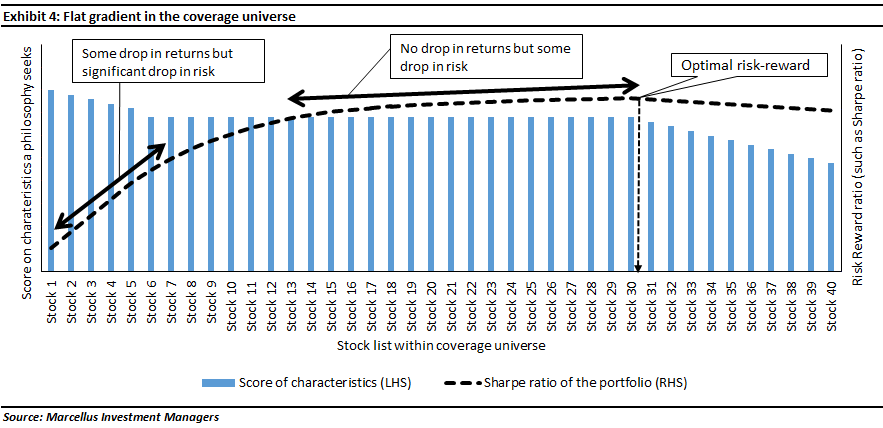
Within the coverage universe of a fund, the fund manager is likely to be more convinced about the characteristics of certain stocks compared to others. This will typically lead to a gradient of conviction across the coverage universe of such a fund manager at any point of time. As highlighted in the exhibits that follow, this gradient can either be steep, or relatively flat.

Steep gradient in the coverage universe:

Steeper this gradient, the fewer should be the number of stocks

in an optimal portfolio. This is because a steep gradient implies that every incremental stock added to the portfolio reduces the quality of the overall portfolio meaningfully. Hence, as shown in the Exhibit 3 above, the first few stocks added to the portfolio improve the risk-reward because the reduction in risk due to diversification is significantly greater than the compromise on portfolio returns. For instance, a 10-stock portfolio could be substantially less risky and hence offer better risk-reward compared to a 3-stock portfolio, despite the average characteristic score of a 10-stock portfolio (and hence the expected returns) being slightly lower than that of a 3-stock portfolio.

After having added few stocks to the portfolio, the marginal risk reduction due to diversification tapers off (as highlighted in exhibit 3 above). For instance, the concentration risk of a 30-stock portfolio is not substantially lower than that of a 20-stock portfolio. However, the expected portfolio performance of a 30-stock portfolio could be meaningfully lower than that of a 20-stock portfolio. Therefore, the compromise on portfolio returns becomes a meaningful and avoidable drag on the overall risk-reward of the portfolio after a certain number of stocks have been added in such a portfolio. For such a coverage universe (with steep gradient), it might be prudent to have no more than 10-15 stocks in the portfolio and focus on the fund manager’s depth of fundamental research to further reduce portfolio level risks, rather than relying on adding more stocks to the portfolio.

Flat gradient in the coverage universe:

The flatter this gradient, the greater should be the number of stocks in an optimal portfolio.

This is because a flat gradient implies that every incremental stock added to the portfolio does not reduce the quality of the overall portfolio. Hence, as shown in Exhibit 4 above, after the first 10-20 stocks have meaningfully improved the risk-reward, there is no deterioration in the risk-reward of the portfolio due the increase in stock list to beyond 20 stocks. This is because there is no reduction in expected portfolio returns as the number of stocks increases, whilst there is a continued marginal reduction in risk due to portfolio diversification. For instance, the concentration risk of a 30-stock portfolio is slightly lower than that of a 20-stock portfolio, despite the expected performance of a 30-stock portfolio being the same as that of a 20-stock portfolio. For such a coverage universe, it is prudent to increase the number of stocks in the portfolio to the extent that the gradient of stock characteristics remains flat in the coverage universe.

Two non-fundamental reasons for over-diversification, which jeopardise the risk-reward balance of a portfolio

Theoretically, it makes sense to play around with the “gradient” highlighted above and achieve the optimal concentration / diversification of a portfolio. However, there are two factors which have got nothing to do with either the investment philosophy or the stock fundamentals, that can drive a fund manager’s decision on number of stocks in the portfolio.

  • Depth of research:

Shallow research around understanding the characteristics of stocks in a fund’s coverage universe leads to lack of clarity around the slope of gradient (steep or flat) highlighted above. In such a scenario, the difficulty in optimising portfolio concentration usually leads to the portfolio being over-diversified.


  • Desired size of assets under management (AUM):

The maximum size of AUM that a philosophy can manage depends, amongst other factors, on how illiquid are the underlying stocks and what thresholds of illiquidity risk is the fund manager willing to take. In a philosophy where liquidity is a constraint, one of the ways to increase the size of AUM is to increase the number of stocks in the portfolio, regardless of the impact this move has on the overall risk-reward of the portfolio.

If a portfolio is over-diversified due to these two non-fundamental factors highlighted above, it is likely to deliver a poor risk-reward outcome – possibly high risk and low returns!

Investment implications – Portfolio concentration methodology of Marcellus’ CCP

Marcellus’ CCP invests in a portfolio of companies where our research team is convinced about their: a) ability to generate strong free cash flows (hence high ROCEs) through deep-rooted competitive advantages; and b) ability to consistently reinvest the free cash flows back into the business to generate growth without any dilution in ROCEs over long periods of time.

There are not too many firms in India which fit this characteristic and hence our CCP philosophy’s coverage universe is very small. In fact this characteristic is so rare in India that our 26th February 2021 analysis (click here for more details) shows that “the top 20 profit generators in India (“the Leviathans”) now account for 90% of the country’s corporate profits. Beyond dominating the country’s profit pool, the Leviathans also reinvest these profits far more efficiently back into their businesses. By doing this over the last 25 years, the Leviathans have also widened the RoE gap between them and India Inc.”

Since only a handful of companies in India possess the characteristics that we seek in Marcellus’ CCP portfolio, the coverage universe of Marcellus’ CCP portfolio has a steep gradient, similar to what is highlighted in exhibit 3 above.

Our depth of research helps us identify and quantify the gradient of characteristics discussed above in order to optimize our portfolio concentration / diversification and hence aim to deliver healthy rate of compounding without much volatility, consistently over the longer term. We currently have a portfolio of only 14 stocks, which we believe is both diversified enough to minimize the risk, and is concentrated enough to focus on healthy rate of compounding – i.e. aimed to achieve an arbitrage of low risk, healthy return over long periods of time.

Changes made to Marcellus CCP Portfolio – addition of Titan as a new stock

Last month, we added Titan Company as a new stock to Marcellus’ CCP Portfolio. Titan’s biggest strengths lie in its ability to: a) execute retail expansion whilst maintaining high store level and corporate level ROCE; and b) leverage on quality-oriented trust built around the Tata brand. In addition to this, the firm has successfully strengthened its jewellery merchandise by expanding successfully into wedding jewellery, by expanding gold exchange (as a substitute for gold-on-lease) for a large part of their raw material procurement, and by acquiring a majority stake in Caratlane, an online jewellery franchise which is expanding rapidly, successfully and profitably across ecommerce, omni-channel and brick and mortar formats. Titan Eyeplus has also been turned around through in-house manufacturing of the merchandise, closure of unviable store locations and tech investments to improve customer service. The ongoing shift of market share from unorganised to organised jewellers is a significant positive for Titan. Covid-19 related disruptions faced by both mom & pop jewellers as well as smaller organised chains provides a significant tailwind to Titan in the form of market share gains over the next few years. The firm has delivered a revenue CAGR of 16% over FY10-20 and 17% over FY17-20. Earnings CAGR over the same time periods has been 20% and 53% respectively. Titan’s average ROCE has been 34% over FY17-20 and 42% over FY10-20. We expect the firm to deliver healthy and consistent earnings growth with ROCEs substantially higher than cost of capital over the long term in future.
Regards
Team Marcellus
Disclaimer:

Copyright © 2026 Marcellus Investment Managers Pvt Ltd, All rights reserved

Note: the above material is neither investment research, nor investment advice. Marcellus does not seek payment for or business from this material/email in any shape or form. Marcellus Investment Managers Private Limited (“Marcellus”) is regulated by the Securities and Exchange Board of India (“SEBI”) as a provider of Portfolio Management Services. Marcellus is also a US Securities & Exchange Commission (“US SEC”) registered Investment Advisor. No content of this publication including the performance related information is verified by SEBI or US SEC. If any recipient or reader of this material is based outside India and USA, please note that Marcellus may not be regulated in such jurisdiction and this material is not a solicitation to use Marcellus’s services. This communication is confidential and privileged and is directed to and for the use of the addressee only. The recipient, if not the addressee, should not use this material if erroneously received, and access and use of this material in any manner by anyone other than the addressee is unauthorized. If you are not the intended recipient, please notify the sender by return email and immediately destroy all copies of this message and any attachments and delete it from your computer system, permanently. No liability whatsoever is assumed by Marcellus as a result of the recipient or any other person relying upon the opinion unless otherwise agreed in writing. The recipient acknowledges that Marcellus may be unable to exercise control or ensure or guarantee the integrity of the text of the material/email message and the text is not warranted as to its completeness and accuracy. The material, names and branding of the investment style do not provide any impression or a claim that these products/strategies achieve the respective objectives. Further, past performance is not indicative of future results. Marcellus and/or its associates, the authors of this material (including their relatives) may have financial interest by way of investments in the companies covered in this material. Marcellus does not receive compensation from the companies for their coverage in this material. Marcellus does not provide any market making service to any company covered in this material. In the past 12 months, Marcellus and its associates have never i) managed or co-managed any public offering of securities; ii) have not offered investment banking or merchant banking or brokerage services; or iii) have received any compensation or other benefits from the company or third party in connection with this coverage. Authors of this material have never served the companies in a capacity of a director, officer or an employee.

This material may contain confidential or proprietary information and user shall take prior written consent from Marcellus before any reproduction in any form.

Regards, Team Marcellus

If you want to read our other published material, please visit https://marcellus.in/pms-investment-blog/


Copyright © 2026 Marcellus Investment Managers Pvt Ltd, All rights reserved


RELATED NEWSLETTERS

  • Aug 12, 2026

    Marcellus Portfolio Updates & Insights – August 2026

    READ MORE
  • Aug 06, 2026

    Global Compounders: Why have we underperformed the S&P500 in 2026?

    READ MORE
  • Jul 27, 2026

    Isaac Newton and the Madness of Men

    READ MORE

RELATED NEWSLETTERS

  • Aug 12, 2026

    Marcellus Portfolio Updates & Insights – August 2026

    READ MORE READ MORE
  • Aug 06, 2026

    Global Compounders: Why have we underperformed the S&P500 in 2026?

    READ MORE READ MORE
  • Jul 27, 2026

    Isaac Newton and the Madness of Men

    READ MORE READ MORE
PREV ISSUE

Why General Insurers get free money and why we hold ICICI Lombard


Published on Mar 18, 2021
NEXT ISSUE

Spotlighting Amrutanjan Healthcare


Published on Apr 09, 2021

Did`t receive OTP? 00:00 Resend
Be the First to Know

Marcellus logo

At Marcellus, our Purpose is to make wealth creation simple and accessible by being trustworthy and transparent capital allocators.

  • Twitter-Marcellus Investment
  • LinkedIn-Marcellus Investment

Marcellus Investment Managers Private Limited

Please reach out to us at

Board Line : 0806-9199-400

Sales Desk: 0806-9199-401

e-mail: invest@marcellus.in


Marcellus Investment Managers
102, First Floor, Boston House, Suren Road,
Near 'Western Express Highway' Metro Station,
Andheri East, Mumbai 400093

Please reach out to us at

e-mail: help.gift@marcellus.in


Marcellus Investment Managers
IFSC Branch – Unit no. 431 and 432, Signature Building, Fourth Floor, Block 13B, Zone-1, GIFT SEZ, GIFT City, Gandhinagar – 382 355/382 050

  • Home
  • Our Team
  • Invest with us
  • GIFT City Corporate Disclosures
  • Marketing Disclosure
  • Investing Books
  • FAQs
  • Videos
  • Newsletters
  • Corporate Regulatory Disclosure
  • Company Information
  • Terms & Conditions
  • Privacy Policy
  • Responsible Investing
  • Contact Us

2026 © | All rights reserved.

Privacy Policy | Terms and Conditions

Please read the following carefully and select your residency jurisdiction


If accessing this website by giving false declaration, the person shall be solely liable/responsible for any adverse consequences suffered, legally as well as financially, pursuant to use of any information contained in this website

Beware of fraudulent websites and applications!

Marcellus or its employees will never ask you to join WhatsApp groups or social media accounts created by or on behalf of Marcellus. Marcellus does not have any App facilitating trading in securities, nor does Marcellus issue any advertisement for investment in any specific stocks or for any cash transactions.

If you come across any such activity, please report to the appropriate law enforcement authorities, and inform us on compliance@marcellus.in.

Click here for the list of our official social media handles.

Close