Expected impact of the COVID-19 second wave and raw material cost inflation
Our portfolio companies sell products and services which are small-ticket day-to-day essentials. These firms have also made superior investments in systems and processes compared to their competitors over the past 12 months. Hence, their better preparedness in dealing with the lockdowns related to COVID-19 second wave over the last few weeks has further accelerated the prospects of market share gains.
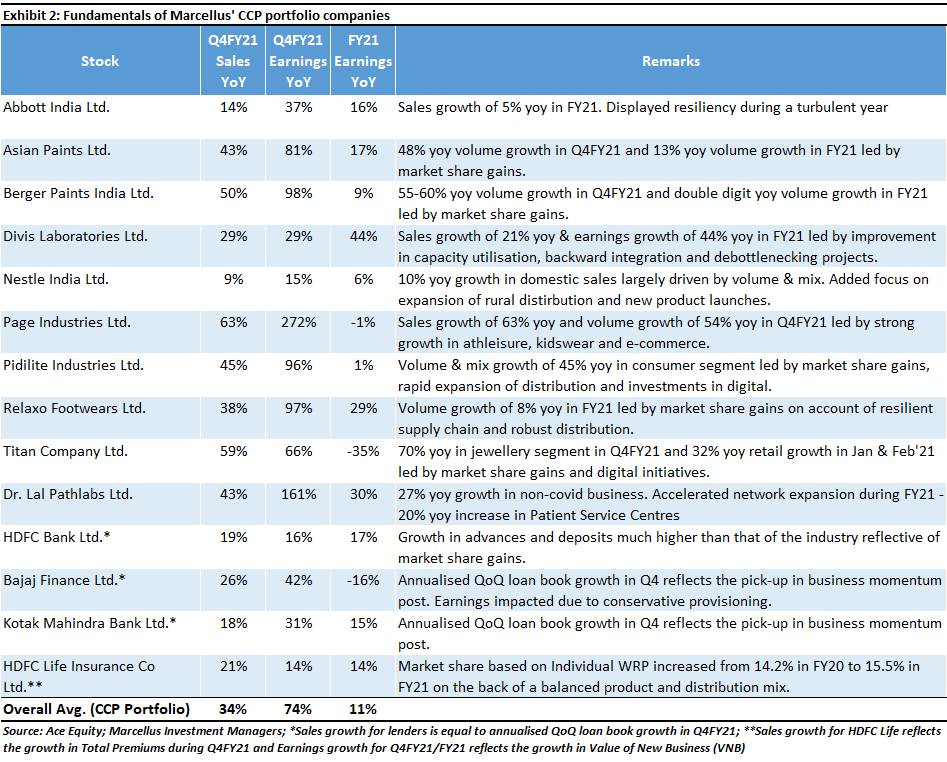
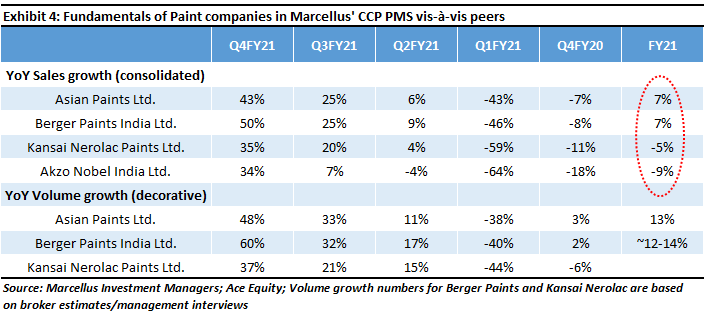
There is significant inflation in raw material costs for some of our portfolio companies. This again has more positive than negative implications for their fundamentals due to two reasons. Firstly, as the classical text book definition of pricing power goes – ‘Companies with high pricing power are able to hike their product prices to offset the impact of raw material cost inflation on their margins, without losing market share in the process’. CCP companies have, time and again, demonstrated superior pricing power vs competitors. Secondly, as we had highlighted in our 1st June 2020 newsletter, several firms in Marcellus’ CCP Portfolio avoid hiking product prices meaningfully. These companies focus on deriving incremental operating efficiencies, thereby negating the need to hike product prices, which in turn suffocates their competitors over time. For instance, the MD & CEO of Asian Paints said in the firm’s 4QFY21 results announcement – “The huge inflationary trend in raw material prices has been worrying. However, its impact on profitability has been negated with some path-breaking work on sourcing and cost optimization.”
Investment implications – ‘Consistent Compounding’ of free cash flows in an uncertain world
There have been several black swan / disruptive events for the broader economy over the last five years – demonetization, GST implementation, the IL&FS financial crisis, the Covid-19 pandemic, etc. As we had highlighted in Exhibit 4 of our 1st March 2020 newsletter (click here), whilst there was no profit growth for Nifty50 companies over FY15-20, our portfolio companies delivered around 20% CAGR in profits over the same time period.
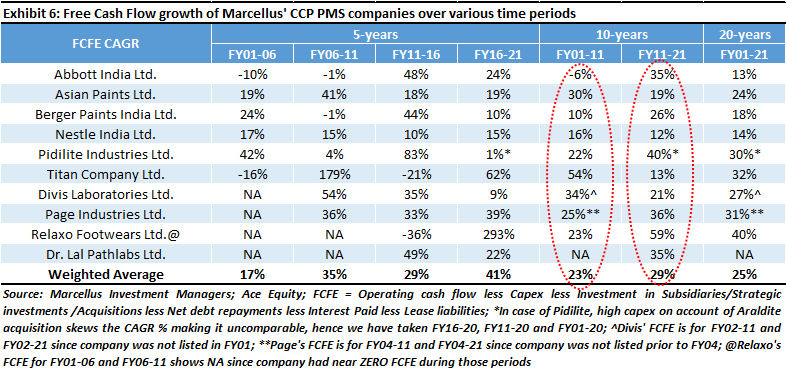
In addition to healthy earnings growth in the past, our portfolio companies have also maintained their ROCEs (Returns on Capital Employed) at around 35% on average. Over time, these ROCEs have increased due to an improvement in asset turnover and reduction in working capital cycles, without compromising on the rate at which profits are re-invested back into the business. The combined effect of expansion in ROCEs with healthy earnings growth rates is reflected in the rate at which free cash flows have grown for our portfolio companies historically – as highlighted in the table below.