Buying the Consistent Compounders and holding them for long time periods becomes a difficult exercise asinvestors are bombarded with newsflow and the apprehensions which come with newsflow. As a result,investors tend to do injustice to the size of their allocation to the Consistent Compounders and the length of the holding period of this portfolio. The solution is to have greater conviction on the sustainable competitive advantages of these companies.
“That’s been one of my mantras — focus and simplicity. Simple can be harder than complex: You have to work hard to get your thinking clean to make it simple. But it’s worth it in the end because once you get there, you can move mountains.”- Steve Jobs, BusinessWeek, May 25, 1998
Consider the following factual statements – “Asian Paints has reported annualised earnings growth of 15% over the past 5 years, 20% over the past 10 years and 21% over the past 15 years. As a result, its annualised share price return has been 22% over the past five years, 34% over the past 10 years, and 30% over the past 15 years. In addition to this, the stock also delivered 1.5-2% annualised dividend yield. All that an investor had to do was hold on to Asian Paints in his portfolio and he would have compounded his wealth at a very healthy pace without much volatility.”
The set of statements above sound very simple, and one would presume that many investors who bought Asian Paints 10-15 years ago would have enjoyed this consistent and healthy compounding. Unsurprisingly therefore many clients ask us about why our simple philosophy of Consistent Compounders is not easy for someone to replicate.
I have been covering Asian Paints an equity analyst for almost a decade now, and hence I have had the experience of going through the reams of newsflow which challenged the conviction of Asian Paints’ shareholders. Here is how it felt like, to a shareholder of Asian Paints –
March 2007 – Asian Paints’ share price has compounded at 29% CAGR over the last 5 years, and at 21% CAGR over the last 10 years. Its P/E multiple is at a 30% premium to its 10 year historical average, 20% premium to its 5 year historical average, and it is trading at twice the P/E multiple of its closest rival Berger Paints! Is Asian Paints overvalued?
• April 2007 – Sherwin Williams, world’s largest paint company has entered India. In a press article (click here) the CEO of Sherwin Williams India confidently says that by having access to modern technology and global range of products, the firm will grow by leaps and bounds in India. Is it time to sell Asian Paints?
• 2008 – Promoters have decided to step down from their executive positions completely! P.M. Murty, who had recently retired from Asian Paints, has been brought back in as the CEO (click here). Is this the next example of an Indian company losing its competitive edge once it transitions from a promoter-led to professionals-led organisation?
• 2008-09 – Crude oil price touched $145 per barrel in July 2008, fell sharply to $35 by December 2008 and rose back up to $70 by July 2009. Asian Paints’ share price fell by ~35%, as the broader markets tumbled by ~60% in FY09. The firm reported an EBITDA margin of only 9% in the quarter ending December 2008, one of the lowest ever margins reported since the firm was listed in 1983! Should shareholders book profits?
• 2011 – FY11 earnings declined by 0.2% YoY. Price hike taken by Asian Paints over 2010 and 2011 has been as high as 25%! Will this back-fire due to price elasticity of demand and hence adverse impact on volume growth rates?
• 2011-2012 – Berger grew volumes at 18% in FY11 (vs 17% for Asian Paints) and by 15% in FY12 (vs 13% for Asian Paints). Berger is gaining market share from Asian Paints!
• 2012 – All paint companies have announced aggressive capacity expansion plans which will more than double the industry’s capacity over the next 2-3 years. Most brokerages believe that this over-supply will result in competition intensifying as firms try to increase their capacity utilisation levels.
• 2013 – One of the promoter families (Dani family) have pledged their stake to buy more shares from the open market! There are rumours of disputes amongst the promoter families which can blow out of proportion over the next few months / years!
• 2013 – Erstwhile market leader Shalimar is planning to make a comeback (click here)!
• 2013 – Rupee has depreciated against the US Dollar from an exchange rate of Rs 44 / USD in Aug’11 to Rs 65 / USD in Sept’13! Asian Paints imports ~40% of its raw materials. Will its margins decline?
• 2013-14 – Asian Paints has bought Sleek in kitchenware (Mar’13) and Ess Ess in sanitaryware (Apr’14)! Two unrelated acquisitions! Is this the start of capital misallocation due to complacency? Remember how Asian Paints’ acquisition of the Berger International (17 countries) did not work out12 years ago?
• 2014– Valuations! Look at the P/E multiple – It is at 45x, 50% higher than the last 5 years’ average and at 25% premium to Berger’s valuations!
• 2014- Akzo Nobel India has got a new management, over ~US$1bn of surplus capital, and the management is talking about very aggressive plans in their presentation to shareholders!
• 2016– Crude oil has fallen from $100 to $30. Chinese Renminbi has been devalued overnight. Although there is margin expansion for Asian Paints, the firm has cut its prices so significantly that revenue growth is down to single digits! This clearly suggests low pricing power – they can’t hold onto input cost tailwinds!
• 2016– Demonetisation will structurally affect the home building materials industry. New housing demand will fall. People who used to get their walls repainted only because they had black money lying in the drawers of their wardrobe, will elongate their repainting cycles!
• 2017– A sell side analyst told me that Asian Paints’ management has always been very arrogant (“look at how they laugh at analysts in the quarterly calls”). And now this analyst’s channel checks suggest that the dealer network has had enough of this arrogance. Channel relationships are weakening, leading to the recent underperformance in fundamentals.
• 2017– GST – Paints is in the highest bracket of GST rates!
• 2017-18– Quarter after quarter, Kansai Nerolac’s management comes on TV and reports ~10-20% volume growth when Asian Paints reports only 0-10% volume growth; Kansai Nerolac’s product Soldier appears to be taking market share away from Asian Paints!
• 2017– Jalaj Dani has resigned! Is there friction amongst promoters?
• 2017– JSW (Sajjan Jindal group) is investing Rs 1,000 crores in paints to take on Asian Paints (click here).
• 2018– Crude oil price has spiked up to US$8 per barrel. Rupee has depreciated to Rs75 per USD. Asian Paints’ margins are down 200-400bps YoY and earnings growth is down to only 5% in FY18.
We can safely assume that the list mentioned above is neither exhaustive for Asian Paints (we didn’t add to it election outcomes, Indo-Pak tensions, Donald Trump, real estate downturn, etc!), nor is it limited to only Asian Paints. In fact, shareholders in every listed stock undergo a similar experience. Within our portfolio, Page Industries is undergoing such apprehensions currently, Dr. Lal Pathlabs was undergoing such apprehensions a year ago, HDFC Bank will undergo such apprehensions once Aditya Puri retires – there is no end to this list.
99% of the companies in the listed universe do not have an exceptionally strong pricing power and are not institutionalised moated franchises. Such companies are susceptible to volatility in their fundamentals at frequent intervals due to such newsflow / events. Hence, it makes sense for a shareholder to decide entry and exit points in these 99% companies, based on some of these evolutionary or disruptive events happening in or around these companies.
For the balance 1% of the listed universe – the companies that we call ‘Consistent Compounders’ – the depth of the moat / competitive advantages / pricing power ensures that they manage to disconnect their fundamentals from any such headwinds.
However, while investing in a portfolio of Consistent Compounders, investors tend to make two types of mistakes when faced with the string of newsflow highlighted above:
1.Lack of concentration:
Without digging deep into understanding the DNA of a firm, it becomes difficult to build conviction on whether a particular firm is a Consistent Compounder in the first place or not (see difference between Type B and Type C companies discussed in our recent blog on the subject). As a result, investors might not allocate enough to Consistent Compounders in their overall stock exposure, and hence although many portfolios will have an Asian Paints or an HDFC Bank as a holding, the beauty of a Consistent Compounder gets diluted by holdings in several other companies which are not Consistent Compounders.
2. Short holding periods:
As the intensity of newsflow strikes, apprehensions lead to an investor selling out of a Consistent Compounder too soon and hence don’t benefit from the power of compounding of a long enough holding period of such stocks.
Hence, while we aspire to give our clients 20-25% portfolio compounding with volatility in returns (of a 3 year or longer holding period) similar to that of a Government Bond, we should be aware that the journey will always contain reams of news flow and (mis)apprehensions which will keep testing our conviction on the portfolio companies. On most occasions, the best decision might be to keep your seat belts fastened and ‘do
Performance update – Marcellus’ Consistent Compounders PMS – as on 31st March 2019nothing’ with the portfolio.
Given the longevity of fundamentals of our portfolio companies, we don’t expect the portfolio to churn more than one stock per year on an average (i.e., no more than 5-10% expected average churn annually). We did not make any changes to our clients’ portfolio in March 2019. 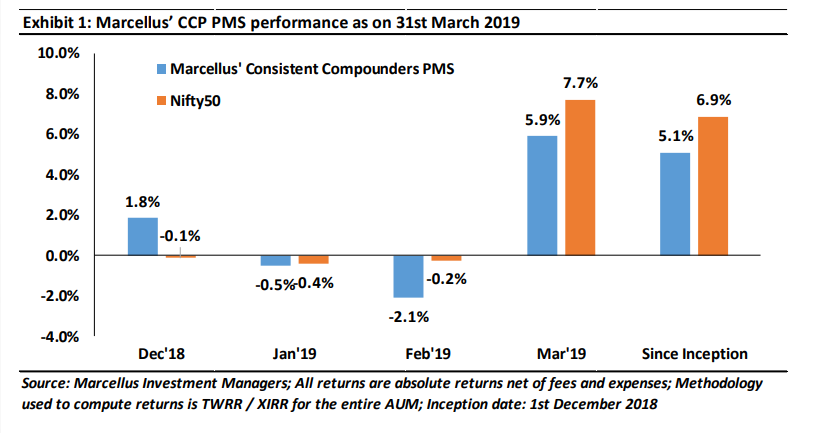 If you want to read our other published material, please click here Note: the above material is neither investment research, nor investment advice. Marcellus does not seek payment for or business from this email in any shape or form. Marcellus Investment Managers is regulated by the Securities and Exchange Board of India as a provider of Portfolio Management Services and as an Investment Advisor. Copyright © 2018 Marcellus Investment Managers Pvt Ltd, All rights reserved. This communication is confidential and privileged and is directed to and for the use of the addressee only. The recipient if not the addressee should not use this message if erroneously received, and access and use of this e-mail in any manner by anyone other than the addressee is unauthorised. If you are not the intended recipient, please notify the sender by return email and immediately destroy all copies of this message and any attachments and delete it from your computer system, permanently. Any opinions or advice contained in this email are subject to the terms and conditions expressed in a duly executed contract or written agreement between Marcellus Investment Managers Private Limited and the intended recipient. No liability whatsoever is assumed by the sender as a result of the recipient or any other person relying upon the opinion unless otherwise agreed in writing. The recipient acknowledges that Marcellus Investment Managers Private Limited may be unable to exercise control or ensure or guarantee the integrity of the text of the email message and the text is not warranted as to its completeness and accuracy.

