Capital reinvestments, including tech investments, drive incremental deepening of the Consistent Compounders’ (CCPs’) competitive advantages. This increases the importance of free cashflows in understanding the fundamentals and hence the valuations of our portfolio companies. Over the last 5 / 10 / 20 years, the free cashflows of our portfolio companies have grown consistently at around 25% CAGR, fully supporting their share price compounding over the same period. These remarkable cash generation engines are rarities in the Indian market – only 15% of the BSE500 companies have delivered positive free cashflows consistently on a three-year rolling basis, over the past 20 years.
Performance update – as on 30th June 2021
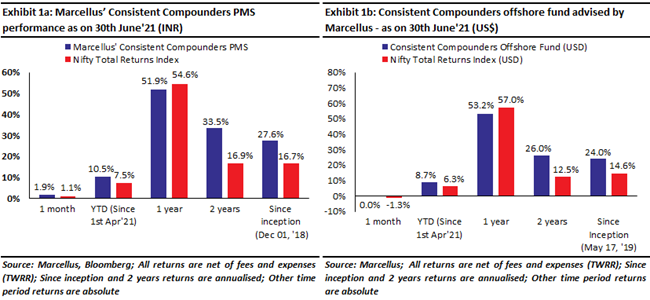
We have a coverage universe of around 25 stocks, which have historically delivered a high degree of consistency in ROCE and revenue growth rates. Our research team of eleven analysts focuses on understanding the reasons why companies in our coverage universe have consistently delivered superior financial performance. Based on this understanding, we construct a concentrated portfolio of companies with an intended average holding period of stocks of 8-10 years or longer. The latest performance of our PMS and offshore fund (USD denominated) portfolios is shown in the charts below.
Free cash flows vs Earnings growth – a 2×2 matrix for non-financials companies
Free cashflow generation, simply put, is the difference between ‘profits’ of a company and ‘capital investments’ around working capital and capital expenditure. These are two distinct dimensions of business execution. Note, however, that this definition of free cash flows does not apply to lenders or insurers in the Financial Services sector.
The ability of a company to deliver on the first dimension, which is ‘profits’, is determined by attributes such as its pricing power (i.e., how the firm beats its competitors to gain market share without compromising on its profits) and operating efficiencies (i.e. how the firm achieves the same revenues as its competitors but with lower expenses).
The second dimension of free cashflow generation is ‘capital investments’, which is dependent on the company’s capital efficiencies (how can the existing capital resources be used more optimally to generate higher revenues and profits) and capital reinvestment (what are the incremental areas of capital reinvestment to help grow the business in the future).
The fair valuation of a company is the net present value of all its expected future cash flows. The higher the quantum, growth, and longevity of these free cashflows, the greater is the fair value of the business. Hence, investment in a portfolio of high-quality stocks requires conviction in the ability of these companies to generate strong, positive, and growing free cashflows in future (because it is these cashflows which finance the growth in revenues in the years to come).
However, a simple analysis of historical free cashflow generation of the BSE500 universe of stocks highlights some interesting aspects of these businesses. [Note: in our analysis, we have taken cumulative three-year free cashflows since a single year’s free cash flow can be negative if a company does large capex in a given year.]
There are 422 non-lending and non-insurance businesses in the current BSE500 Index. Since free cashflows cannot be analyzed for lending and insurance businesses, we will omit them from this analysis. Of these, only 65 (i.e., a mere 15%) delivered positive free cashflows consistently on a three-year rolling basis, over the past 20 years. Remarkably, even on a 20-year cumulative basis, there are 89 companies that have generated negative free cashflows.
Lack of positive free cash flow generation is NOT always a sign of weakness though. During the early stages of a business’ evolution, there is bound to be more capital investments compared to operating profits since the company might be aggressively investing in building capacities and capabilities.
Similarly, consistent positive free cashflows is also NOT always a sign of significant strength. If a business has strong enough pricing power to generate profits but cannot find avenues for capital redeployment, then the absence of capex will lead to positive free cashflows. However, such a business might not be able to grow over time. Here is a 2×2 matrix categorizing different types of businesses based on their free cash generation and earnings growth.
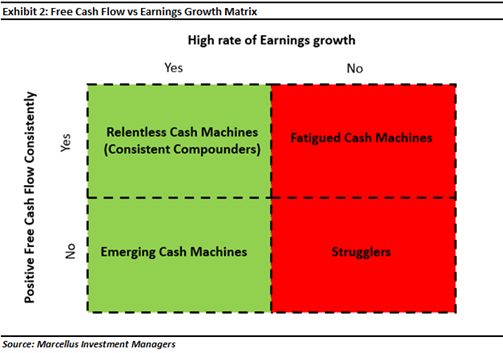
Relentless Cash Machines (CCPs) – high earnings growth and consistently positive free cash flows:
These companies sustain high pricing power (and hence high ROCEs) over long periods of time. They also redeploy large parts (typically 40-70%) of their surplus capital back into their business to help grow revenues, profits and free cashflows. Thanks to scale efficiencies and high ROCEs, operating profits of these companies are higher than the amount of capital they need to redeploy back into the business to generate growth. Since these companies are already generating healthy and positive free cashflows, their share prices are more aligned to their free cashflows rather than to their profits (although for many such companies, profits and free cashflows might grow at the same pace). Their free cashflows and hence share prices exhibit a high rate of compounding with low volatility. The fair valuation of these companies is largely dependent on the longevity of strong free cashflow compounding.
These companies are a very small minority of the listed universe.
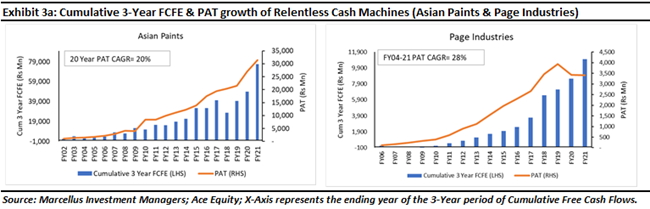
All of Marcellus’ Consistent Compounders portfolio companies are Relentless Cash Machines. Asian Paints and Page Industries are good examples of such companies – see exhibit below.
Emerging Cash Machines – high earnings growth but inconsistent free cash flows:
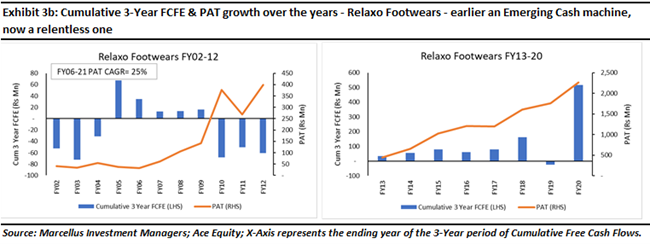
These companies typically are relatively early in their business evolution cycle (i.e. they are younger businesses than the Relentless Cash Machines) and perhaps also smaller in size. Their capex investments are significant, compared to their profits and they might not have yet achieved significant economies of scale. If these companies generate high ROCEs and have tangible high pricing power even as they scale up, they are likely to transition into Relentless Cash Machines in future. For an investor in these companies, free cashflow forecasting and hence valuations need to factor in: a) conviction on when they will start generating consistently positive free cashflows; and b) quantum and longevity of free cash flow generation in future. These companies are also a small minority of the listed universe, most of them belong to the small-midcap segment rather than the large caps segments. For instance, Relaxo Footwears was an Emerging Cash Machine until a decade ago (and has been a Relentless Cash Machine over the last decade) – see exhibit below. Several of our Little Champs Portfolio companies fall in this category.
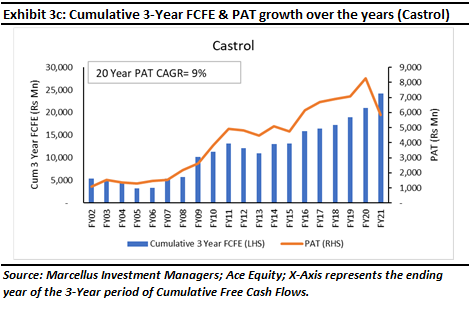
Fatigued Cash Machines – weak earnings growth despite consistently positive free cashflows:
Although these companies are profitable in their core business (many of them will have high ROCEs as well), they cannot find enough avenues for capital redeployment to grow their businesses. Their free cashflows are strong and positive due to low or rates of capital redeployment. Some of these companies might have once belonged to the category of Relentless Cash Machines but subsequently faced saturation in their core businesses. It is worth noting that as a Relentless Cash Machine transitions into a Fatigued Cash Machine, their free cashflows might continue to grow at a healthy pace, temporarily though, because of a sharp drop in capital reinvestment rates. Many such companies are part of the large-cap universe of listed equities in India. For investors, it is important to recognize the lethargy or fatigue in these companies in order to avoid being attracted by their free cash generation or to avoid being attracted by their glorious past. We have often seem investors dilute the quality of their equity portfolio failing to exit from a company which used to be – once upon a time – Relentless Cash Machine, but has now become more like a Fatigued Cash Machine. Castrol is one such example of such companies which are highly cash generative, but with very low capital reinvestment rates and hence relatively weak earnings growth – see exhibit below.
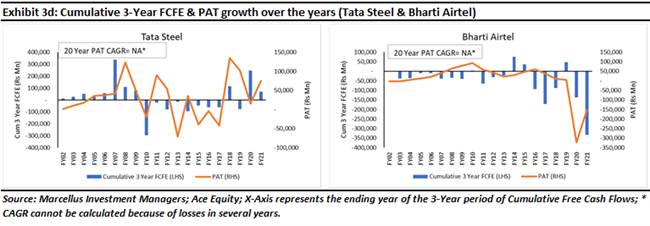
Strugglers (the biggest part of the Indian stock market) – weak earnings growth and negative or zero free cash flows:
These companies form the largest part of the Indian stock market. Their low pricing power results in weak earnings compounding over time. Their capital misallocation results in poor ROCEs on incremental capital deployed which in turn ensures weak/negative and inconsistent free cash flows. These companies can generate wealth compounding for investors only if the investor correctly times the entry and exit from their stock over relatively short holding periods. Investing in these companies is exciting given the risks around their fundamentals at any point of time. However, investing in these companies can be damaging to an investor’s wealth if the investor is not an expert at playing these timing related risks well enough. These companies are part of all segments (large/mid/ small cap) of the stock market. Historical fundamentals of firms like Tata Steel and Bharti Airtel are representative of this category – see exhibit below.
Importance of free cashflows in technology-oriented companies:
Over the last decade, several companies have accelerated tech investments in their business to deepen their competitive advantages. With high penetration of telecom networks in India, and with events like demonetization, GST introduction and the Covid-19 crisis accelerating the adoption of technology in various parts of the economy, we expect this trend towards tech investments for successful companies, to accelerate further over the next decade. These tech investments typically include R&D spends, manufacturing automation, sales force automation, use of predictive analytics and business development/customer service related tech investments to the end customer to build loyalty, and other such intangible aspects of the business, etc. We have witnessed several examples of these investments in our Consistent Compounders portfolio.
For example, over the past 3 years, Page Industries has automated the servicing of its distributors. It has provided its channel partners and sales executives with hardware such as tablets to complement the automation software implemented in the Sales function. It has also started outsourcing the manufacturing of certain products where its competitive advantages are not related to in-house manufacturing.
On the other hand, Asian Paints has invested heavily in home décor services, omni channel retail including digital platforms such as www.beautifulhomes.com to complement its AP Homes brick and mortar retail network. It has also invested heavily in automation of its manufacturing plants.
Firms like Dr. Lal Pathlabs have started a journey of transitioning through tech investments towards a more asset light model, towards home collection oriented competitive advantages, and towards a differentiated digital interface with the end customer.
Several of these investments do NOT feature as capex on the balance sheet. They are expensed through the P&L and hence could artificially suppress the earnings growth of these businesses, without having any adverse impact on their free cash flow generation. As long the overall capital reinvestment in the business is not moderating, and as long as the free cashflows are compounding at a healthy pace, such artificial compression of profits due to tech investments is not a cause of concern for investors.
Several ‘Relentless Cash Machines’ will retain this classification in a tech-disrupted world only if they incrementally strengthen their business models with the use of technology. Hence, due to the aspect of fundamentals of a tech-orientated business highlighted above, it is even more important for investors to focus on free cash flow compounding (rather than focusing only earnings compounding) in future.
Investment implications – Valuations and share price performance of Marcellus’ Consistent Compounders aka Relentless Cash Machines
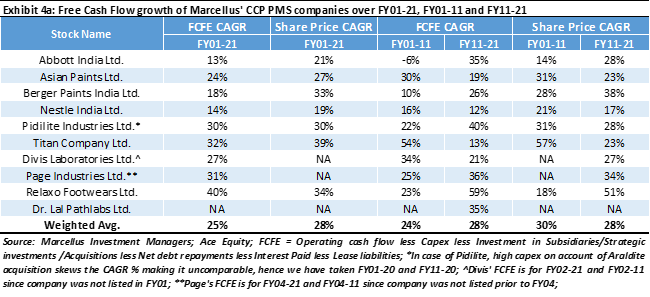
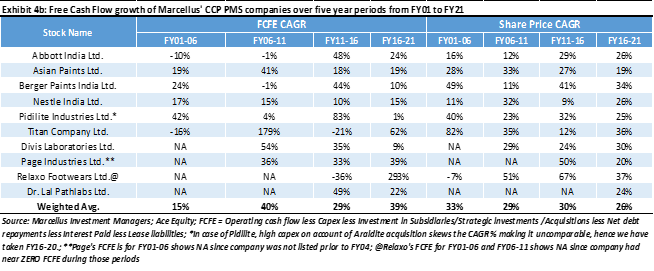
The two exhibits above show the compounding of Free Cash Flows of the non-Financial Services companies in Marcellus’ CCP portfolio and how that compares against their historical share price performance. The following are the key conclusions from these exhibits:
1. Free cashflow compounding of these stocks has been healthy and consistent at around 25% CAGR over the past 20 years – regardless of whether one considers any 5 year or 10 year time periods. The share prices of these companies have moved in sync with their free cashflow compounding over the entirety of the last 20 years, including the last five years. Hence, the multiple of price to free cashflow for these companies has remained largely unchanged over the last 20 years.
2. The compounding rate of free cash flows has accelerated over time with the more recent 5 year and 10 year periods exhibiting faster rates of compounding vs the preceding periods. This has been contrary to the notion that the growth of historically successful companies should moderate as they grow bigger and more dominant in their industries. The acceleration in growth is reflective of the use of technology by our portfolio companies to compress their working capital cycles, increase their asset turnovers and strengthen their competitive advantage through tech investments over the last 5 and 10 years.
3. Over the last five years, the healthy growth in free cash flows has come despite several disruptive events like demonetization, GST introduction, the IL&FS/DHFL financial crisis and now Covid. Although these disruptive events have adversely affected the fundamentals of the industries within which our portfolio companies operate, the CCP companies have benefited from the challenges faced by their competitors. Furthermore, these events have given the CCP companies, opportunities to disrupt and evolve their business models to deepen their competitive advantages.
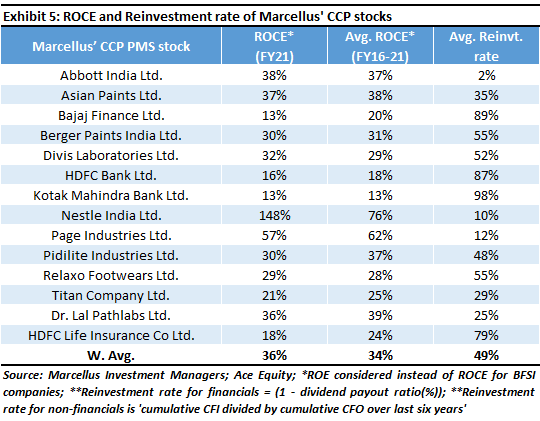
4. The growth in free cash flows of our portfolio companies has happened without any moderation in the rate of capital reinvestment back into their business. As highlighted in the exhibit below, reinvestment rates of our portfolio companies have remained healthy at around 50% with ROCEs of around 35% over the last five years.
Over the next 3-5 years, we expect our portfolio companies to continue gaining market share from both organized as well as unorganized competitors who have been adversely affected by the Covid crisis. Also, as network effects around tech, and operational efficiencies improve further, we expect the free cashflows of our investee companies to continue growing at a strong pace in the years ahead.
Note: Abbott India, Asian Paints, Berger Paints, Nestle India, Pidilite, Titan, Divis Labs, Page Industries, Relaxo Footwears, HDFC Life & Dr Lal Pathlabs are part of many of Marcellus’ portfolios.
If you want to read our other published material, please visit https://marcellus.in/
Copyright © 2021 Marcellus Investment Managers Pvt Ltd, All rights reserved

