OVERVIEW
POPULAR ARTICLES

Borrowing used to be a last resort, taken on reluctantly and repaid as fast as possible. For a large part of India’s Gen Z, it has quietly become the default way to live. Five forces explain the shift:
- Digitisation has removed the discomfort of paying, so spending feels painless.
- “Present bias” lets todays self-borrow freely from a future self.
- Social media has turned aspirational lifestyles into perceived necessities.
- Debt has been rebranded as a skill, using a rule about leverage that is true in developed economies but not in India.
- Frictionless credit has scaled much faster than India’s financial literacy.
Together these have created a credit-exposed generation whose borrowing is growing at 20% p.a. while real wage growth is zero. With interest rates about to begin their upward march, if you want to protect your portfolio from the ravages of Gen Z’s borrowing binge, please visit kcp.marcellus.in
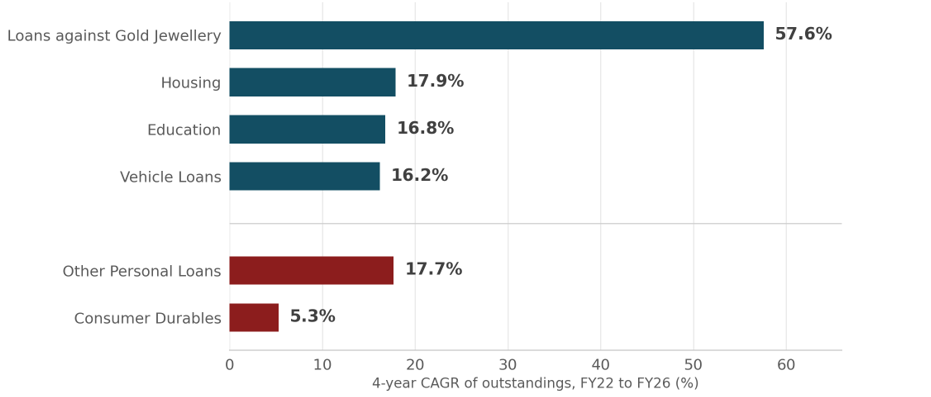
Exhibit 1: Growth in outstandings by RBI reporting line item, FY22 to FY26, grouped by RBI’s own regulatory treatment.
“Prosperity brings expanded lending, which leads to unwise lending, which produces large losses, which makes lenders stop lending, which ends prosperity, and on and on.”— Howard Marks (source: https://www.goodreads.com/quotes/9630747-prosperity-brings-expanded-lending-which-leads-to-unwise-lending-which)
What Gen Z is borrowing for
- Gold jewellery loans are growing at 58% per annum1. Traditionally, these loans were used by farmers and SMEs to finance working capital. Now, they are increasingly funding consumption.
- “Other Personal Loans”, RBI’s label for general-purpose unsecured credit, is growing at 18% per annum2. As explained in Chapter 6 of our book, “Breakpoint: The Crisis of the Middle Class & the Future of Work”, unsecured credit is being used to fund consumption with the most common use case being funding vacations!
- Consumer durable loan growth has reduced to a modest 5% per annum3. Those purchases have migrated to BNPL, cards and general-purpose loans.
Whether the collateral is a gold chain or nothing at all, the direction is the same: a rising share of Indian consumption is funded by debt rather than income. The question is why?
There are 5 forces driving the borrowing surge.
Force 1: The pain of paying has disappeared
For obvious reasons, handing over cash hurts. Behavioural economists call this the “pain of paying,” and it works as a natural brake on spending. In an MIT experiment, researchers ran a real auction for sold-out Boston Celtics tickets, telling half the bidders they would pay in cash and half by card.
Exhibit 2: Average bid for identical tickets, by payment method told to bidders.
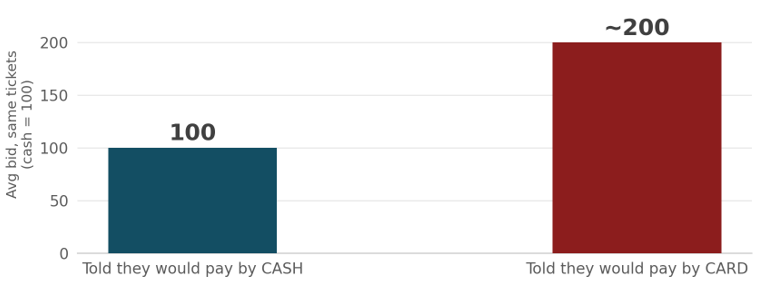 Source: Prelec & Simester (2001), indexed with cash bidders = 100.
The card bidders bid roughly twice as much for the identical ticket4. Nothing about the tickets changed; only the friction of paying did. India has since removed that friction at national scale: UPI processed over 24,000 crore transactions in FY2026, and 86% of merchant payments were under ₹5005. The small, forgettable purchases earlier made in cash and notes are now a click away. A generation that goes days without physically holding cash is a generation which has no spending brake.
Force 2: You are borrowing from a future self who isn’t in the room
Present bias is the habit of overweighting today and discounting the consequences of what will happen next month or next year. Consumer durables firms have utilized this well know psychological bias6 to turn expensive purchases (like a high-end smartphone) into what look affordable monthly instalments. So a 24-year-old taking home ₹45,000 a month finds is easy to buy a ₹60,000 phone on a 12-month no-cost EMI. She never sees ₹60,000. She sees ₹5,000 a month, a number small enough to feel like it competes with nothing.
Exhibit 3: Illustrative. Four ₹5,000 EMIs against a ₹45,000 monthly take-home. The 40% line is the share of annual income the average indebted Indian already spends servicing debt
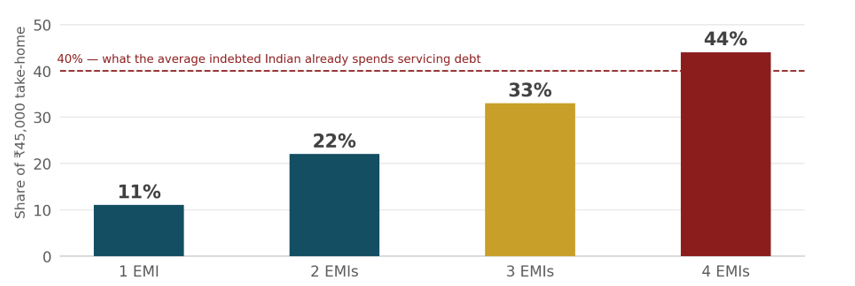 Source: Breakpoint (2026)
Each EMI is individually reasonable but collectively all of these EMIs compound. Result: nearly half of Indians taking personal loans already have multiple live loans running, often across three or more lenders simultaneously7.
Force 3: Your Insta feed has redefined what counts as a need
Social media has industrialised comparison. An earlier generation measured itself against a neighbour or a colleague; Gen Z measures itself against a curated, algorithmically boosted reel running 24/7. A “soft life,” an international holiday and the right set of experiences have stopped reading as wants and started reading as baseline needs. The data we collected while writing Breakpoint – see the chart below – validated this desire on Gen Z’s part to live the aspirational life using borrowed money.
Exhibit 4: Holidays are the single largest stated purpose for personal loan borrowing in India.
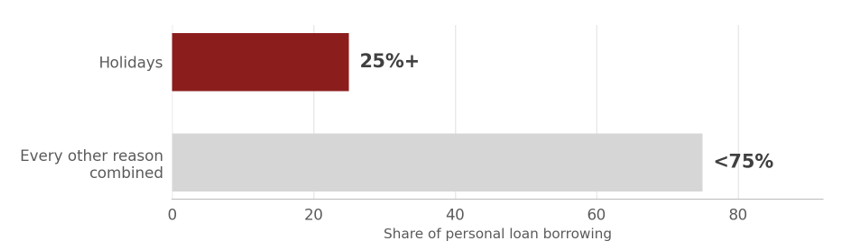
Over a quarter of personal loan borrowing now funds holidays8, more than any other single purpose. Credit is what closes the gap between the life being shown and the life that can actually be afforded.
Force 4: Debt has been rebranded as a skill
For the generation before them, debt was a last resort: taken on out of necessity, repaid as fast as possible, ideally without anyone finding out. Today’s educated young borrower does the opposite, talking of “using OPM” (other people’s money), “optimizing cash flow,” “good debt.” The challenge is understanding the distinction between good and bad debt.
Good debt buys something that appreciates or raises your earning power: a home, a qualification, a business. Bad debt funds consumption that begins depreciating the moment you use it. On that test, most Indian retail borrowing fails. As Breakpoint* documents, these loans are not creating productive assets; they finance aspirational consumption (phones and holidays) for the more affluent middle class and essential consumption for the less affluent8. India’s household debt (ex – home loans) has climbed from 23% of GDP in FY2017 to 32% in FY2025, above both the United States and China9.
So why do educated people keep doing this? Not because they can’t count, but because they have been handed a rule that is true in a developed economy with much lower cost of capital than India’s.
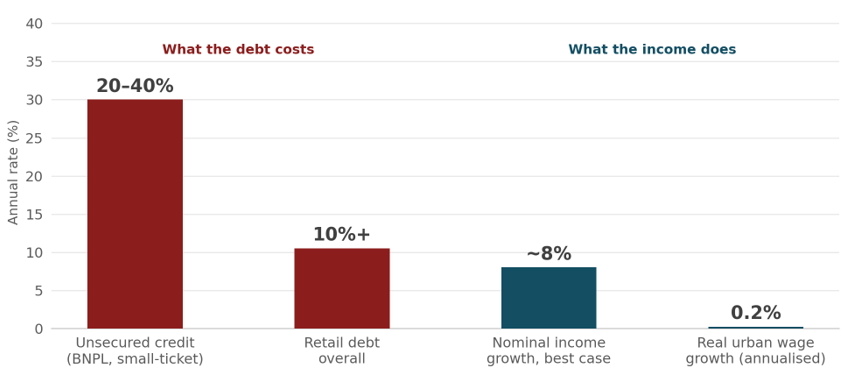
Exhibit 5: What retail debt costs an Indian borrower versus what their income does.
Sources: Breakpoint (2026); PLFS 2017-18 and 2023-24 for real urban wages, annualised by Marcellus. Unsecured range is an illustrative estimate, see note [12].
Indian retail borrowers face effective rates above 10%, and 20–40%+ on small-ticket unsecured credit once fees are annualised10. Against that, nominal incomes grow in the high single digits at best9; real urban wages rose just 0.2% a year over the six years to FY2024, and rural wages fell outright11.
The debt compounds at 10–40%. The income servicing it compounds at roughly zero in real terms. No amount of cash-flow optimisation closes that spread. It is why nearly 40% of an indebted Indian’s income now goes to servicing debt, and why 5–10% of India’s retail borrowers are already taking new loans simply to service old ones7. A generation isn’t being taught something false. It is being taught something partly true, without the circumstances specific to India.
Force 5: Access has outrun awareness
This is the first Indian cohort handed instant, friction-less, unsecured credit at scale while the country’s financial literacy has barely moved.
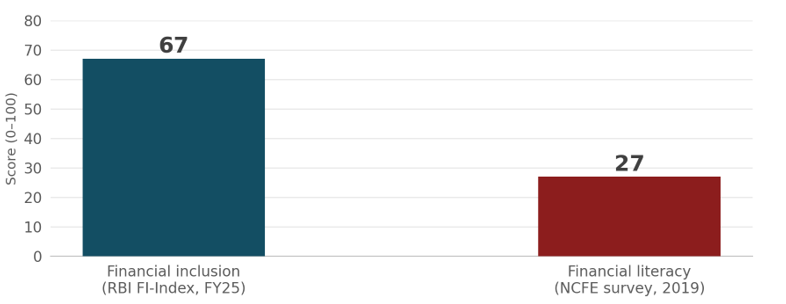
Exhibit 6: India’s financial access has run well ahead of its financial literacy.
Sources: RBI Financial Inclusion Index, FY25; NCFE Survey, 2019.
Only 27% of Indian adults, of any age, meet a basic financial literacy threshold, even as the RBI’s index of financial access has climbed to 67 out of 10012. It shows in the lending data. Small-ticket personal loans, the fastest approved, least friction and highest effective cost, grew 11x by volume between FY17 and FY21 against under 4x for personal loans overall13, and the RBI puts 45% of all borrowers in the sub-prime category14.
As interest rates start rising, the chickens will come home to roost
The European Central Bank has already began raising interest rates and the Fed has been making hawkish choices. Naturally therefore with inflationary pressures mounting and with the INR under relentless pressure the RBI too is increasingly leaning towards rate hikes. As reported by the Business Standard earlier this week, “The markets were surprised by the hawkish commentary from the Reserve Bank of India’s (RBI’s) monetary policy committee (MPC) last week…While explaining how the market missed the message for a need to recalibrate policy rates, Saugata Bhattacharya, external member of the MPC…says the cost of policy action and not falling behind the curve in controlling inflation must be balanced…The MPC minutes have been interpreted as hawkish by the market.” (source: https://www.business-standard.com/finance/interviews/not-suggesting-next-policy-move-is-a-hike-but-there-is-a-need-to-relook-126082401519_1.html)
A rising rate environment will separate the men from the boys
Over the past 4 years, India has enjoyed a relatively benign liquidity and credit quality environment. As a result, every single listed bank in India now has net NPAs less than 1% of their book, a miracle never witnessed before in India’s financial system (source: https://www.business-standard.com/opinion/columns/no-listed-bank-has-even-1-net-npa-a-milestone-for-asset-quality-126082300705_1.html).
Given the mountain of debt that Indian households have racked up (see Chapter 6 of our book, “Breakpoint: The Crisis of the Middle Class & The Future of Work”), a rising rate environment is likely to pose a stern test for second rung lenders in India. That in turn will result in credit quality diverging between the best run lenders (such as our investee firms like Bajaj Finance, Chola, HDFC Bank and ICICI Bank)**. and the ordinary lenders.
Enter Marcellus’ Kings of Capital Portfolio (KCP)
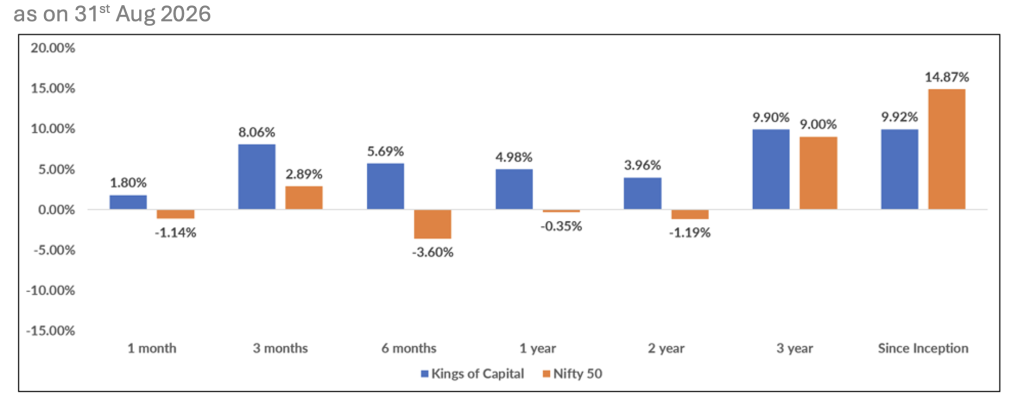
Our Financial Services focused sector portfolio – with its focus on investing in boring, well-managed franchises with sensible capital allocation – has beaten the benchmark over the past 1, 2 and 3 years. Now as the interest rate cycle turns upwards, Kings of Capital is set for continued, significant outperformance.
Launched in July 2020, it consists of boring, profitable high return businesses with clean corporate governance and attractive valuations. The portfolio is unique because:
- No index hugging, only bottom-up stock picking with a focus on variant perception
- Lowest exposure to large banks (HDFC, ICICI, SBI, Axis, Kotak) amongst over 20 BFSI mutual funds in the country
- Zero exposure to PSU banks and PSU NBFCs – again only BFSI fund in the industry with this positioning.
Our in-depth coverage of 35+ financial services stocks has been augmented by a wide network of experts along with access to management teams across listed and unlisted financial services companies. This has helped KCP to invest in robust businesses which are under-represented in mainstream indices – including wealth managers, credit rating agencies, non-life insurers, mutual fund distributors, commodity exchanges, providers of cash management services etc. The result of this is that since inception KCP has a beta of less than 1 which is counterintuitive for a financial services portfolio.
That distinction, between lenders compounding a high-quality book and lenders funding the new spending binge, is exactly what Marcellus’s Kings of Capital Portfolio (KCP) is built for. KCP holds 15–20 financial-sector businesses: lenders, insurers, asset managers, wealth managers and financial infrastructure providers, selected because they pass that stress test, and deliberately avoids the leveraged, hard-to-underwrite half of the sector. Its track record is below15
Exhibit 7: Kings of Capital Portfolio live performance versus the Nifty 50, as on 31st August 2026. Portfolio inception: July 2020.
Source: Marcellus Investment Managers; Marcellus Performance Data shown is net of fixed fees and expenses charged till latest quarter and is net of Performance fees charged for client accounts, whose account anniversary / performance calculation date falls upto the last date of this performance period; since inception & 3 years returns are annualized; other time period returns are absolute. For relative performance of particular Investment Approach to other Portfolio Managers within the selected strategy, please refer https://www.apmiindia.org/apmi/welcomeiaperformance.htm?action=PMSmenu, Under PMS Provider Name please select Marcellus Investment Managers Private Limited and select your Investment Approach Name for viewing the stated disclosure. The calculation or presentation of performance results in this publication has NOT been approved or reviewed by the SEC, SEBI or any other regulatory authority.
To see how KCP applies this filter stock by stock, visit kcp.marcellus.in or scan the QR code below.

Click Here for details about our regulatory registration and licensing information.
*Copyrights and intellectual property for the referred books remain with the original publisher and author. No challenge to their ownership is intended.
**The stocks mentioned above may form part of Marcellus’ portfolio. Marcellus, its clients, and/or its employees may therefore have an interest in the said stock(s)
Sources & notes
[1] RBI, Data on Sectoral Deployment of Bank Credit, March-end outstandings, FY22–FY26; CAGR = (FY26/FY22)^(1/4) − 1. Under RBI’s reporting format, “Personal Loans” is the head covering bank lending to individuals and includes consumer durables, housing, advances against fixed deposits, advances against shares and bonds, credit card outstanding, education, vehicle loans, loans against gold jewellery and other personal loans. Credit card outstanding, advances against fixed deposits and advances against shares are part of this umbrella but are not shown separately in Exhibit 1; of these, credit card outstanding has grown roughly flat over the most recent year. Loans against gold jewellery grew +121% in FY25 and +124% in FY26.
[2] RBI data (note [1]); “other personal loans,” RBI’s reporting line for general-purpose credit to individuals not classified under a specific purpose, and the largest component of the higher risk-weight bucket, per RBI, “Regulatory measures towards consumer credit and bank credit to NBFCs,” 16 November 2023, which raised the risk weight on consumer credit / personal loans from 100% to 125%, excluding housing, education, vehicle and gold-jewellery loans.
[3] RBI data (note [1]); consumer durables outstanding, -1.0% in FY25 and -5.3% in FY26.
[4] Prelec & Simester, “Always Leave Home Without It,” Marketing Letters 12(1), 2001. In a real sealed-bid auction at MIT for sold-out Celtics tickets, card bidders bid on average roughly double what cash bidders bid for identical items.
[5] NPCI / Government of India, UPI decade statistics: 24,162 crore transactions in FY2025-26, 86% of person-to-merchant transactions below ₹500.
[6] Behavioural-economics research linking present bias to higher credit card debt (e.g. Meier & Sprenger). The underlying bias is not age-specific; its interaction with frictionless credit products is what is new.
[7] Mukherjea, Rajhansa & Bhavsar, Breakpoint (Juggernaut, 2026): nearly half of personal loan borrowers hold multiple live loans, often across three or more lenders; ~40% of annual income goes to debt servicing; 5–10% of retail borrowers are taking new loans to service existing ones.
[8] Breakpoint (2026): vacations are the most common reason for personal loans, over a quarter of such borrowing; retail borrowing finances aspirational consumption for the affluent middle class and essential consumption for the less affluent.
[9] Breakpoint (2026): non-housing household debt at 32% of GDP in FY2025 vs 23% in FY2017, now above the US and China; effective rates above 10% against incomes growing at best in high single digits.
[10] Illustrative range. Effective annualised costs on unsecured short-tenure personal loans and rolled-over BNPL balances vary by lender and are not uniformly disclosed; the low-20s to 40%+ range is a commonly cited planning estimate once fees and penal charges are annualised, not an official statistic.
[11] PLFS, MoSPI. Average real monthly wages for urban workers rose from ₹12,847 (2017-18) to ₹13,006 (2023-24), a rise of 1.2% in total or 0.2% annualised (Marcellus calculation). Rural monthly earnings fell from ₹9,107 to ₹8,842.
[12] NCFE Financial Literacy and Inclusion Survey (2019), most recent completed edition; RBI Financial Inclusion Index for year ending March 2025 (67.0, up from 64.2).
[13] CRIF High Mark, personal loan disbursement trends FY17–FY21; small-ticket defined as below ₹1 lakh.
[14] RBI Financial Stability Report, December 2024, as cited in Breakpoint (2026).
[15] Marcellus Investment Managers, Kings of Capital Portfolio factsheet, live performance as of 31st July 2026, net of fixed and performance fees charged to date. Benchmark Nifty 50 TRI. Since-inception and 3-year returns annualised; other periods absolute. Performance has not been reviewed by SEBI, US SEC or any other regulator.
Disclaimer:
The above material is neither investment research, nor investment advice. Marcellus does not seek payment for or business from this material/email in any shape or form. Marcellus Investment Managers Private Limited (“Marcellus”) is regulated by the Securities and Exchange Board of India (“SEBI”) as a provider of Portfolio Management Services. Marcellus is also a US Securities & Exchange Commission (“US SEC”) registered Investment Advisor. Marcellus Investment Managers Private Limited (“Marcellus”) is regulated by the International Financial Services Centres Authority (IFSCA) as a Fund Management Entity. No content of this publication including the performance related information is verified by SEBI or US SEC. If any recipient or reader of this material is based outside India and USA, please note that Marcellus may not be regulated in such jurisdiction and this material is not a solicitation to use Marcellus’s services. All recipients of this material must before dealing and or transacting in any of the products/services referred to in this material must make their own investigation, seek appropriate professional advice. This communication is confidential and privileged and is directed to and for the use of the addressee only. Past performance is not indicative of future results. Marcellus and/or its associates, the authors of this material (including their relatives) may have financial interest by way of investments in the companies covered in this material. As per SEBI Master Circular dated June 07, 2024, clients have an option to be on-boarded directly by the Portfolio Manager without intermediation of persons engaged in distribution services.