OVERVIEW
POPULAR ARTICLES

At Wimbledon this July the singles champion took home £3.6mn. The sixty-four players who lost their first match took £80,000 each i.e. the winner earns 45x the losers. That gap is what economists call the ‘Theory of Tournaments’, and two celebrated papers explain why the gap must be that wide. This payoff structure will become familiar to Indian white-collar workers as jobs give way to gigs. Three things follow. 1) Payoffs polarise, 2) Money arrives in lumps rather than in fixed monthly figures, and 3) Everybody can see where they rank. These 3 factors will make it imperative for every single white-collar worker to have robust goal plan. For help in building one, visit plan.marcellus.in
Exhibit 1: The 2026 Wimbledon singles prize list — 128 players, £23.6mn, one big cheque
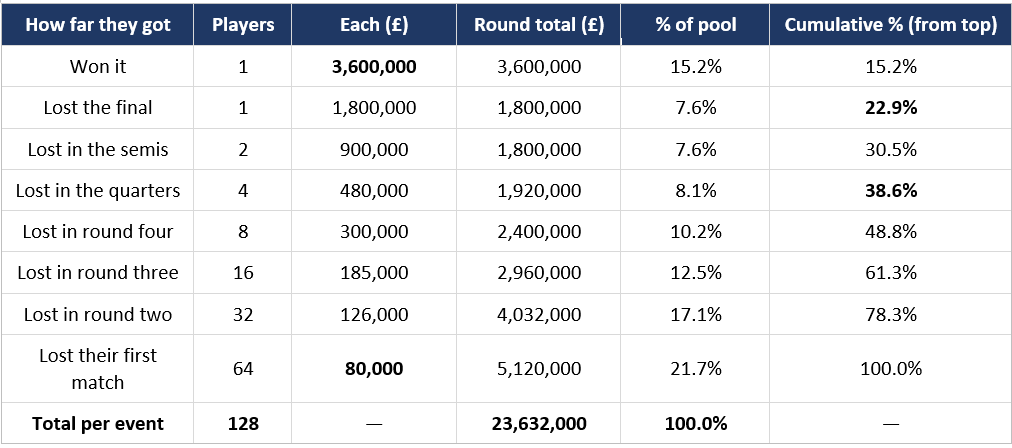
Source: Marcellus Investment Managers; The Championships, Wimbledon 2026 official prize money schedule (All England Lawn Tennis Club). Percentages computed by Marcellus from the published amounts. Figures are per event and are identical for the men’s and women’s singles.
“Hearing a succession of mediocre singers does not add up to a single outstanding performance.”
— Sherwin Rosen, The Economics of Superstars (1981)
Some jobs pay you for your rank, not your work
In October 1981 Edward Lazear and Sherwin Rosen published a paper in the Journal of Political Economy asking why organisations pay people on where they finish against colleagues rather than on what they produced. Their answer: measuring one person’s output is slow and unreliable, while ranking two people is cheap and almost always possible. So, firms rank, then pay the ranking.
The uncomfortable part is what this does to the pay gap. How hard people try depends on the gap between the prizes, not on how big they are. Double every cheque and nobody works harder. Widen the gap between first and second and everybody does. So, the top prize has to be far larger than the winner is actually worth. That prize is paying for the effort of the whole field, NOT just for what happened in the final.
Rosen published a second paper two months later, The Economics of Superstars. He explained that when work can be copied and delivered at almost no extra cost, the best person in the field is no longer limited by the hours they have. Buyers also do not treat suppliers as interchangeable: a surgeon who is 10% better gets paid far more than 10% extra. Put rank-based pay and unlimited reach together and you do not get a bell curve. You get a cliff.
Wimbledon is the clearest case study of this effect
Most tournaments in life keep their prize list private. Wimbledon publishes it. The 2026 fund was £64 mn, of which £24 mn went to each singles draw of 128 players.
The champion got £3.6mn, roughly ₹46 crore. Each first-round loser got £80,000, roughly ₹1 crore. That is 45 to one. From the other end, the weaker half of the field, sixty-four players good enough to get in and then beaten once, split 22% between them.
Exhibit 2: How £23.6mn was split between 128 professionals
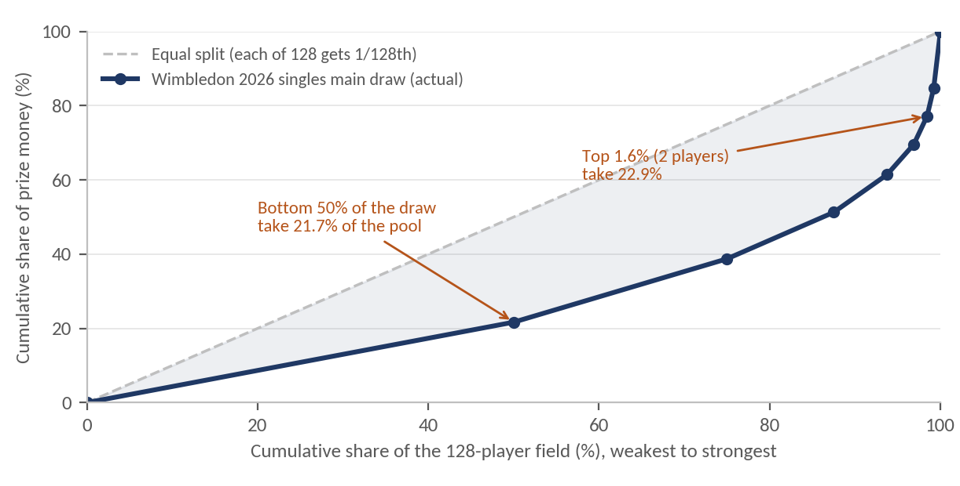
Source: Marcellus Investment Managers; Wimbledon 2026 official prize money schedule. Lorenz curve computed by Marcellus from the published schedule. It is a straight line within each round because everyone knocked out in the same round gets the same cheque.
Was the champion forty-five times better? Rafael Nadal won 1,080 matches and lost 228 across his career, a strike rate of 82.6%. Nobody outside the very top wins one match in forty-five. The pay gap is about ten times wider than the skill gap. That is the design working, not unfairness creeping in. Nadal earned around US$135mn in prize money and, per Forbes, over US$415mn from endorsements. That second number was not paid for his tennis. It was paid for being ranked first.
The same structure is now arriving in Indian offices
In “Breakpoint: The Crisis of the Middle Class & The Future of Work” we argued that the old middle-class deal, a degree then a salaried job then a slow climb, is coming apart. We then explained why gig work (i.e. assignment based work) will soon replace office work. Once work is bought as a transaction, the buyer can rank the sellers, move volume to the highest rated, and pay for the result rather than the hours. India is further down this road than most assume.
Exhibit 3: India already has the conditions a tournament needs
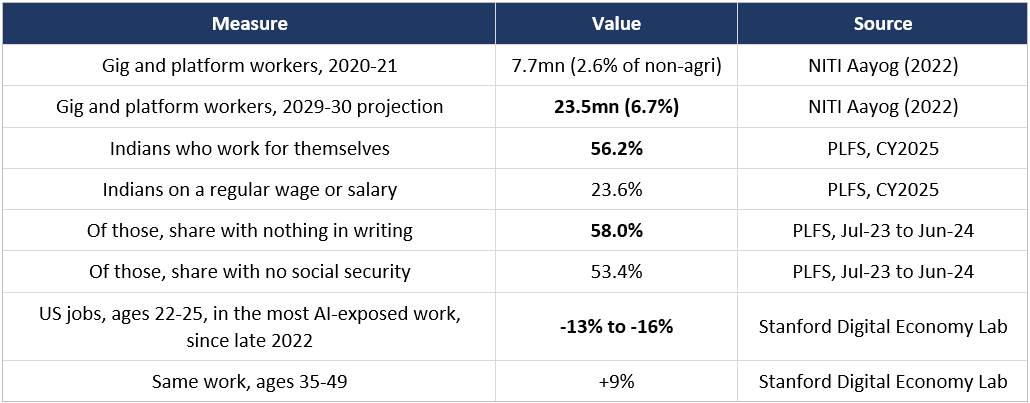
Source: Marcellus Investment Managers; NITI Aayog, ‘India’s Booming Gig and Platform Economy’ (June 2022); Periodic Labour Force Survey Annual Reports 2025 and July 2023-June 2024 (NSO, MoSPI); Brynjolfsson, Chandar and Chen, ‘Canaries in the Coal Mine?’, Stanford Digital Economy Lab (August 2025, revised November 2025). The two PLFS rows come from different survey rounds and a change in methodology limits strict comparability. The Stanford authors are clear that they measure a correlation rather than proving causation. Their data is American; reading it across to India is our inference, not their finding.
“Copyrights and intellectual property for the referenced work in our book “Breakpoint” remain with the original publisher and author. No challenge to their ownership is intended.
More than half of India already works without an employer. What is new is that this is reaching graduate careers, from the bottom up with the IT sector being the first to feel the impact of AI substituting human workers.
Three things follow when such a structure becomes dominant
One: payoffs are polarising across the world
The creator economy runs entirely on platforms where rewards are doled out “tournament-style”. Payments to creators grew 59% in 2025 globally. The average payment per campaign in 2025 was $11,400 whereas median payment per campaign was just $3,000, meaning there are a few campaigns that comprehensively out-earn a long tail globally. As Rosen explained 45 years ago, in a tournament those two facts sit together: a bigger prize pulls in more entrants, they pile up at the bottom, and the extra money goes to the top. India’s Income Tax data shows that rewards in the broader Indian economy (see table below) are now increasingly “tournament-style”.
Exhibit 4: The same shape shows up on platforms and in India’s tax data
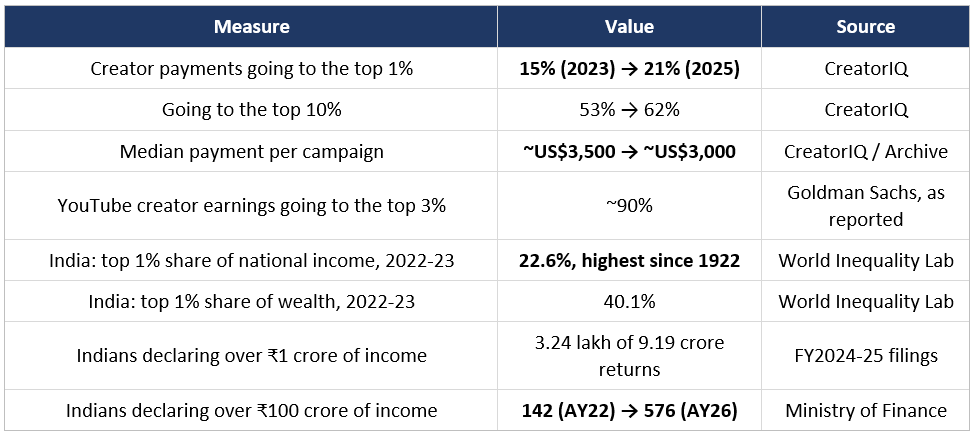
Source: Marcellus Investment Managers; CreatorIQ, ‘State of Creator Compensation’ (21 January 2026), as reported; Goldman Sachs as reported; Bharti, Chancel, Piketty and Somanchi, World Inequality Lab Working Paper 2024/09; Income Tax Department e-filing statistics and Ministry of Finance replies in Parliament. Note the scope column: the creator rows track CreatorIQ’s global payment network and are not Indian data, so they illustrate the shape of the distribution rather than evidence anything about India. The creator datasets are commercial and their methodology is not fully public. Some of the growth in reported crore-plus incomes is better compliance and digitisation rather than higher incomes.
Two: earnings are going to become more volatile for Indian families
Inequality is a gap between people. Lumpiness is a gap inside one career, and we think it is harder to live with. Two extra wins at Wimbledon moved a player from £480,000 to £3.6mn in a fortnight. The JPMorgan Chase Institute looked at six million US families and found the typical family’s income moves 36% month to month, with swings above a quarter in five months of the year, and the young and the well-paid were the most volatile of the lot.
Exhibit 5: Same ₹4 crore of lifetime income, three very different endings
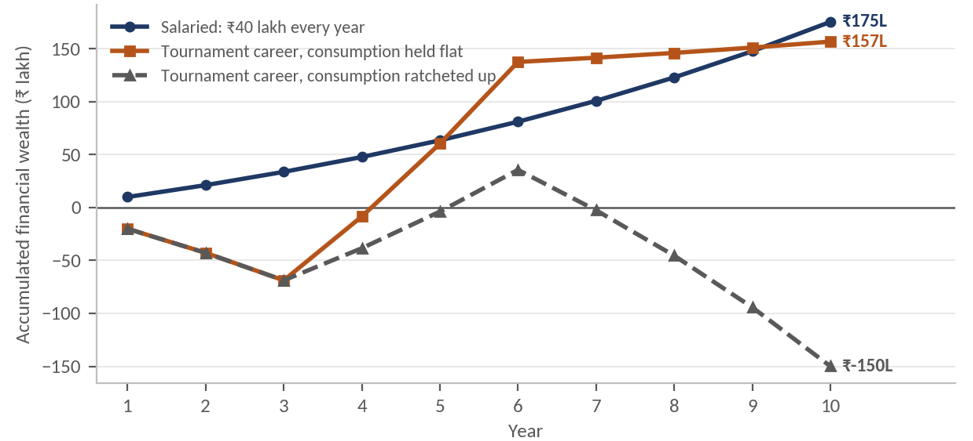
Source: Marcellus Investment Managers. Illustrative and computed by Marcellus. Not drawn from any dataset and not a forecast. All three earn ₹4 crore over ten years. The salaried professional earns ₹40 lakh a year. The other two earn ₹10 lakh in years 1-3, ₹1 crore in years 4-6 and ₹17.5 lakh in years 7-10. Living costs are ₹30 lakh a year throughout, except for the third professional, who raises them to ₹60 lakh from year 4 and never brings them down. Surpluses compound at 12%, deficits are funded at 14%, taxes ignored.
Most salaried people in Indian assume that they will earn the same amount every month for the rest of their careers. However, as gig jobs replace office jobs, earnings are likely to become more volatile. Let’s take the example of 3 professionals each of whom earns Rs 4 crores over 10 years. If you assume that their annual earnings follow three different trajectories over 10 years – as shown in the chart above – their financial position at the end of the decade will vary dramatically.
The salaried professional ends with ₹1.75 crores. The one with lumpy income who holds spending flat ends with ₹1.57 crores, 11% behind, only because the money arrived in the wrong order and the thin years had to be funded. The third let spending rise in the big years and never brought it down. He ends ₹1.5 crore in debt. Same income, ₹3 crore apart, and the whole difference is a decision taken during the good years.
Three: everybody can see where they rank relative to others
In 2012 David Card, Alexandre Mas, Enrico Moretti and Emmanuel Saez studied what happened when every University of California salary went onto a public website. People who found they earned below their department’s median reported lower satisfaction and started looking elsewhere. People who found they earned above it reported no improvement at all. In an office you could only guess what colleagues earned (see more here: NBER Digest, 2011 ). On a platform the ranking is published and permanent. We would expect this to bite hardest inside households, where one person is in their earning years and the other is not. That is the structure at work, not a fault in the people.
What we would do about it
As white-collar workers get set for a life of gig jobs, they need a financial plan which helps them deal with:
- Years of feast interspersed with periods of famine;
- Years in which they win their profession’s equivalent of Wimbledon interspersed with many years in which they are knocked out in the early rounds; and
- Perpetually seeing the professional rank fluctuate in full view of their entire professional community.

Click Here for details about our regulatory registration and licensing information.
The above material is neither investment research, nor investment advice. Marcellus does not seek payment for or business from this material/email in any shape or form. Marcellus Investment Managers Private Limited (“Marcellus”) is regulated by the Securities and Exchange Board of India (“SEBI”) as a provider of Portfolio Management Services. Marcellus is also a US Securities & Exchange Commission (“US SEC”) registered Investment Advisor. No content of this publication including the performance related information is verified by SEBI or US SEC. If any recipient or reader of this material is based outside India and USA, please note that Marcellus may not be regulated in such jurisdiction and this material is not a solicitation to use Marcellus’s services. This communication is confidential and privileged and is directed to and for the use of the addressee only. The recipient of this material is urged to consult their own legal and tax consultants/advisors before making any investments. The recipient, if not the addressee, should not use this material if erroneously received, and access and use of this material in any manner by anyone other than the addressee is unauthorized. If you are not the intended recipient, please notify the sender by return email and immediately destroy all copies of this message and any attachments and delete it from your computer system, permanently. No liability whatsoever is assumed by Marcellus as a result of the recipient or any other person relying upon the opinion unless otherwise agreed in writing. The recipient acknowledges that Marcellus may be unable to exercise control or ensure or guarantee the integrity of the text of the material/email message and the text is not warranted as to its completeness and accuracy. The material, names and branding of the investment style do not provide any impression or a claim that these products/strategies achieve the respective objectives. Further, past performance is not indicative of future results. Marcellus and/or its associates, the authors of this material (including their relatives) may have financial interest by way of investments in the companies covered in this material. Marcellus does not receive compensation from the companies for their coverage in this material. Marcellus does not provide any market making service to any company covered in this material. In the past 12 months, Marcellus and its associates have never i) managed or co-managed any public offering of securities; ii) have not offered investment banking or merchant banking or brokerage services; or iii) have received any compensation or other benefits from the company or third party in connection with this coverage. Authors of this material have never served the companies in a capacity of a director, officer or an employee. All recipients of this material must before dealing and or transacting in any of the products referred to in this material must make their own investigation, seek appropriate professional advice and carefully read the Private Placement Memorandum/Disclosure Document, Form ADV, Form CRS and any other documents or disclosures provided to them by Marcellus, as applicable.
This material may contain confidential or proprietary information and user shall take prior written consent from Marcellus before any reproduction in any form.