OVERVIEW
POPULAR ARTICLES
An AI datacentre has 6 components: compute (the GPUs that do the thinking), power infrastructure (transformers, substations, backup generators), cooling systems (liquid cooling is now mandatory), networking (the high-speed pipes connecting thousands of chips), storage (where data and models live), and the physical building itself. Every single one of these categories is simultaneously in short supply and rapidly rising in price. Currently, a significant proportion of these components is not manufactured in India. To participate in the AI datacentre opportunity, our Global team has invested in companies based in Taiwan, USA and Europe. You may consider investment opportunities, subject to eligibility, starting from approximately Rs 4.5 lakhs under applicable products and regulations.
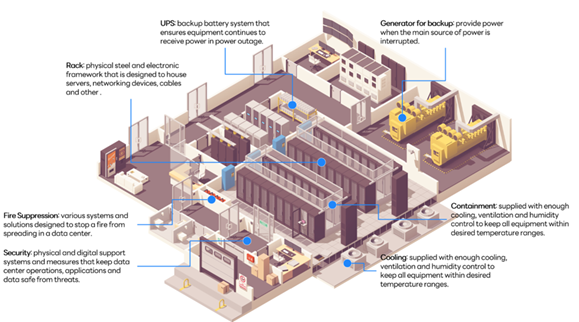
Source: https://blog.daouidc.com/en-us/blog/what-is-a-data-center
Nvidia’s GPUs aside, what is required to make a data centre?
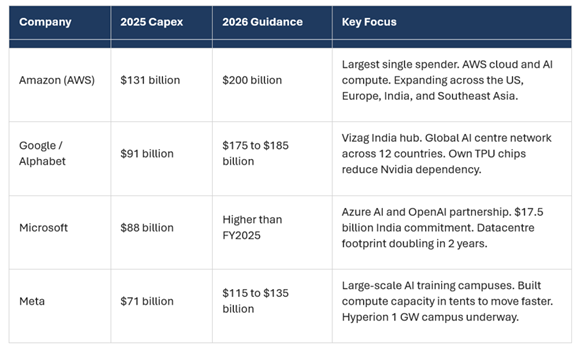
As highlighted in our 23rd May ’26 podcast (see The Impact of Agentic AI on India’s Tech, GCC Ecosystem & White Collar Jobs ), the enterprise AI revenues of the American hyper scalers are now rising exponentially e.g. Claude’s revenues are up 30x over the past 15 months. Emboldened by this revenue surge, the Alphabet, Amazon, Anthropic, Apple, Meta and Microsoft are all set to spend in excess of $800 bn on AI infrastructure in 2026. That number is 84% higher than what was spent as recently as 2024.
No country and no industry have ever spent so much money, so fast. So why does it cost to build AI data centers? And what are the implications for you as an investor sitting in India? Those are the questions we will focus on in this blog.
Currently, the world has around 50 gigawatts (GW) of AI data center capacity (of which 1.5 GW sits in India). Industry consensus from McKinsey & Company and Bain & Company pegs AI-related capacity demand at approximately 156 GW by 2030 i.e. 3x the current installed capacity. Each GW costs colossal amounts of capital to install.
Source: https://fortune.com/2026/04/29/microsoft-meta-google-ai-capex-spending-billions/
Note: Microsoft, Amazon, Alphabet and Meta are part of the Global Compounders Strategy managed from GIFT City by Marcellus and regulated by IFSCA. Marcellus, its employees, their relatives, and clients have an interest in these stocks. This material is for informational purposes only and does not constitute investment advice, an offer, or a solicitation to buy or sell any securities. Past performance is not indicative of future results. All company references are for illustrative purposes only and do not represent recommendations. Projections are based on third‑party sources and may change. Investors should consult their financial advisor before making investment decisions.
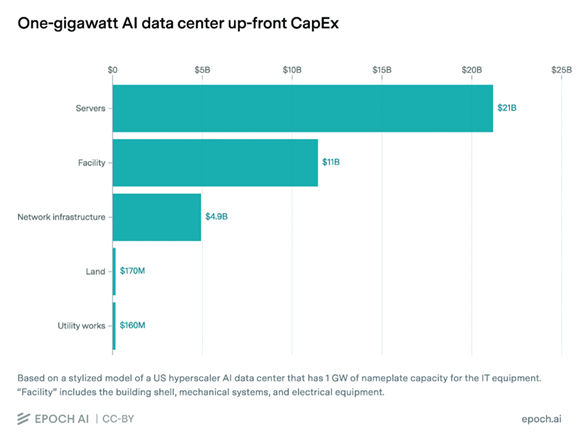
For a 1 Gw, depending on building specific data centres for specific requirements, costs vary from roughly 35-50 billion. Example – a 1 GW AI data centre built on Nvidia GPUs, total cost is roughly $50 billion. Of that, around $30 to $35 billion goes directly to Nvidia for chips and servers. That is 60 cents of every dollar spent on one of the world’s most expensive infrastructure projects flowing to a single company.
However, the companies that have built their own chips, primarily Google (TPUs) and Amazon (Trainium), avoid this concentration and their capex saving is larger, stays around, under 40 billion. The majority is on Nvidia.
Power is the second big cost and the single biggest practical headache. Builders have turned to restarting defunct nuclear plants, cutting deals with Boom Supersonic for aircraft-derived power turbines, and running on gas generators while waiting for grid connections that can take years. Meta built compute infrastructure in tents to get capacity online faster.
Even components that seemed immune to the supply crisis have been affected. SSD prices, the solid-state drives that store data, held completely flat through the Covid supply chain disruption that sent almost every other chip price spiralling. They are rising now, for the first time, because AI data centers are consuming flash memory capacity faster than it can be manufactured.
Cooling is the third pillar and the most changed. Five years ago, 5 to 15 kilowatts per rack was standard and air conditioning was sufficient. Today’s AI racks draw over 100 kW. Nvidia’s next generation will need 163 kW per rack, and the generation after that is designed for 300 kW-plus. The only answer is liquid cooling, which is expensive, import-dependent, and requires completely redesigned buildings.
The per square foot construction cost of a data center crossed $1,000 for the first time in 2025, up from $183 in 2020. That is a 6x increase in 5 years it reflects the fundamental redesign that AI-ready facilities require. A building designed for 5 kW racks cannot simply be upgraded for 100 kW racks. The floors, the power feeds, the cooling infrastructure, and the structural load-bearing all have to be rebuilt from scratch.
The rise of AI and Data centers poses 3 structural problems for India
India had 1.5 GW of data centers capacity at end-2025. Commitments made in the past 18 months, led by Google’s $15 billion hub in Vizag, Microsoft’s $17.5 billion India plan, and Amazon’s $35 billion India pledge, are set to multiply that several times over. The Vizag campus alone is expected to eventually reach 5 GW, more than three times India’s current total national capacity.
However, India’s accelerating need for AI and the nation’s rapidly rising spend on it creates three major challenges:
Firstly, almost everything that matters inside these data centers will be imported. GPUs from the US and Taiwan. Memory from South Korea. Liquid cooling from the US and Europe. High-speed networking from the US. Even the CRGO (Cold Rolled Non-Grain Oriented Electrical Steel) steel needed for transformer cores comes from Japan, South Korea, and China. India will capture the civil construction, some power infrastructure, and a growing share of server assembly through the PLI scheme. But the high-value technology content flows elsewhere. With each passing year therefore, AI could contribute to creating a deeper dent in India’s current account deficit in a way that Google searches never did. That in turn may put more pressure on the INR vs the $.
The CRGO steel situation is a case study of India’s dependency on imports. It is a relatively mundane material and sits at the core of electrical transformers. India imports almost all of it. JSW Steel acquired Thyssenkrupp’s Nashik plant in January 2025 specifically to begin domestic production. That capacity will not be ready until FY2028. The data centers in Vizag have commissioning deadlines fall before that. So even the transformer steel for Vizag’s data centers will be imported.
Secondly, because India is a not a frontier nation when it comes to AI technology (that honour belongs to USA and China), India’s reliance on foreign companies for both the hardware and the software will raise difficult questions regarding India’s sovereignty. After all, if the nation’s banking system, its stock market, its air traffic control system, its payment infrastructure and the enterprise tech of its largest corporates run on imported hardware and software, it may raise questions about the extent to which India (and indeed any country other than USA and China) really in charge of its own destiny (technological and economic).
Thirdly, with the passage of time, as the LLMs become smarter and faster, as the spend required on GPUs and data centers ramps further, investing billions of dollars in AI may require Indian companies to cut costs elsewhere. The company may evaluate cost optimization across various P&L item including the only resource that India has in abundance, graduate office workers.
Implications for Indian investors
For an Indian investor, the Indian stock market provides limited direct avenues to participate into make money from the AI and Datacentre boom. Through its offices in GIFT City, Gujarat, Marcellus offers multiple funds through which investors can access America and the other developed economies. Minimum investment thresholds may start from approximately USD 5K (Rs 4.5 lakhs), subject to the specific product, regulatory classification, and investor eligibility criteria. The track record of our flagship global product – the Global Compounders Portfolio – is shown below.
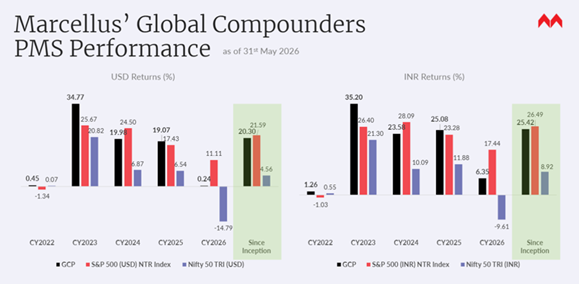
Note: Marcellus performance data is shown gross of taxes and net of fees & expenses charged till end of last month on client account. Performance fees are charged annually in December. Returns more than 1-year are annualized. Marcellus’ GCP USD returns are converted into INR using USD: INR exchange rate from RBI – Link for the reference
Note: * Since Inception performance calculated from 31st Oct 2022. The inception date is 31st Oct 2022, being the next business day after the account got funded on 28th October 2022. S&P 500 net total return is calculated by considering both capital appreciation and dividend payouts. The calculation or presentation of performance results in this publication has NOT been approved or reviewed by the IFSCA or US SEC. Performance is the combined performance of RI and NRI strategies. S&P 500 NTR is the benchmark for the strategy. Nifty 50 is provided for reference to illustrate the relative performance of the US and Indian markets. Past performance pertains to Marcellus’ GCP PMS strategy, not to this IFSC Retail Scheme and is not indicative of future results.
Marcellus GCP PMS is offered by Marcellus Investment Managers GIFT Branch in a segregated managed accounts format.
For more information on available products and suitability, please click on the QR code underneath this chart.

Thanks,
Saurabh Mukherjea
Here are the sources which helped us write this blog:
Amazon 2025 capex: $131.82bn / 2026 guidance: ~$200bn Source: Amazon Q4 FY2025 earnings call, 5 February 2026 — CEO Andy Jassy stated directly: “We expect to invest about $200 billion in capital expenditures across Amazon in 2026.” Variety
Google / Alphabet 2025 capex: $91.4bn / 2026 guidance: $175–$185bn Source: Alphabet FY2025 Annual Report (SEC filing) — capital expenditures of $91.4 billion for year ended 31 December 2025, with 2026 guidance of approximately $180 billion. sec
Microsoft 2025 capex: $88bn+ / 2026 guidance: higher than FY2025 Source: Microsoft DEF 14A proxy statement filed with the SEC — CFO Amy Hood’s performance summary states the company “invested over $88 billion in capital expense to support customer demand signals” in fiscal year 2025. sec
Meta 2025 capex: $72.22bn / 2026 guidance: $115–$135bn Source: Meta Q4 2025 earnings release (SEC Form 8-K) — full year 2025 capex confirmed at $72.22 billion. 2026 guidance of $115–$135 billion stated in the same release. sec Meta
Click here for details about our regulatory registration and licensing information.
Disclaimer:
This material is for informational purposes only and does not constitute investment advice or research. Marcellus Investment Managers Private Limited (“Marcellus”) is regulated by the International Financial Services Centres Authority (IFSCA) as a Fund Management Entity (Retail) offers Retail and Non-Retail products and is registered with the U.S. Securities and Exchange Commission (SEC) as an Investment Advisor. The PMS strategy, Category III AIF products (non-retail schemes), and IFSCA retail schemes are distinct offerings with different regulatory frameworks, risk profiles, fee structures, and investment thresholds. Minimum investment amounts referenced (e.g., ~US$5K) are applicable to specific IFSCA retail schemes and may not apply to PMS or Category III AIF products. Investors should refer to product-specific documents for details before investing. This communication is not a solicitation in jurisdictions where Marcellus is not regulated. It is confidential and intended solely for the addressed recipient; unauthorized use or distribution is prohibited. carefully read the Disclosure Document, Form ADV, Form CRS and any other documents or disclosures provided to them by Marcellus, as applicable. Actual results may differ materially from those suggested in this note due to risk or uncertainties associated with our expectations with respect to, but not limited to, exposure to market risks, general economic and political conditions globally, inflation, etc. Information provided is based on data available at the time of preparation and may change without notice. Marcellus makes no representation regarding accuracy or completeness and assumes no obligation to update. Recipients should rely on their own judgment and consult independent legal, tax, and financial advisors before making any investment decisions. Investments are subject to market risks and uncertainties. This material may include “forward looking statements”. All forward-looking statements involve risk and uncertainty. Any forward-looking statements contained in this document speak only as of the date on which they are made. Past performance is not indicative of future results, and there is no assurance that investment objectives will be achieved. Marcellus, its affiliates, employees, and authors may have financial interests in securities discussed. To the fullest extent permitted by law, Marcellus disclaims all liability arising from the use of this material. This is not meant for US investors.