OVERVIEW
POPULAR ARTICLES

In Breakpoint we showed that in India, finishing school and going to work beats finishing college and looking for work. Graduate unemployment is near 30% while unemployment among Indians who cannot read or write is 3%. That was true before generative AI arrived at scale, however it is truer now. Stanford’s payroll study finds employment for 22–25-year-olds in the most AI-exposed American occupations sitting 19% below where it should be, and the gap is widening. American students have already responded: computer science enrolment fell 8% in 2025-26, the steepest fall of any field. Three things follow as university education loses value: 1) Rote learning and regurgitation have run out of road, 2) Indians will increasingly choose not to study beyond school, and 3) The way a middle-class family saves across a lifetime has to be rebuilt, because the largest long-duration asset most Indian households own is their child’s education, and it is now ceasing to be risk-free. For help building a plan around that, visit plan.marcellus.in.
Exhibit 1: 63mn Indian graduates face a harsh reality
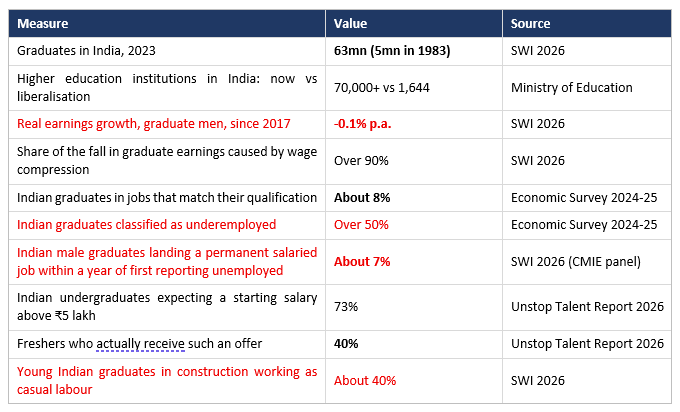
Source: Marcellus Investment Managers; State of Working India 2026 (Azim Premji University), as reported in The India Forum (7 August 2026); Economic Survey 2024-25; Unstop Talent Report 2026 (survey of 37,000+ students and 500 HR leaders). Note that these rows come from different surveys with different reference years and definitions of ‘young’, so they should be read as a picture rather than as a single consistent series. The Unstop figures are a private survey, not official statistics.
“A fool’s brain digests philosophy into folly, science into superstition, and art into pedantry. Hence University education.”— George Bernard Shaw
A degree has stopped buying what it used to buy
India today has 63mn graduates. 40 years ago, this number was just 5mn. That is a twelvefold increase in the supply of credentialed labour inside a single working lifetime, delivered by an expansion in higher education institutions from roughly 1,600 in 1991 to over 70,000 today. The supply of graduates has exploded in India. Unfortunately, the demand has not been anything as strong. The result is widespread unemployment and zero growth in real wages year after year. You don’t need a degree in Politics, Philosophy or Economics to realise that this combination is a recipe for disaster.
Between 2004 and 2011, average real earnings of graduate men aged 20 to 29 grew 4% a year. Since 2017 the same series has grown at minus 0.1% a year. A young graduate man in India earns slightly less today, in real terms, than his counterpart did in 2011. Azim Premji University’s decomposition shows this is not a sorting problem. Graduate wages have compressed inside every industry, and over 90% of the fall in average graduate earnings between 2011 and 2023 comes from that compression rather than from graduates ending up in the wrong industries. It is not that graduates are in the wrong jobs. It is that graduate jobs themselves have become less rewarding.
The employment numbers are worse than the wage numbers, and they have moved the wrong way for four decades.
Exhibit 2: Graduate unemployment in India is higher now than it was in 1983
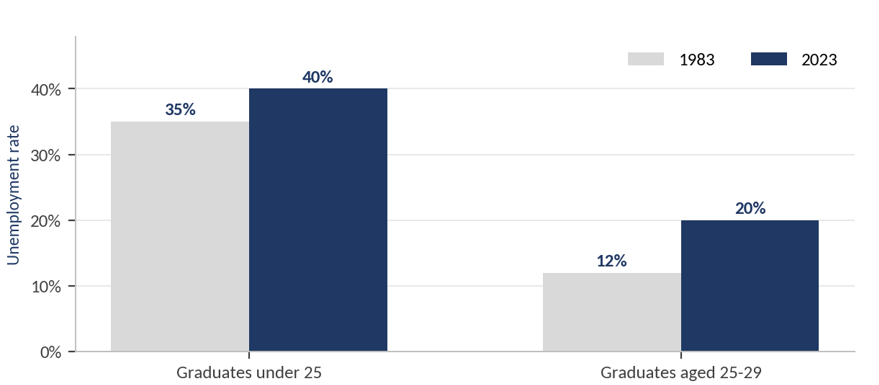
Source: Marcellus Investment Managers; State of Working India 2026, Azim Premji University (March 2026), as reported in The India Forum, 7 August 2026. ‘Under 25’ refers to young graduates as defined in the source. The 1983 comparison draws on NSS rounds and the 2023 figures on PLFS and CMIE data, so definitional changes across four decades limit strict comparability.
Note what that chart shown above does not say. It does not say India has become poorer. It says the specific bargain Indian families struck, in which years of fees and forgone earnings buy a salaried job, is now a worse bargain than it was for their parents. And it has become worse at exactly the moment when far more families are placing the bet. Only about 8% of graduates hold jobs that correspond to their qualification. In Mumbai, work on a construction site can pay roughly twice what many graduate-level office jobs pay, and a JCB operator can earn more still.
Now AI is removing the rung that graduates step onto
Now, in the midst of these dire circumstances enters AI with its capability to destroy millions of graduate jobs. The cleanest evidence of this comes from Stanford’s Digital Economy Lab, working with ADP payroll records covering millions of American workers. Their August 2026 report Canaries in the Coal Mine finds no economy-wide job displacement from AI. But underneath it, employment among workers aged 22 to 25 in the most AI-exposed occupations now sits about 19% below where it would be had it kept pace with similarly aged workers in less-exposed occupations. Experienced workers show no comparable gap. The figure was 13% when the paper first appeared in August 2025. It has widened every time the authors have refreshed the data as the labour-substituting capabilities of AI kick in.
Two details from this report are relevant for all of us in India. First, the substitution effect described in the Stanford report works through reduced hiring rather than increased firing. Firms are not sacking their juniors; they are not replacing them. Second, the declines cluster in occupations where AI substitutes for the task. Where AI complements the worker, employment is flat or rising. This is not a machine that eats jobs. It eats the entry-level version of certain jobs, which is precisely the version a fresh graduate is qualified for.
The aggregate American labour market now shows an inversion that has never appeared before in the New York Fed’s series going back to 1990.
Exhibit 3: In the US, recent graduates are now less employed than the average worker
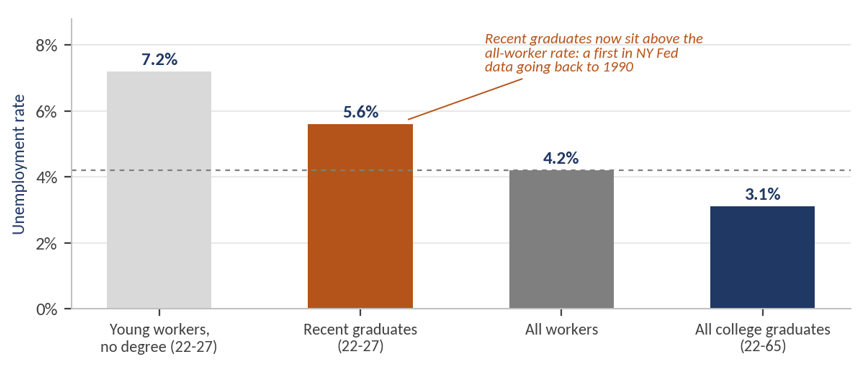
Source: Marcellus Investment Managers; Federal Reserve Bank of New York, ‘The Labor Market for Recent College Graduates’, Q2 2026 update, drawing on US Census data. Recent graduates are those aged 22-27 holding a bachelor’s degree or higher; rates are 12-month moving averages. Underemployment among recent graduates stood at 42% in Q2 2026, the highest since 2020. The inversion is a fact; attributing it to AI is our inference, not the Fed’s finding.
In the wake of American graduates finding it hard to get jobs, student numbers are falling in exactly those courses where AI is destroying entry-level jobs – see the chart below.
Exhibit 4: American students are already voting with their fees
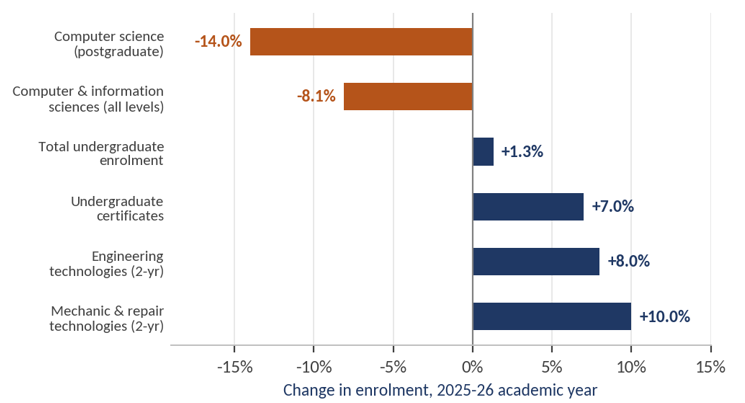
Source: Marcellus Investment Managers; National Student Clearinghouse Research Center, fall 2025 and spring 2026 enrolment reports; Computing Research Association survey. The total undergraduate figure is spring 2026; the computer science figures are for the 2025-26 academic year; the two-year trade and certificate figures are fall 2025. Mixing reference periods in one chart is a limitation, so read the direction and rough magnitude rather than the precise spread between bars.
Computer and information sciences fell 8.1% in 2025-26, the steepest decline of any field of study, with postgraduate enrolment down 14%. 62% of universities surveyed by the Computing Research Association reported a fall. All of this happened while total undergraduate enrolment rose. American students did not stop going to college. They stopped going to the course AI had just made a worse bet, and moved into engineering technologies, mechanic and repair trades, healthcare and short certificates. Cybersecurity and dedicated AI programmes grew.
India is not insulated. Nasscom reports that workforce growth in India’s technology sector slowed to 2.3% in FY26. TCS ended FY26 with 23K fewer employees than it started with, in a year when revenue grew. India’s mass campus hiring era, in which the IT majors absorbed the output of hundreds of engineering colleges every summer, is over. That model was the single most important reason an Indian family believed a B.Tech was worth borrowing for.
So where does that leave India and Indian graduates?
India is in the most awkward position of any large economy on this specific problem, for a reason that has nothing to do with technology. India’s youthful demographics means that we are still seeing rising graduate enrolment. Unfortunately, we are adding graduates into a market that has stopped paying them, using an education system built to reward memory at exactly the moment memory became free. Three things follow.
One: rote learning and regurgitation have run out of road
The Indian system, from school onwards, is optimised for retrieval under time pressure. Learn, retain, reproduce in the exam. For fifty years that was a defensible design, because retrieval was scarce and expensive and somebody had to do it. A large language model now does retrieval at close to zero marginal cost, faster, and across a wider corpus than any student can hold in their head.
So, the single skill our education system selects for, tests for and ranks by has been commoditised. What has not been commoditised is the part our system barely teaches: framing a problem that has not been set for you, judging which of several defensible answers is right, and being accountable for that judgement. That is exactly the residue left over once AI has taken charge of data retrieval.
This is why the Stanford finding about substitution versus complementarity matters so much. A graduate trained to reproduce is a substitute for the machine. A graduate trained to direct it is a complement to it. India’s system, as currently designed, mass-produces substitutes. It is also why we are not at the table in AI, EVs, biotechnology or advanced science: an examination system that rewards memory does not produce the people who build frontier industries. India’s education system from school through to university needs fundamental reforms to be able to cope with this shift.
Two: Indians will increasingly choose not to study beyond school
The Western consumer of higher education has already begun walking away, selectively. Has the Indian consumer? Not yet, and we should be precise about that rather than claim a trend the data does not yet show.
Exhibit 5: India’s higher-education enrollment is still growing, but barely
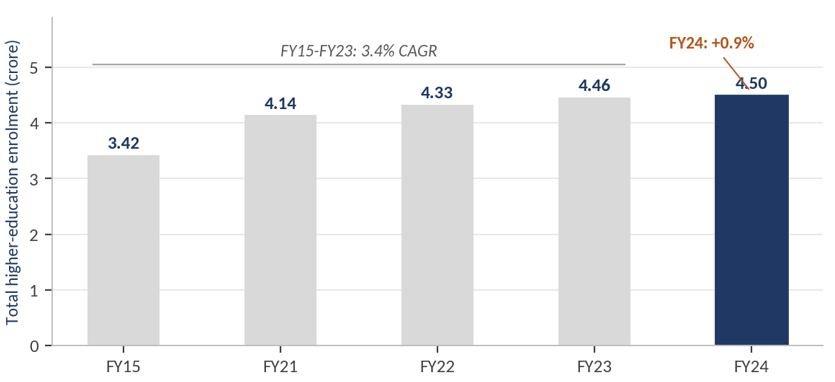
Source: Marcellus Investment Managers; All India Survey on Higher Education (AISHE) 2022-23 and 2023-24, Ministry of Education, released July 2026. FY24 refers to academic year 2023-24. Gross Enrolment Ratio rose to 30.0 from 29.5. Only years verified directly against AISHE releases are plotted; FY16 to FY20 are omitted rather than interpolated. The 3.4% CAGR is derived by Marcellus from the FY15 and FY23 endpoints. AISHE data is self-reported by institutions, with a 92% participation rate in the latest round.
Total enrolment of students in higher education in India reached a record 4.50 crore in 2023-24 and the Gross Enrolment Ratio touched 30. But growth was 0.9%, against a 3.4% compound rate over the preceding eight years. That is a marked deceleration, not a decline.
The supply side, however, is more revealing than the demand side. AICTE closed 58 engineering and technical colleges in 2025-26 and discontinued over 950 technical courses. Vacancy rates in engineering seats have run between 30% and 44%, and in Karnataka alone more than 30,000 B.Tech seats went unfilled in a single admission cycle.
So, the Indian version of the Western story has begun, and it has begun where it always begins, at the marginal institution. The tier-three engineering college that admitted anyone with a pulse is shutting. The IITs are not. What happens over the next decade is not that Indians will stop studying. It is that the undifferentiated degree stops being useful, student numbers thin out and the course is wound up. The middle of the distribution hollows out first. Even as this happens, the competition to get into the top colleges will get even more desperate because that is the only route to a decent job.
Three: the way a family saves across a lifetime has to change
This is the part that matters most to our clients, and the part that gets discussed least.
For a middle-class Indian household, education is not an expense line. It is the largest long-duration asset the family owns, and other than real estate, it is usually the only one bought with borrowed money. Household spending on education rose roughly 4.6 times between FY12 and FY24. Education inflation has run persistently above headline CPI inflation. And where savings do not cover the bill, families borrow. Unlike in the US and the UK, where the student carries the loan, in India the parent usually does. The asset sits on the child’s CV. The liability sits on the parent’s balance sheet.
Now look at the table below to understand what that balance sheet already looks like.
Exhibit 6: The Indian household balance sheet is not built for a volatile payoff
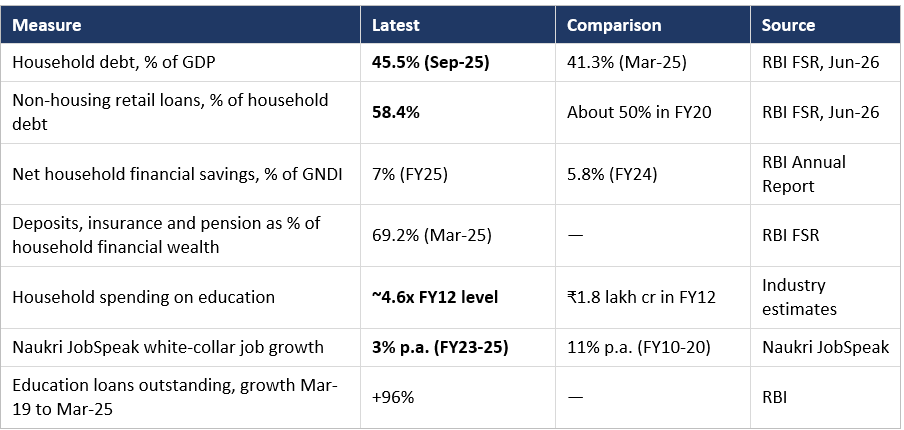
Source: Marcellus Investment Managers; RBI Financial Stability Report (June 2026); RBI Annual Report 2025-26; Naukri JobSpeak; RBI sectoral deployment data. Household education spending figures are industry estimates built off national accounts and HCES data rather than a single official series and should be read as indicative of direction rather than as precise. The savings and debt rows use different denominators (GDP and GNDI) and are not directly comparable to each other
Households are levering up, increasingly for consumption rather than for assets. White-collar job creation has slowed from 11% a year to 3% a year. And the single largest investment those households make – education for their children – is an asset whose payoff has just become materially more volatile and materially more skewed.
The parent’s mental model of education is a fixed deposit: pay in for four years, draw a salary for forty. The correct mental model for graduate education is closer to venture capital – a portfolio of bets in which most outcomes are mediocre, a few are extraordinary, and the left tail is fat. Nobody funds a venture portfolio the way they fund a fixed deposit. That is exactly what Indian households are currently doing. They are seeing university education as a safe investment in their children’s future when it is anything but safe.
What we would do about it
None of this is an argument against education. It is an argument against unpriced education, bought on the assumption of a guaranteed return that the data no longer supports. Families who have already made the investment, and those about to, need a financial plan that copes with:
- Earnings that arrive in lumps rather than in a rising monthly annuity, which means a household reserve sized for repeated spells of searching rather than for a single bad quarter;
- Debt taken down before the AI transition kicks in hard rather than during it, because education loans and household leverage are cheapest to service while the primary earner is still in a stable role;
- Insurance treated as infrastructure rather than as a tax deduction, since term life and adequate health cover are what stop one adverse event from forcing the sale of long-duration assets at the wrong price; and
- The education investment itself sized like an equity position, as a considered fraction of household net worth rather than whatever the fee schedule happens to demand.
A family that borrows five years of income for a credential with a 40% chance of clearing its salary expectation has not made an investment decision, but a cultural one. The countries ahead of us on this curve have not stopped studying. They have started choosing differently, and they started roughly two years before we did.
If you would like our help planning your goals and building wealth through this shift in what education is worth, please visit plan.marcellus.in OR scan the QR code below.

The tool designed to help user explore products and Asset allocation; shall not be considered as Investment advice.
Click Here for details about our regulatory registration and licensing information.
The above material is neither investment research, nor investment advice. Marcellus does not seek payment for or business from this material/email in any shape or form. Marcellus Investment Managers Private Limited (“Marcellus”) is regulated by the Securities and Exchange Board of India (“SEBI”) as a provider of Portfolio Management Services. Marcellus is also a US Securities & Exchange Commission (“US SEC”) registered Investment Advisor. No content of this publication including the performance related information is verified by SEBI or US SEC. If any recipient or reader of this material is based outside India and USA, please note that Marcellus may not be regulated in such jurisdiction and this material is not a solicitation to use Marcellus’s services. This communication is confidential and privileged and is directed to and for the use of the addressee only. The recipient of this material is urged to consult their own legal and tax consultants/advisors before making any investments. The recipient, if not the addressee, should not use this material if erroneously received, and access and use of this material in any manner by anyone other than the addressee is unauthorized. If you are not the intended recipient, please notify the sender by return email and immediately destroy all copies of this message and any attachments and delete it from your computer system, permanently. No liability whatsoever is assumed by Marcellus as a result of the recipient or any other person relying upon the opinion unless otherwise agreed in writing. The recipient acknowledges that Marcellus may be unable to exercise control or ensure or guarantee the integrity of the text of the material/email message and the text is not warranted as to its completeness and accuracy. The material, names and branding of the investment style do not provide any impression or a claim that these products/strategies achieve the respective objectives. Further, past performance is not indicative of future results. Marcellus and/or its associates, the authors of this material (including their relatives) may have financial interest by way of investments in the companies covered in this material. Marcellus does not receive compensation from the companies for their coverage in this material. Marcellus does not provide any market making service to any company covered in this material. In the past 12 months, Marcellus and its associates have never i) managed or co-managed any public offering of securities; ii) have not offered investment banking or merchant banking or brokerage services; or iii) have received any compensation or other benefits from the company or third party in connection with this coverage. Authors of this material have never served the companies in a capacity of a director, officer or an employee. All recipients of this material must before dealing and or transacting in any of the products referred to in this material must make their own investigation, seek appropriate professional advice and carefully read the Private Placement Memorandum/Disclosure Document, Form ADV, Form CRS and any other documents or disclosures provided to them by Marcellus, as applicable.This material may contain confidential or proprietary information and user shall take prior written consent from Marcellus before any reproduction in any form