
OVERVIEW
POPULAR ARTICLES
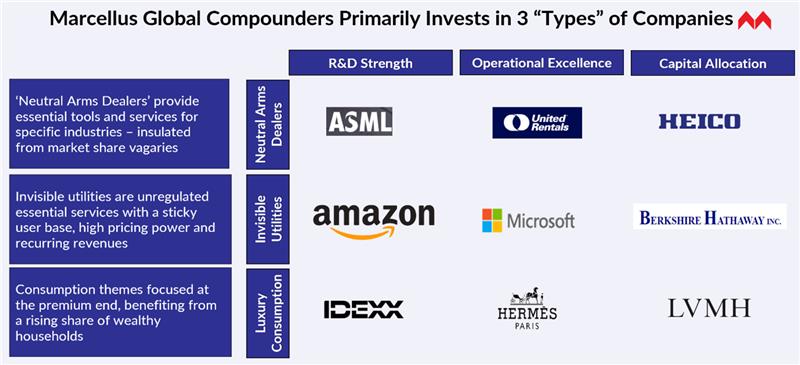
US+Canada and Developed Europe account of 51% and 14% respectively of the world’s stockmarket capitalisation of $151 trillion. In contrast, India account for a mere 3.5% of the world’s market cap. Naturally therefore there are several different types of companies which are available for investment in the developed markets which are, as yet, not available for investment in India. Examples include, ‘Neutral Arms Dealers’, ‘Invisible Utilities’ and ‘Luxury Consumption’ plays. Exposure to such investments significantly boosts your long-term investment returns.
Whilst India’s market capitalisation is nearly $5 trillion, US+Canada plus developed Europe’s market cap (including the UK) is nearly $97 trillion. Not only are the developed markets colossal relative to India, over the past decade they have compounded much faster than India. To be specific, in the decade ending Dec 2025, the S&P500 has compounded at nearly 15% (on a total shareholder returns basis) versus 11% for the Nifty50.
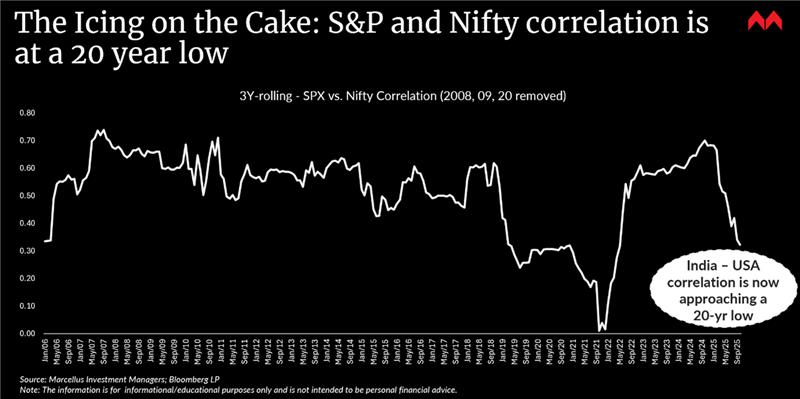
Leaving aside size and rapid compounding, there is one more important BENEFIT of investing in developed markets, namely, the correlation between American and the Indian market is very low (see chart below). This means that if you invest half your equity portfolio is each of these markets, not only do your overall returns improve, the volatility of your portfolio also reduces. In others words, you get richer whilst sleeping better at night. So, why does this happen? Why are the developed markets able to offer potent diversification for the Indian HNW investor?
There are three types of companies which are NOT yet listed on the Indian market in large numbers. Investing in developed markets gives Indian investors access to these companies thereby boosting returns whilst reducing portfolio volatility (see the opening exhibit of this note).
Type 1: ‘Neutral Arms Dealers’: Imagine you are living in the era when the Battle of Kurukshetra is being fought in the Mahabharata. How easy will it be for you to figure out whether the Kauravas will win the war or the Pandavas? Will you be able to figure out whether Arjuna will prevail or Duryodhana? Would you have a point of view on how Bhishma’s wisdom will triumph over Lord Krishna’s divine powers? We believe that real time whilst fierce competitive battles are being fought, it is hard to ascertain the ultimate victor. A simpler and more effective to profit from intensely competitive fights is to invest in the company which is supply arms & weaponry to both sides in the conflict.
One such neutral arms dealer (metaphorically speaking) is the Dutch company, ASML. Every mobile phone or computer has a chip embedded in it which acts as the Central Processing Unit for the device. For these chips to be effective, they need to have circuits etched on to them. 92% of the world’s chips are etched using ASML’s uniquely powerful Ultra-Violet Lithography machines. Given the immense complexity of these colossal machines, it is virtually impossible for any other company to compete with ASML in the manufacturing of Lithography machines. ASML does not care which side you or I choose in the iPhone vs Android phone battle because virtually all the chips for both sides are etched using ASML’s Lithography machines.
Type 2: Invisible Utility Companies: Across the world, utility companies tend to attractive investments because regardless of the state of the economic cycle, investors need these services implying that returns from these companies tend to be stable across the economic cycle Visible utilities are companies that provide electricity or gas to our houses & offices. They are usually capital intensive and tend to be regulated by the government. As a result, it is difficult for them to deliver any more than low-teens compounding. Invisible utilities on the other hand have no such restraints how fast they can compound.
The world’s largest invisible utility is Microsoft. The company generates $110 billion of revenues per annum from selling software licenses to customers such as Marcellus and from Gaming. Microsoft then generates another $170 billion of revenues from storing files and running services on the cloud. From this $280 billion of revenues, Microsoft generates profits after tax of over $100 billion. Over 50% of these profits are then reinvested by Microsoft in capex and in companies who control the technologies which will become tomorrow’s invisible utilities e.g. OpenAI, Activision Bizzard (for gaming). Using today’s profits to buy tomorrow’s tech utilities has allowed Microsoft to compound profits at 18% per annum (in $ terms) over the past 10 years, implying that Microsoft compounds profits 2.3x as fast as the Indian stockmarket.
Type 3: Luxury Consumption plays: Across the world, wealth is getting concentrated into the hands of a few thousand billionaires. Whilst the world has ~2,891 billionaires as of 2024, out of these only 358 (less than 13%) are in India. Naturally therefore, the companies that cater to these billionaires are primarily listed in the developed markets and more specifically in Paris and Milan. Given that these companies are catering to the super-rich, they tend to have very high pricing power and rapid profit compounding (usually in the high teens in $ terms).
The Microsoft of ultra-luxury consumption is Hermes. Listed in Paris and run by the Dumas family for over 180 years, Hermes makes the world’s most exclusive leather handbags for women. With volume growth of these much sought after Birkin and Kelly bags deliberately restricted to 6-7% (whilst demand is growing much faster than that), Hermes is able to: a) price these handmade bags at ~10x their production cost which is around a few thousand dollars; and b) grow profits at 15% (in $ terms) decade after decade. Hermes’ bags themselves are traded in a secondary market where the value of these bags tends to compound at 5-10% (in $ terms) depending on inflation. With no other company being able to come close to Hermes in the market for ultra-exclusive leather handbags for the world’s richest women, the company’s able to power through economic cycles has stood the test of time.
How can you benefit from all of this?
If you would like to join us in Global Compounding, please let me know. Our track record in compounding across the world is shown below. Since inception in Oct ’22, we have compounded at 27% CAGR (net of all fees & expenses in INR).
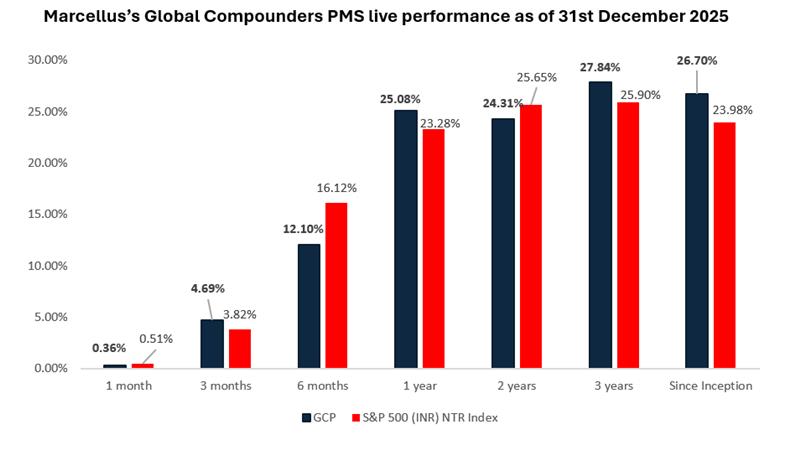
Source: Marcellus performance data is shown gross of taxes and net of fees & expenses charged till end of last month on client account. Performance fees are charged annually in December. Returns more than 1-year are annualized. Marcellus’ GCP USD returns are converted into INR using USD: INR exchange rate from RBI – Link for the reference
Note: * Since Inception performance calculated from 31st Oct 2022. The inception date is 31st Oct 2022, being the next business day after the account got funded on 28th October 2022. S&P 500 net total return is calculated by considering both capital appreciation and dividend payouts. The calculation or presentation of performance results in this publication has NOT been approved or reviewed by the IFSCA or US SEC. Performance is the combined performance of RI and NRI strategies.
Marcellus GCP PMS is offered by Marcellus Investment Managers GIFT Branch in a segregated managed accounts format. The AIF is managed by Marcellus International Investment Managers LLC which is sub-advised by Marcellus GIFT Branch. The performance is provided for reference and does not include expenses typical to AIF structure.
Thanks,
Saurabh Mukherjea
Note: The above material is neither investment research, nor investment advice. Marcellus Investment Managers Private Limited (“Marcellus”) is regulated by the International Financial Service Centre Authority (Fund Management) Regulations, 2025 (earlier 2022) (“IFSCA”) as Fund Management Entity – Nonretail, rendering Investment Management Services. Marcellus is also registered with US Securities and Exchange Commission (“US SEC”) as an Investment Advisor. No content of this publication including the performance related information is verified by IFSCA or US SEC. If any recipient or reader of this material is based outside India or US, please note that Marcellus may not be regulated in such jurisdiction and this material is not a solicitation to use Marcellus’s services. This communication is confidential and privileged and is directed to and for the use of the addressee only. The recipient, if not the addressee, should not use this material if erroneously received, and access and use of this material in any manner by anyone other than the addressee is unauthorized. If you are not the intended recipient, please notify the sender by return email and immediately destroy all copies of this message and any attachments and delete it from your computer system, permanently. No liability whatsoever is assumed by Marcellus as a result of the recipient or any other person relying upon the opinion unless otherwise agreed in writing. The recipient acknowledges that Marcellus may be unable to exercise control or ensure or guarantee the integrity of the text of the material/email message and the text is not warranted as to its completeness and accuracy. The material, names and branding of the investment style do not provide any impression or a claim that these products/strategies achieve the respective objectives. Marcellus and/or its associates, employees, the authors of this material (including their relatives) may have financial interest by way of investments in the companies covered in this material.
This material may contain confidential or proprietary information and user shall take prior written consent from Marcellus before any reproduction in any form.
Data/information used in the preparation of this material is dated and may or may not be relevant any time after the issuance of this material. Marcellus takes no responsibility of updating any data/information in this material from time to time. The recipient of this material is solely responsible for any action taken based on this material. The recipient of this material is urged to read the Disclosure Document/Form ADV, Form CRS and any other documents or disclosures provided to them by Marcellus, as applicable, and is advised to consult their own legal and tax consultants/advisors before making any investment in the portfolio.
All recipients of this material must before dealing and or transacting in any of the products referred to in this material must make their own investigation, seek appropriate professional advice and carefully read the Disclosure Document, Form ADV, Form CRS and any other documents or disclosures provided to them by Marcellus, as applicable. Actual results may differ materially from those suggested in this note due to risk or uncertainties associated with our expectations with respect to, but not limited to, exposure to market risks, general economic and political conditions globally, inflation, etc. There is no assurance or guarantee that the objectives of the investment strategy/approach will be achieved.
This material may include “forward looking statements”. All forward-looking statements involve risk and uncertainty. Any forward-looking statements contained in this document speak only as of the date on which they are made. Further, past performance is not indicative of future results. Marcellus and any of its directors, officers, employees and any other persons associated with this shall not be liable for any loss, damage of any nature, including but not limited to direct, indirect, punitive, special, exemplary, consequential, as also any loss of profit in any way arising from the use of this material in any manner whatsoever and shall not be liable for updating the document.