
OVERVIEW
POPULAR ARTICLES
A confluence of factors – surging power demand, higher defence spend, climate change, AI, shortage of oil & gas – is driving an unprecedented burst of global capex with Europe and America at the vanguard. This surge in capex, which overshadows the scale of capex seen even during World War II, has over the past four years created several valuable investment opportunities for our Global Compounders Portfolio.
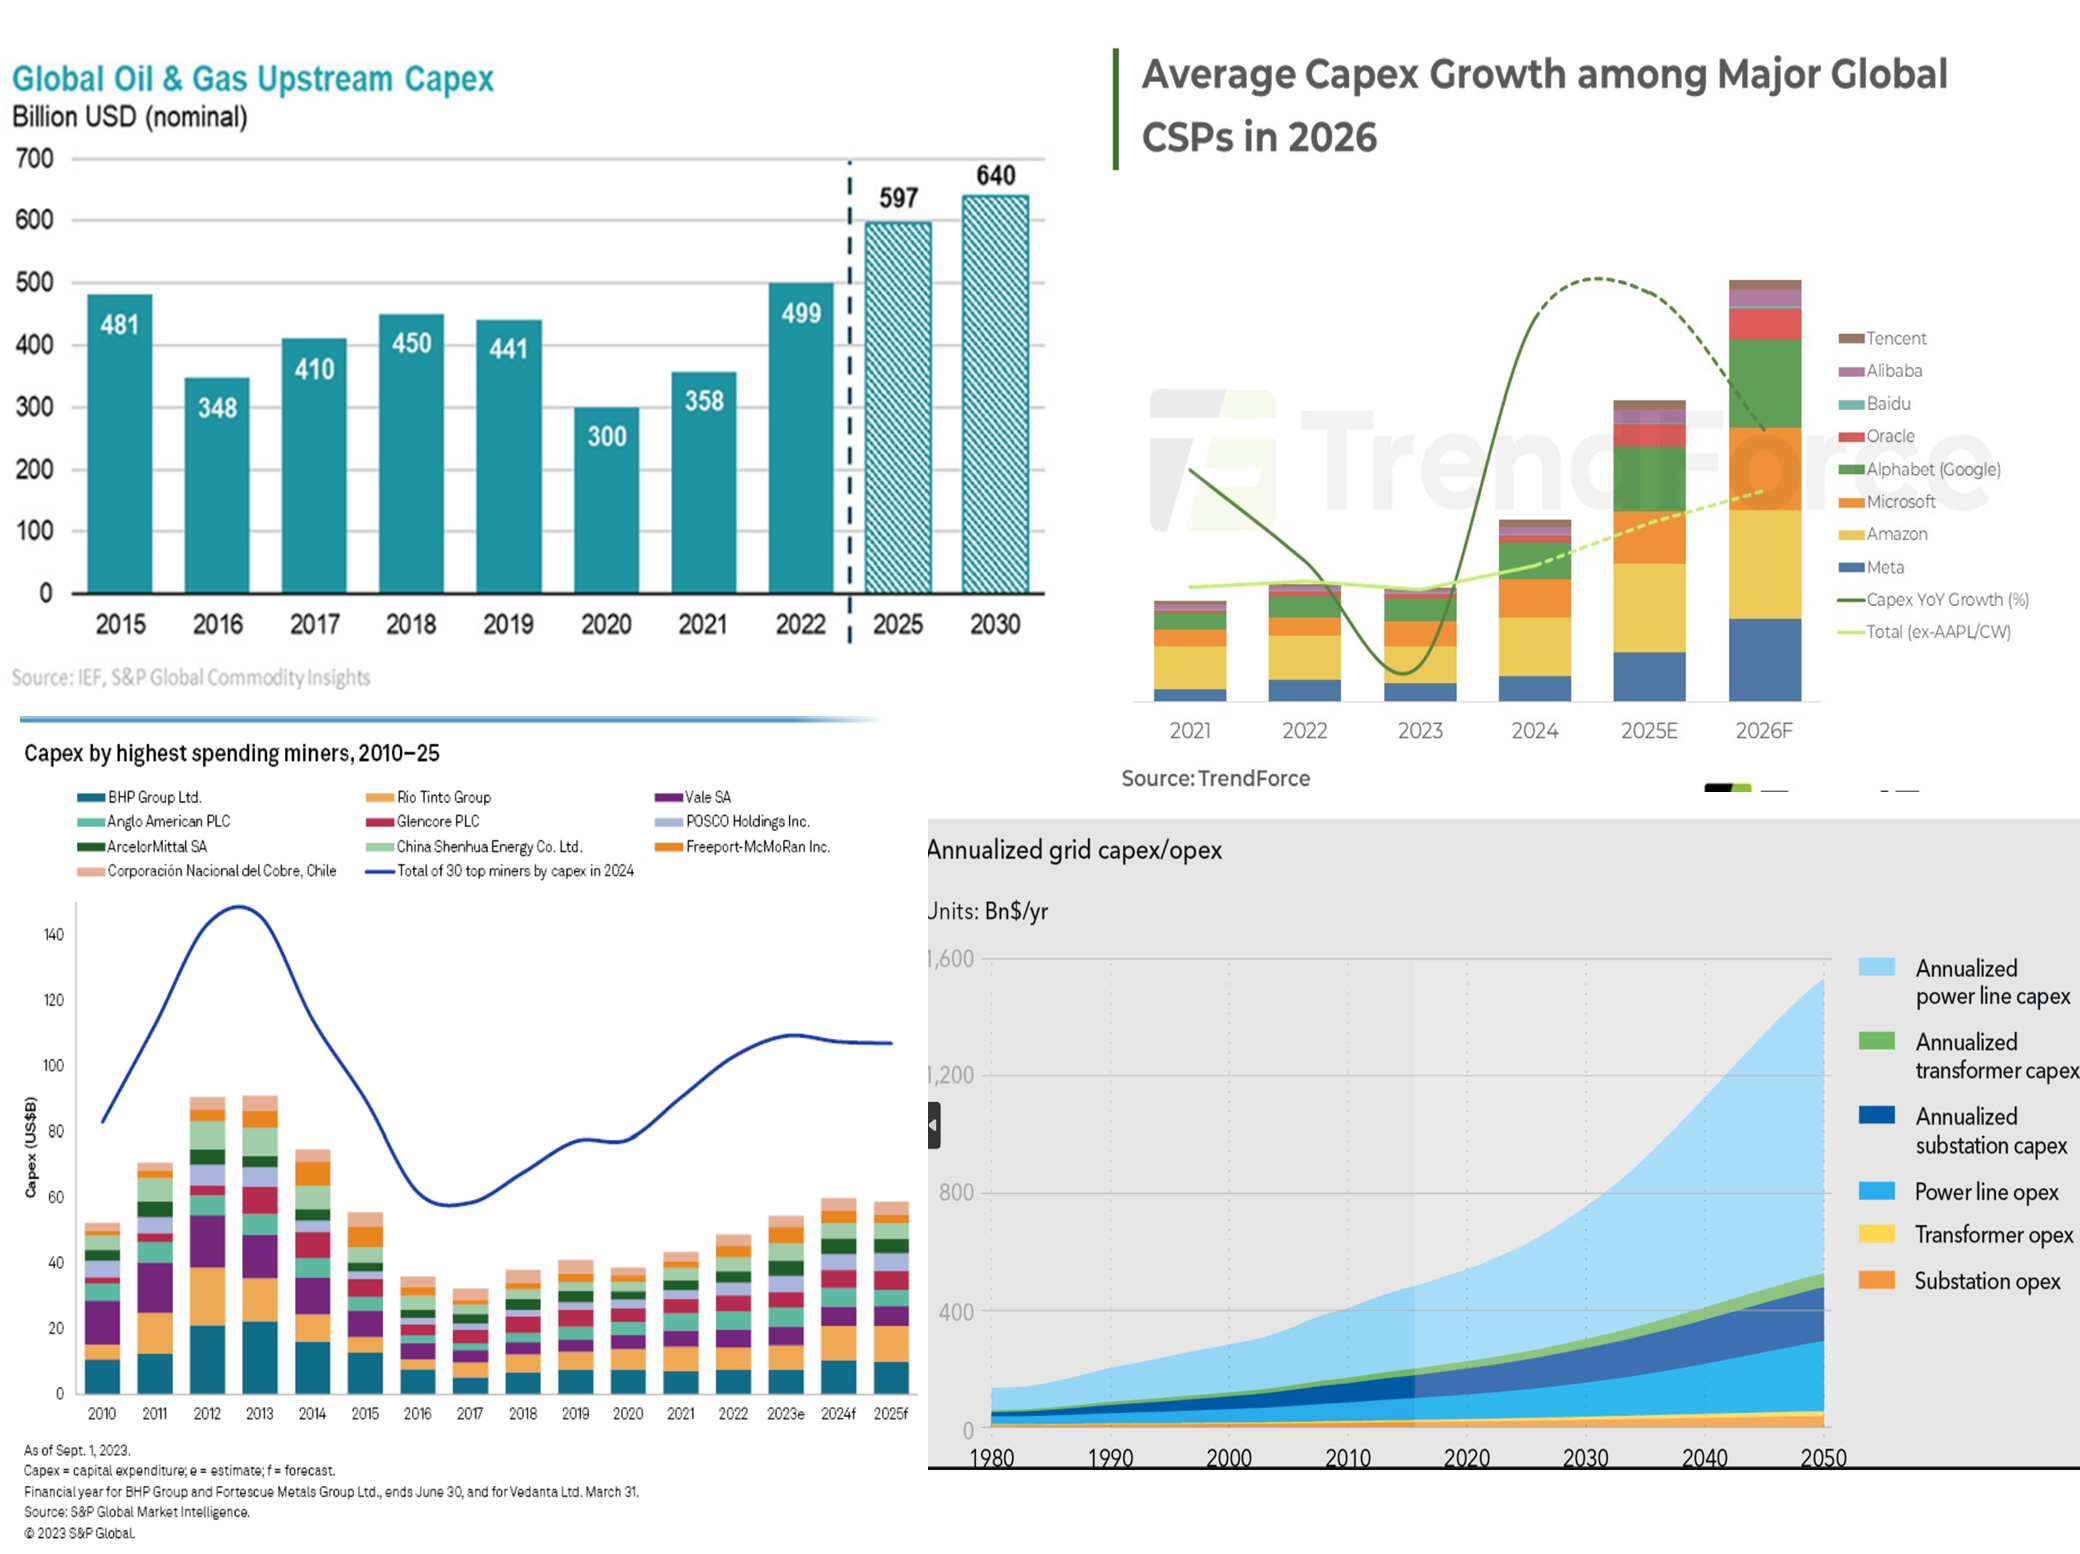
Source for the charts: Clockwise from top left: IEF (i); Trendforce (ii); PNG Kit (iii); S&P Global (iv)
Expressed in today’s dollars, the capex done during World War II was around $1 trillion per year. In that context, what we are currently witnessing is a much bigger global capex boom. Global capex directly related to AI alone (i.e. LLMs, chips, datacentres) is projected to be in cumulatively more than the $5 trillion mark. (v) But as the charts above (from a range of sectors) show there is so much more to the ongoing global capex boom than AI.
In our 12th Feb ’26 blog Profiting from Defence & Aerospace in this Age of Rage, we highlighted how the multi-trillion-dollar boom in Aerospace & Defence is leading to the 10-year backlogs in the order books of European and American manufacturing giants such as GE Aerospace and Airbus.
In our 24th Feb ‘26 blog Profiting from the Global Upsurge in Electricity Demand, we explained how surging demand for power (electricity demand growth has jumped from 2.7% p.a. before Chat GPT was launched in 2022 to 4% p.a. since then) is leading to $0.6 trillion per annum of capex on power generation.
Then in in our 6th Mar ’26 blog Profiting from the $1 trillion Global Market in Small Industrial Machines & Components , we highlighted how the preceding two factors – ramped up spend on defence, aerospace & power – has resulted in the global market for small industrial machines and components growing at 5-7% per annum in $ terms.
While all the above are creating investment opportunities for my colleagues in Marcellus’ Global Compounders team, several of our clients have written to me over the past month inquiring how on earth this is happening. After all, until a few years ago the standard thesis was the Asia would lead the capex charge with America following and Europe lagging. Why has this thesis been turned on its head in the past 3 years with Europe and America firmly at the forefront of the global capex surge?
In our 6th Mar ’26 blog Profiting from the $1 trillion Global Market in Small Industrial Machines & Components , we discussed three of the factors which are compelling Europe and America to surge ahead of Asia in the capex race, namely, acute labour shortages (which is driving automation of factories and offices even as the working age population shrinks in the developed world), the move towards energy efficiency in Europe and re-shoring from China to western countries driven by hundreds of billions in subsidies and tax credits (e.g. Reliance Industries’ announcement $300bn of capex to set up an oil refinery in USA). (vi, vii, viii)
However, there are three more drivers which are now structurally embedded in the psyche of Western leaders and these drivers are compelling them to hit the capex button:
1. As visitors from India to the West cannot but help notice, outdated urban infrastructure proliferates in big cities like London, Paris, New York, Philadelphia and Chicago. California’s power grid almost collapsed in 2022; US pipes give rise to a water leak every two minutes; more than 45,000 bridges and one in almost two miles of road are in poor condition, according to The American Society of Civil Engineers (ASCE) (ix) “McKinsey estimates a cumulative infrastructure investment need of about USD 106 trillion through to 2040, particularly in sectors such as transport and logistics, energy and power, and digital infrastructure.” (x) Investing in high quality urban infrastructure using taxpayers’ money is now a vote-winning imperative for Western politicians.
2. With America and China now locked into a bipolar face-off and with China using rare earth access as a bargaining chip, accessing critical minerals has become a national priority for every major economy. “The US Department of Energy (DOE) aims to develop a reliable, affordable, sustainable, and secure domestic supply chain for critical minerals…Similarly, the US Department of War (previously the Department of Defense) is investing in public mining companies to strengthen the US supply chain…Europe and other regions are also ramping up investment at home to achieve at least partial self ‑sufficiency…” (xi)
3. We are seeing an unprecedented wave of technological innovation across the developed world. Due, in part, to a dramatic boost from generative AI, technological innovation has continued to aid with productivity growth (xii). Just as importantly – from a capex perspective – when the world shifts from old to new technology (eg. from the steam engine in 1880 to electricity over the next 50 years), the entire production process has to be rebuilt. Therefore, the advent of AI doesn’t just mean more demand for Nvidia’s GPUs, it also means the factories will need a step-up in Internet-of-Things & sensor enabled machines/robots which allow efficiency gains to be reaped. (xiii)
The world has not seen capex on this scale ever before. As investors we can positioning ourselves to capitalize on it. A couple of companies who are well placed to to ride this global capex upsurge are Ametek and Heico.
Founded nearly a century ago, headquartered in Berwyn, Pennsylvania and listed on the NYSE, Ametek is a global designer and manufacturer of electronic instruments and electromechanical devices. Ametek makes analytical instruments, monitoring, testing and calibration devices as well as aerospace motors, electrical motors, pumps, heat exchangers, heavy duty cables, starter generators, 3D imaging solutions and interconnects (xiv). The firm is one of the world’s leading manufacturers and developers of process position feedback solutions (xv). Ametek’s competitive advantages are built upon around proprietary technologies and a intellectual property portfolio of 3,800 patents. The firm’s robust innovation pipeline is evident in recent patent grants in 2025 for surge suppressors and material property measurement devices (xvi). Over the past decade, Ametek’s share price has risen 5.6x in INR terms.
Founded in 1957, headquartered in Hollywood, Florida, and listed on the NYSE, Heico designs, manufactures, and distributes components for a range of industries including aviation, defense and space. Almost every flight you have ever taken will have thousands of components made by Heico. The firm has a multi-decadal track record of making successful acquisitions—completing more than 90 acquisitions since the 1990s (xvii). Heico’s primary competitive advantages are its market leadership in FAA-approved Parts Manufacturer Approvals (PMAs) for aerospace, offering 30-50% cost savings over OEMs, and a high-moat, niche focus on critical, high-reliability electronic components. Their model thrives on regulatory barriers, extensive reverse-engineering expertise, and a “generic drug” approach to aviation parts (xviii). Over the past decade, Heico’s share price has risen 13.8x in INR terms.
Investment implications for you
The world has not seen capex on this scale ever before. As investors, we are strategically positioned to participate in this upsurge. Our Global team has made several investments over the past year to help our clients pursue global diversification through allocation to companies which are benefitting from this new era of high-tech industrialisation. Thanks to the regulatory reforms expedited by the Indian authorities over the past couple of years (see our 7th January ‘26 blog: https://marcellus.in/blogs/four-mega-reforms-which-opened-up-global-investing-for-indians/ ), we Indians are now able to diversify globally in a cost-efficient and tax-efficient manner and benefit from this new age of rage. Our track record in compounding across the world is shown below. Since inception in Oct 2022, the strategy has delivered at ~26% CAGR (net of all fees & expenses in INR).
If you would like more information about our global strategy, please reach out to us by replying to this email.
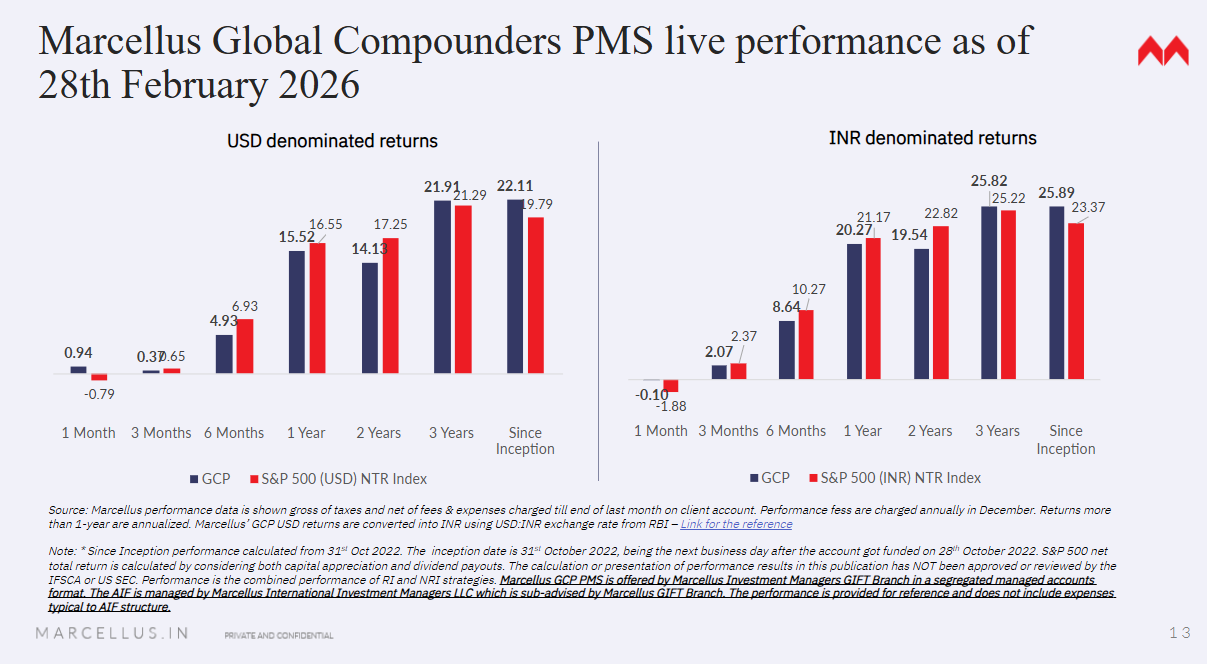
Source: Marcellus performance data is shown gross of taxes and net of fees & expenses charged till end of last month on client account. Performance fees are charged annually in December. Returns more than 1-year are annualized. Marcellus’ GCP USD returns are converted into INR using USD: INR exchange rate from RBI – Link for the reference
Note: * Since Inception performance calculated from 31st Oct 2022. The inception date is 31st Oct 2022, being the next business day after the account got funded on 28th October 2022. S&P 500 net total return is calculated by considering both capital appreciation and dividend payouts. The calculation or presentation of performance results in this publication has NOT been approved or reviewed by the IFSCA or US SEC. Performance is the combined performance of RI and NRI strategies.
Marcellus GCP PMS is offered by Marcellus Investment Managers GIFT Branch in a segregated managed accounts format.
Thanks,
Saurabh Mukherjea
Stocks Ametek and Heico are part of the Global Compounders Strategy managed from GIFT City by Marcellus and regulated by IFSCA. Marcellus, its employees, their relatives, and clients have an interest in these stocks.
References:
ii 2026 Cloud AI Outlook: NA Hyperscalers Target GPU & ASICs | TrendForce
iii.Download Annualized Grid Capex/opex By Year And Region Source – Diagram – Full Size PNG Image – PNGkit
iv. Capex for 30 biggest-spending miners to rise 6.2% in 2023 | S&P Global
v. https://www.linkedin.com/pulse/largest-global-capital-formation-history-ai-zachary-cefaratti-fyjuf/
vi. https://www.sap.com/sea/products/scm/industry-4-0/what-is-industry-4-0.html
vii. https://www.marketsandmarkets.com/Market-Reports/europe-smart-factory-market-254889723.html#:~:text=OVERVIEW&text=The%20Europe%20smart%20factory%20market,continues%20to%20drive%20market%20expansion
viii. https://www.powermation.com/blog/2026-macro-outlook-for-u-s-manufacturing-in-industrial-automation/#:~:text=Demand%20hotspots%20(2026%E2%80%932030),Energy%20&%20electrification%20equipment
ix. A new capex supercycle: driving powerful and transformative growth | Ninety One | United Kingdom
x. Capex is back: what’s driving the 2026 boom – explained | LGT
xi. Capex is back: what’s driving the 2026 boom – explained | LGT
xii. The Next Leg of the Capex Revival | William Blair
xiii. A new capex supercycle: driving powerful and transformative growth | Ninety One | United Kingdom
xiv. https://en.wikipedia.org/wiki/Ametek
xv. https://www.ametekfactoryautomation.com/
xvi. https://matrixbcg.com/blogs/competitors/ametek
xvii. https://en.wikipedia.org/wiki/HEICO
xviii. https://matrixbcg.com/blogs/competitors/heico#:~:text=What%20Gives%20Heico%20Cos,than%20500%20new%20approvals%20annually
This material is for informational purposes only and does not constitute investment advice, an offer, or a solicitation to buy or sell any securities. Past performance is not indicative of future results. All company references are for illustrative purposes only and do not represent recommendations. Projections are based on third‑party sources and may change. Investors should consult their financial advisor before making investment decisions.