OVERVIEW
POPULAR ARTICLES

In Breakpoint we showed that India’s middle class has been pulverised — white-collar job creation has stopped, real wages have gone backwards for nearly a decade, and the gap has been plugged with debt. That damage is now visible in the numbers that used to define Indian consumption. FMCG volume growth has fallen from 12% in FY11 to 3% in FY26; consumer durable volume growth has slipped from double digits to mid-single digits. Consumption in India now is being rebuilt around three new pillars: 1) elite consumption is booming as a new class of owner-operators prospers, 2) middle-class consumption is now financed by credit rather than by income, and 3) the state is withdrawing from providing public services to doling out large cash transfers each year to low-income voters. Over the past couple of years, Marcellus has rewired its portfolios around these new drivers of consumption. Visit invest.marcellus.in to join us on our compounding journey, or email me to discuss our strategies.
“Hazaaron khwahishein aisi, ki har khwahish pe dam nikle
Bohot nikle mere armaan, lekin phir bhi kam nikle” [A thousand desires, each one worth dying for. Many were fulfilled — and still, too few]
Bohot nikle mere armaan, lekin phir bhi kam nikle” [A thousand desires, each one worth dying for. Many were fulfilled — and still, too few]
— Mirza Ghalib
The old consumption engine has stalled
For twenty years the Indian consumption was easy to understand. A widening middle class bought its first packaged shampoo, then its first two-wheeler, then its first air conditioner, and the companies selling those things compounded earnings without having to think very hard about it. That reality is now largely over. FMCG volume growth has collapsed from 11% in FY11 to 3% in FY26. Consumer durable volume growth has followed a similar pattern, and even smartphone volumes — a category with easy financing and near-universal desire — are struggling to grow. Nestlé India’s Managing Director put it plainly when he observed in October 2024 that the middle class seems to be shrinking (source: Shrinking middle class hitting FMCG firms: Nestle India – Industry News | The Financial Express).
We have written extensively about the drivers of this middle-class consumption slowdown in our bestselling book “Breakpoint: The Crisis of the Middle Class & The Future of Work”. IT job listings have shrunk at a 12% CAGR over FY23-25 and BPO listings at 28%, while white-collar listings overall are down about 20% since generative AI arrived at scale in 2022. Eight million new graduates enter the job market every year. Azim Premji University’s research shows that only 4% of them full-time white collar work (source: SWI 2026 – Web.pdf). Real wages for Nifty 50 employees have been shrinking at 4% a year since FY16. Meanwhile the true cost of a middle-class life — school fees, hospital bills, transport costs, a decent thali — compounds at roughly 9% a year. Annual income growing at 0.4% a year cannot fund cost of living growing at 9% a year. Naturally therefore, we have seen an explosion in household debt (see The Most Indebted People in the World – Marcellus, March 2026 blog on this subject).
However, private final consumption is about 60% of GDP and therefore this sector is too important for it to slow down abruptly. A combination of free market forces and state intervention has given consumption growth in India three brand new drivers.
Change #1: the top is pulling away
India now has roughly 350,000 ‘octopus’ families — about a million individuals — whose wealth has risen more than 16-fold in twenty years (source: BCG Global Wealth Report, 2020). The number of Indians filing Income Tax returns above ₹1 crore is up seven times in twelve years . This is NOT the old elite. For the first time, a majority of the directors of Nifty 50 companies hold ordinary Indian degrees — not IIT, not IIM, not educated abroad. The old-style conglomerates are fading, and a new type of owner-operator is rising, often from India’s smaller cities, using technology and political access to grow revenue at 15%-plus with very little headcount addition and very little debt.
Exhibit 1: The new crorepati class is not the old elite — it went to ordinary Indian colleges
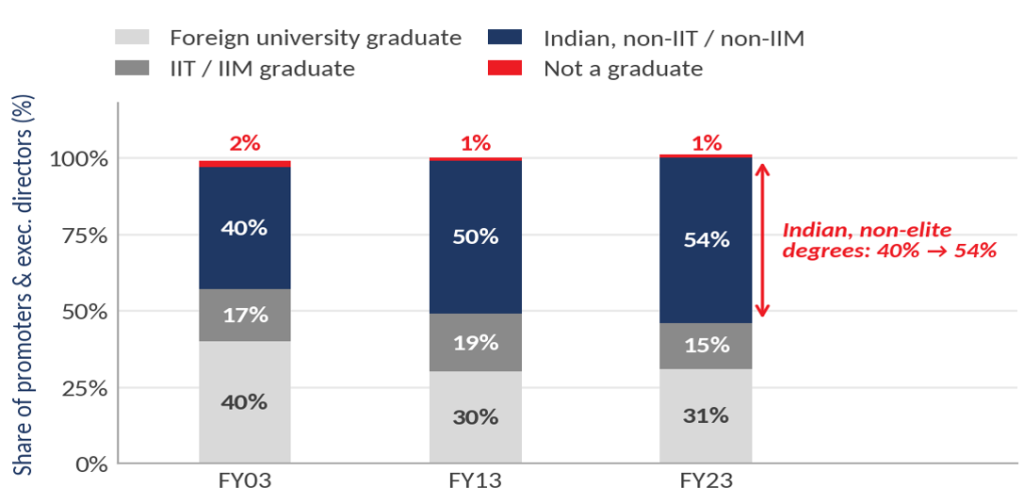
Source: Marcellus Investment Managers, company annual reports, Bloomberg. Non-overlapping promoters and executive directors of the Nifty 50 constituents as of each respective financial year; FY03 identified from company annual reports, FY13 and FY23 from Bloomberg. Directors whose educational qualification was not disclosed are excluded, so bars may not sum to 100%. See our blog on the subject for the full methodology.
There is a second, less obvious engine behind this. Indian IT services were the country’s forex machine; the dollars they earned kept the rupee firmer than the trade account alone would justify. As AI compresses the IT services model, those dollars thin out, the rupee weakens, and Indian manufacturing exporters become structurally more competitive. The city of Pune is a prime example of both the changes: Hinjewadi is where the IT export model is unwinding, and Pimpri-Chinchwad and the MIDC belt are where the currency and Free-Trade Agreements benefit accrues. The India-EU trade deal opens an addressable market of about US$5 trillion at post-deal tariffs of roughly 0-5%, against FY25 exports to the EU of only US$50bn. The wealth being created in the second Pune is what funds the consumption boom we can see at the top end.
The decline of the white collar middle class and the rise of the new elite can be most visibly seen in the real estate market. In the housing market, homes below ₹1.5 crore have fallen from 85% of new launches in Q1 2022 to 47% in Q1 2026, while the ₹1.5-4 crore band has gone from 14% to 44%. Developers are not being sentimental; they are building for the buyer who exists and has the ability to pay.
Exhibit 2: Developers have rebuilt their launch pipeline around the top end
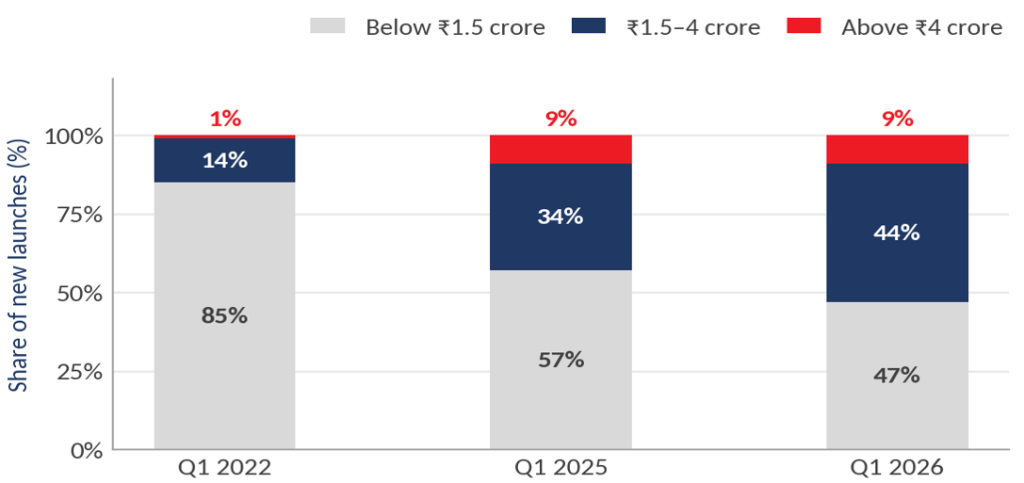
Source: Marcellus Investment Managers; CareEdge Ratings (August 2026) on new launch supply mix across the top seven cities; ANAROCK Research Q1 and Q2 2026 Residential Market Viewpoints. Average price reached ₹9,456 per sq ft in Q1 2026, up 7% year on year, with NCR up about 15%. Unsold inventory stands at about 6.0 lakh units, with launches outpacing sales for the first time since 2021 — so the mix shift is a supply decision as much as a demand signal. Bars may not sum to 100% because of rounding.
Change #2: the middle class now consumes on credit, not on income
Aspiration does not fall just because income does. A middle-class household that watches the octopus class on its phone all day still wants the holiday, the phone and the car. With wages flat, there is only one way to fund that gap, and Indian households have found it. India’s non-housing household debt is now the highest in the world as a share of GDP — above the US, above China. About 40% of annual income goes to servicing debt. 67% of personal loan borrowers took their first loan before the age of 30, and 5-10% of retail borrowers are, on any reasonable definition, in a debt trap. (See Chapter 6 of our book ‘Breakpoint’ for more information.
Exhibit 3: India’s non-housing household debt is now the highest in the world.
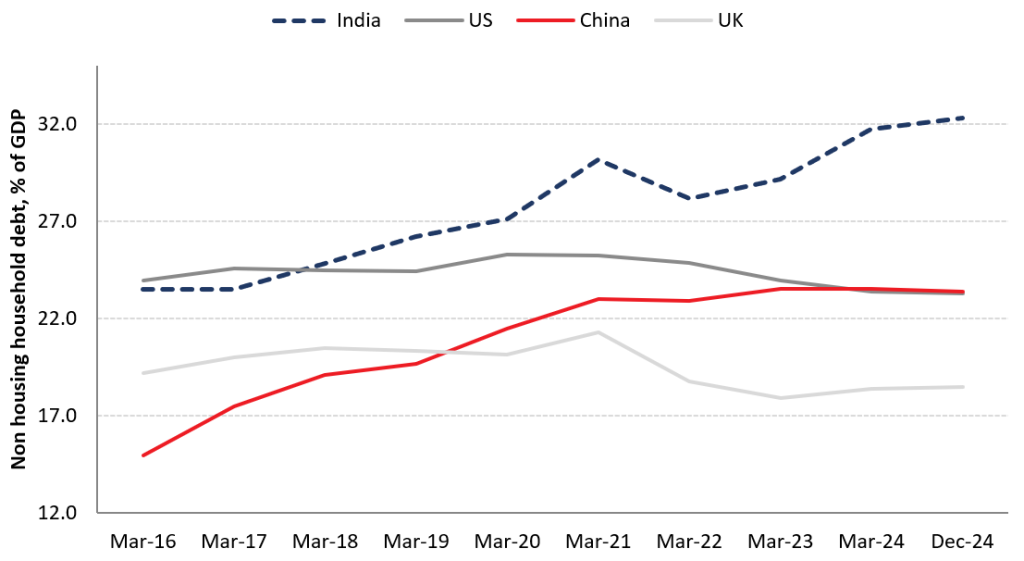
Source: Marcellus Investment Managers; Bank for International Settlements and RBI household debt data as presented in Breakpoint. Non-housing household debt as a percentage of GDP; India includes retail credit from banks and NBFCs. Cross-country comparisons of household debt are sensitive to what is counted as non-housing credit and to the treatment of informal lending, which is substantial in India and largely absent from these figures; read the trajectory rather than the exact spread.
What makes this a live issue rather than a background worry is that the consumption recovery India has just reported is a financed recovery. Private final consumption expenditure grew 7.7% in FY26 against 5.8% in FY25, and 7.1% in Q1 FY27. That rests on two legs: the GST 2.0 rate cuts from September 2025, and a credit impulse. Non-food bank credit accelerated from 9.9% to 19.1% in the year to July 2026 and retail credit from 11.9% to 16.2%. Neither leg is income.
Exhibit 4: The credit impulse is real — but it is not flowing to discretionary consumption.
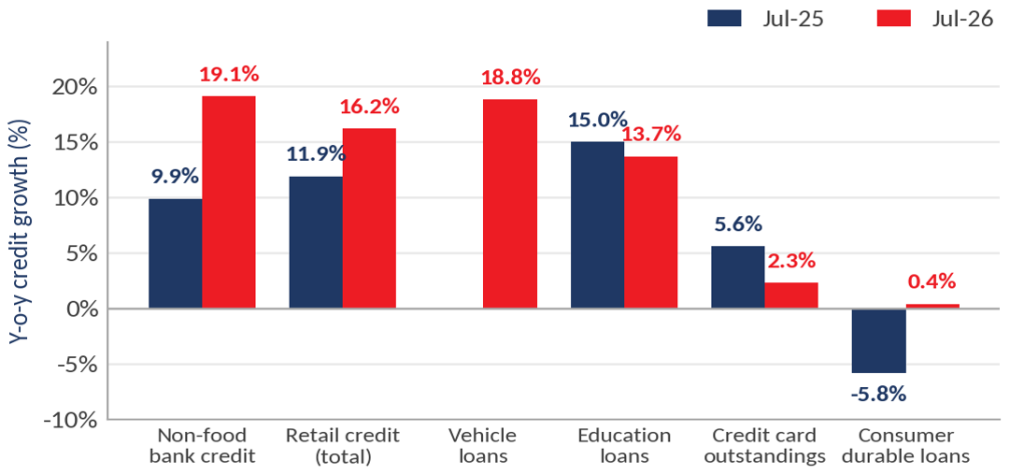
Source: Marcellus Investment Managers; Reserve Bank of India, Sectoral Deployment of Bank Credit, fortnight ended 31 July 2026 (released 31 August 2026), covering 41 select scheduled commercial banks that account for about 95% of non-food credit. Housing credit grew 11.3% and gold jewellery loans 88.1%, against 136.4% a year earlier. Jul-25 vehicle loan growth is not shown on a comparable basis in the source release.
Look closely where the money is and is not going. Vehicle loans are growing at 18.8% and gold loans at 88.1%. But credit card outstandings have decelerated to 2.3% from 5.6%, and consumer durable loans are effectively flat at 0.4% while the system runs at 19%. Lenders are extending secured, collateralised credit and pulling back from the unsecured, discretionary kind. That is exactly the behaviour you see when underwriters have started to worry about the borrower’s repayment capacity. The overall consumption print looks healthy but the underlying detail points to a weakening household sector.
Change #3: the state is pivoting from proving public service to handing out cash
We have argued in our work on the fading nation state that as capital becomes mobile and formal employment shrinks, governments lose the ability to collect taxes at the rate their commitments require. India is a textbook case. Interest alone consumed 38% of the Centre’s revenue receipts in FY26RE (the highest ratio among any large economy). Interest payment at ₹12.74 lakh crore is the single largest head of expenditure for the central government, larger than defence. At the state level, 62% of revenue receipts go to pay, pensions, interest and subsidies before a single new school or hospital is built.
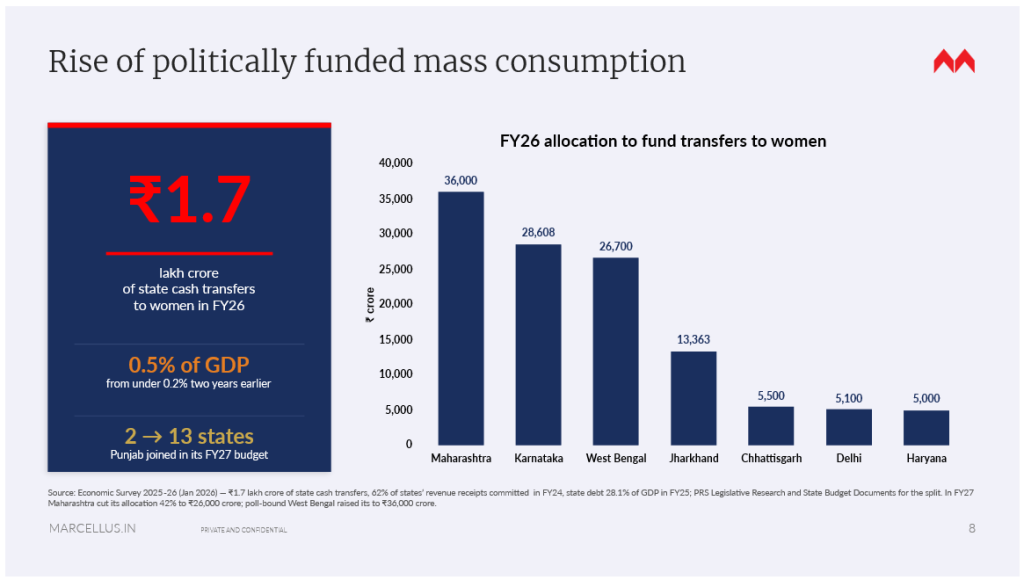
What is left over is not going into services. It is going into cash transfers. State cash transfers to women reached ₹1.7 lakh crore in FY26, about 0.5% of GDP, up from under 0.2% two years earlier, and the number of states running such schemes has gone from two to thirteen. The state has swapped the provision of services for the transfer of cash. Cash transfers win elections; schools and hospitals don’t. The consequence for households is that they now buy privately, at a price, what the government used to provide free.
Exhibit 5: Government schools have lost nearly seven percentage points of enrolment share in four years.
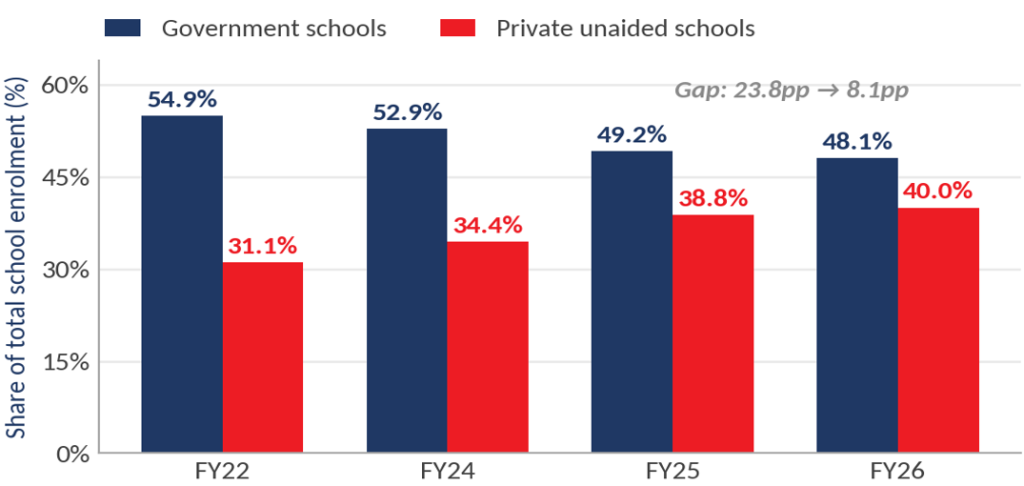
Source: Marcellus Investment Managers; UDISE+ 2025-26 (Existing Structure), released July 2026, Ministry of Education. Government share excludes government-aided schools, which account for roughly 10% of enrolment, so the two series do not sum to 100%. The number of government schools fell by 4,338 in 2024-25. FY23 is not plotted because UDISE+ changed its reporting structure in that year.
Exhibit 6: The private sector already provides most of what households consider essential
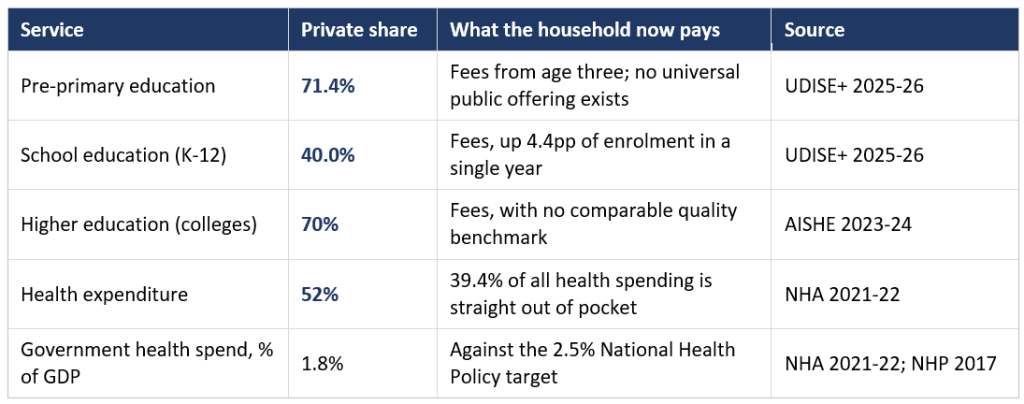
Seven in ten pre-schoolers and four in ten school children are already in fee-paying institutions. Just over half of health spending is non-government, with 39% paid straight out of pocket. This new transfer of public services spending from the government to households flatters consumption growth. In parallel, the cash transfers from the government to voters are large, fast growing and increasingly important in shoring up consumption.
Exhibit 7: State cash transfers to women as a percentage of GDP
Investment Implications
In this new, rewired India, three things follow for those seeking to grow their wealth via the stockmarket.
- Own boring franchises that compound. As a large chunk of IT services manpower is laid off because of AI, the hit lands directly on the domestic consumption that is 60% of GDP. In that environment, the wisest strategy is to own quality franchises that are unexciting but steadily compound earnings year after year. Our Consistent Compounders Portfolio (CCP) has already started benefiting from this in the current financial year.
- Public services provided by the private sector will be a lucrative source of compounding for long-term investors. We have invested in several such franchises spanning hospitals, medical devices, medical insurance and pharmaceuticals.
- As IT Services throttles off as a source of forex generation, as the INR weakens at a more rapid rate to the 5% p.a. it used to fall at, manufacturing exports are also becoming a source of long-term compounding. We have invested in several such franchises spanning textiles, auto, auto ancillaries, engineering exports and pharma ancillary exports.
The results of this rewiring of our portfolios around India’s new realities have begun showing up in FY27 – see chart below
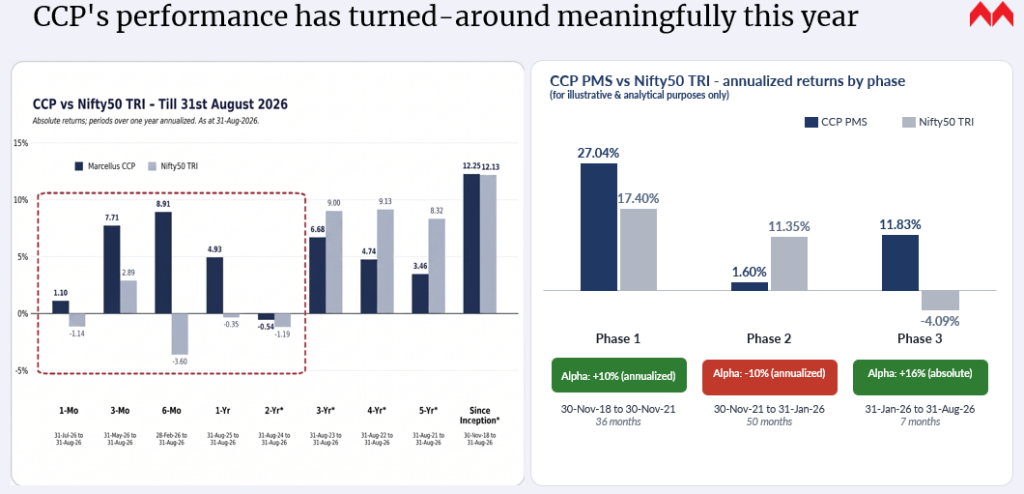
Marcellus Performance Data shown is net of fixed fees and expenses charged till latest quarter and is net of Performance fees charged for client accounts, whose account anniversary / performance calculation date falls upto the last date of this performance period; since inception & 3 years returns are annualized; other time period returns are absolute. For relative performance of particular Investment Approach to other Portfolio Managers within the selected strategy, please refer https://www.apmiindia.org/apmi/welcomeiaperformance.htm?action=PMSmenu, Under PMS Provider Name please select Marcellus Investment Managers Private Limited and select your Investment Approach Name for viewing the stated disclosure. The calculation or presentation of performance results in this publication has NOT been approved or reviewed by the SEC, SEBI or any other regulatory authority.
If you would like to join us in compounding wealth through clean, well-managed companies, please visit invest.marcellus.in or scan the QR code below.

This tool is designed to help users explore products and asset allocation guidance; it does not constitute a formal financial plan or investment advice.
Disclaimer:
Click Here for details about our regulatory registration and licensing information.
The above material is neither investment research, nor investment advice. Marcellus does not seek payment for or business from this material/email in any shape or form. Marcellus Investment Managers Private Limited (“Marcellus”) is regulated by the Securities and Exchange Board of India (“SEBI”) as a provider of Portfolio Management Services. Marcellus is also a US Securities & Exchange Commission (“US SEC”) registered Investment Advisor and is regulated by the International Financial Services Centres Authority (IFSCA) as a Fund Management Entity. No content of this publication including the performance related information is verified by SEBI, IFSCA or US SEC. If any recipient or reader of this material is based outside India and USA, please note that Marcellus may not be regulated in such jurisdiction and this material is not a solicitation to use Marcellus’s services. The PMS strategy, Category III AIF products and IFSCA retail schemes are distinct offerings with different regulatory frameworks, risk profiles, fee structures and investment thresholds. Investors should refer to product-specific documents for details before investing. All recipients of this material must, before dealing and or transacting in any of the products and services referred to in this material, make their own investigation and seek appropriate professional advice. Past performance is not indicative of future results. Marcellus and/or its associates, the authors of this material (including their relatives) may have financial interest by way of investments in the companies covered in this material. Marcellus does not receive compensation from the companies for their coverage in this material. This material may contain confidential or proprietary information and user shall take prior written consent from Marcellus before any reproduction in any form. As per SEBI Master Circular dated June 07, 2024, clients have an option to be on-boarded directly by the Portfolio Manager without intermediation of persons engaged in distribution services.