OVERVIEW
POPULAR ARTICLES

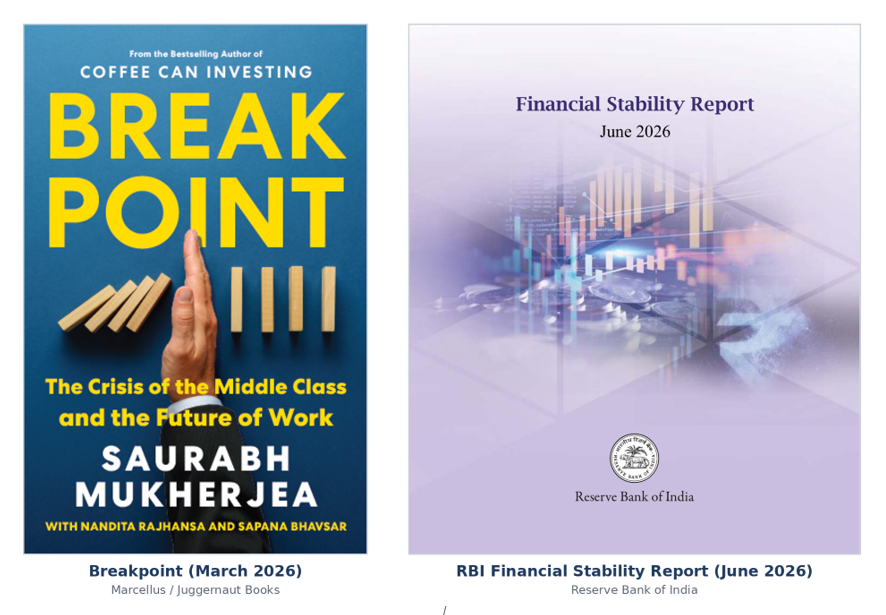
Our bestselling book, Breakpoint, shows that India’s middle class is buckling under a debt load that has no equal in any other large economy — a case we built in no small part using the RBI’s own Financial Stability Reports (FSRs). The RBI’s latest FSR, released in June 2026, keeps ringing the same alarm bells, even as its headline language stays soothing: 1) household leverage is at a record high and is increasingly being taken on for consumption rather than asset creation; 2) early-stage stress in unsecured retail is rising even as headline bad loans fall; and 3) the clean headline is being flattered by heavy write-offs and by the refinancing of stressed borrowers. For investors, history is unusually clear about the read-through: when earnings slow and the consumer is stretched, Quality outperforms. You can reach us via connect.marcellus.in and invest in our portfolios of fundamentally strong, well-governed companies.
“How did you go bankrupt? Two ways. Gradually, then suddenly.”
— Ernest Hemingway, The Sun Also Rises (1926)
In Breakpoint, we show that India’s non-housing household debt as a share of income now exceeds that of the United States and China. Close to half of India’s families have taken a personal loan; an estimated 5–10% of retail borrowers are in a debt trap, borrowing anew to service what they already owe; and roughly 10 million Indians lost ₹3 lakh crore trading futures and options (F&O) over FY2022–FY2024.
When we wrote that chapter, we leaned on the RBI’s pre-June-2026 FSRs — the December 2024, June 2025 and December 2025 editions. Those reports already carried the warning signs: household debt rising and, tellingly, increasingly skewed towards consumption rather than asset creation. The December 2024 FSR reproduced SEBI’s finding that 93% of over 11 million individual F&O traders lost money with 75% of them declaring incomes below ₹5 lakh per annum. The Dec ’24 FSR also warned that a sharp rise in loan write-offs by banks “could be partly masking worsening asset quality … and dilution in underwriting standards.” In short, our book and the RBI’s FSRs describe the same Indian household — one from the vantage of the borrower, the other from the vantage of the system that lends to it.
The latest FSR reiterates the warning
The June 2026 FSR keeps ringing the alarm on three issues in particular — while wrapping them in reassuring prose.
- Household debt is at a record high, and it is consumption that is driving it. Household debt reached 5% of GDP by end-September 2025 — the latest reading available in the report, and a fresh high, well above its five-year average of 42.9% (Exhibit 2). The level remains moderate against other emerging markets; it is the mix that worries us. Non-housing retail loans now make up 58.4% of total household borrowing, and — as Exhibit 3 shows — loans taken for consumption account for close to half of everything households owe, comfortably more than borrowing for asset creation. The chart title in the FSR itself says it plainly: household debt is “driven primarily by non-housing retail loans.”
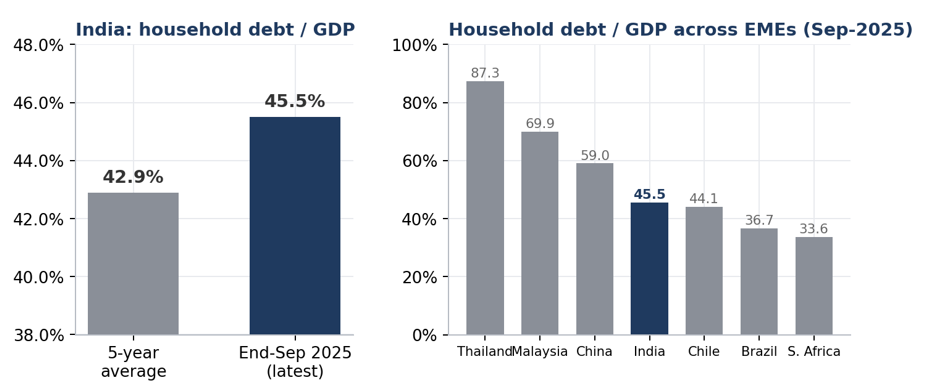
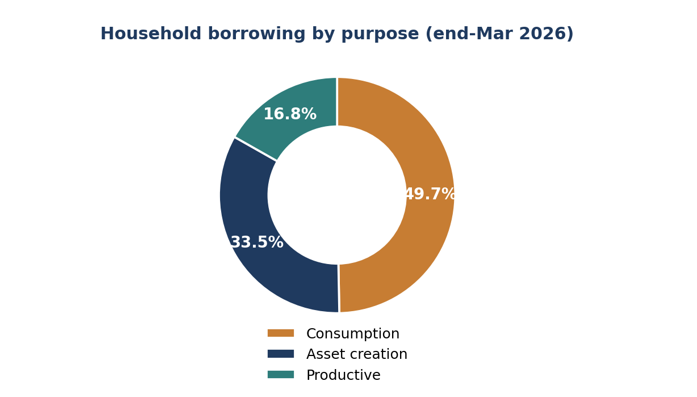
Source: Marcellus Investment Managers, RBI Financial Stability Report, June 2026; household borrowing by purpose, end-March 2026.
2. Early-stage stress is rising in unsecured retail — even as headline bad loans fall. In March 2026 the freshest hard-delinquency bucket, SMA-1 (31–60 days past due), rose, while other buckets and headline NPAs contracted. Fintech-originated small-ticket personal loans show 90–179-day delinquency at 4%, up from 4.1% two years earlier — which the FSR flags as “signalling potential asset quality risks” (Exhibit 4). Unsecured loans now account for over half of all fresh retail slippages.
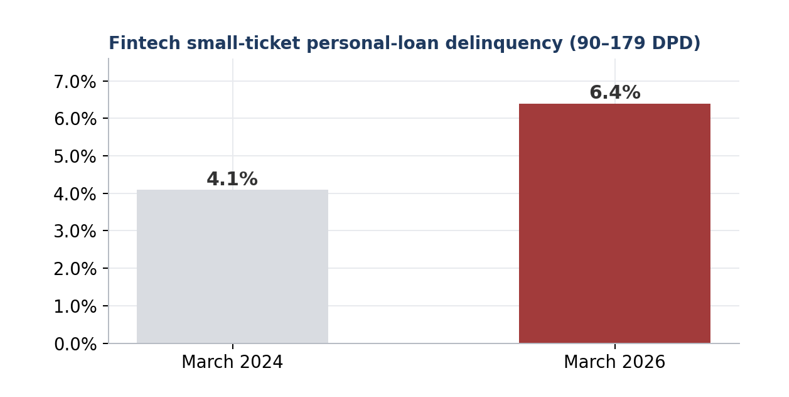
Source: Marcellus Investment Managers, RBI Financial Stability Report, June 2026; fintech-originated small-ticket personal loans, 90–179 days-past-due delinquency.
The clean headline is being flattered by write-offs and refinancing. Private banks wrote off an amount equal to roughly half of their opening stock of bad loans in a single year (Exhibit 5), and the FSR reiterates that write-offs remain “a significant component of NPA reduction.” Alongside this, the riskiest borrowers are quietly rotating debt: the FSR notes that sub-prime borrowers’ personal-loan balances are shrinking as their gold loans grow — the tell-tale sign of stressed households refinancing using gold as collateral (to stay current) rather than genuinely deleveraging. All of this is precisely the data trail we would expect if Breakpoint’s thesis were right.
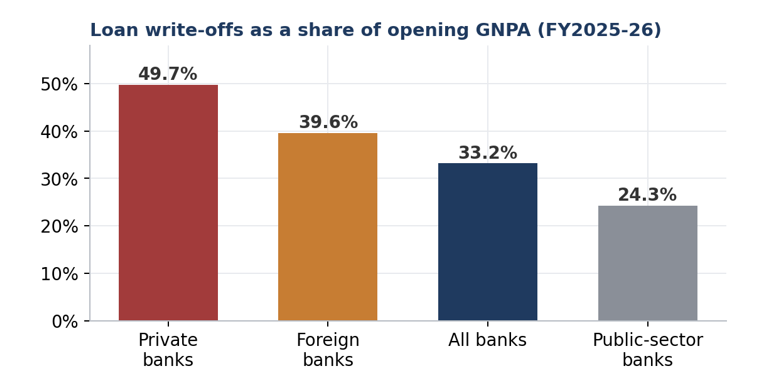
Source: Marcellus Investment Managers, RBI Financial Stability Report, June 2026; loan write-offs during the year as a share of opening gross NPAs, FY2025-26.
So where do Breakpoint and the RBI agree — and where do they part ways?
Both of us see debt rising and, crucially, consumption-led rather than asset-backed. Both locate the stress in the same place: the FSR’s own income-level analysis concentrates impairments in the below-₹10-lakh cohort — the lower end of the very band we define as the middle class. Both cite the same SEBI evidence on F&O losses, with the same young, low-income profile. And both acknowledge the genuine credit-quality scare that ran through microfinance and small-ticket lending, which the FSR shows easing only as lenders pulled back and the borrower base shrank.
The disagreements, when you look closely, are about framing and horizon rather than fact:
- “Relatively low” versus “exploding.” The RBI measures debt against GDP, on which India looks moderate; we measure non-housing debt against income, on which it looks alarming. Both can be true at once — it is a choice of denominator, not a dispute about the numbers. To be specific, we believe that a better way to understand the explosion of household debt in India is to remove mortgages (which have a real productive asset and relatively low interest rates associated with them) and then compare India with other large economies. As shown in the chart below, the explosion in the Indian middle-class’s post-Covid non-mortgage borrowing is a stunning spectacle.
Exhibit 6: Indians today are one of the most indebted people in the world (excluding mortgages)
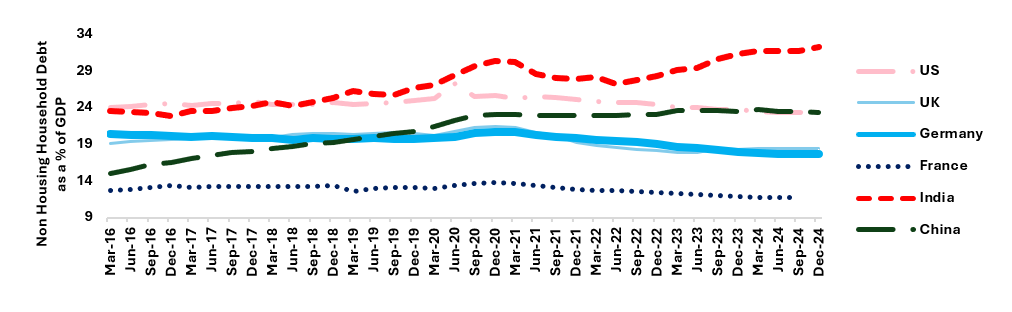
Source: Marcellus Investment Managers, CEIC [several sources] – collated by MOFSL
- “Improving” versus “worsening.” The FSR sees default rates falling and reads borrower quality as improving; we see a structural squeeze due to the lack of white collar jobs, soaring cost of living and runaway aspirations fuelled by social media.
- “Supportive” versus “jammed.” The RBI treats domestic demand as a pillar of growth; we argue the consumption engine is stalling under debt-servicing.
What does this mean for how you invest?
Whether you take the RBI’s half-full view or Breakpoint’s half-empty one, the shared picture is of a stretched Indian consumer with weakening spending power. The Indian stockmarket’ s history is unusually clear about what wins in that environment.
As Exhibit 7 shows, the Nifty Quality 30 index has outperformed the Nifty Value 20 index precisely during periods of weak Nifty50 earnings growth — the policy paralysis years of UPA II, the DHFL and IL&FS blow-ups, the pre-Covid slowdown, the Covid onset itself. Quality companies tend to outperform in Sankat kaal. If the FSR’s and Breakpoint’s alarm bells are right, the outperformance of Quality which began early in 2026 is likely to continue for a few years.
Exhibit 7: Quality outperforms in India when the economy slows down
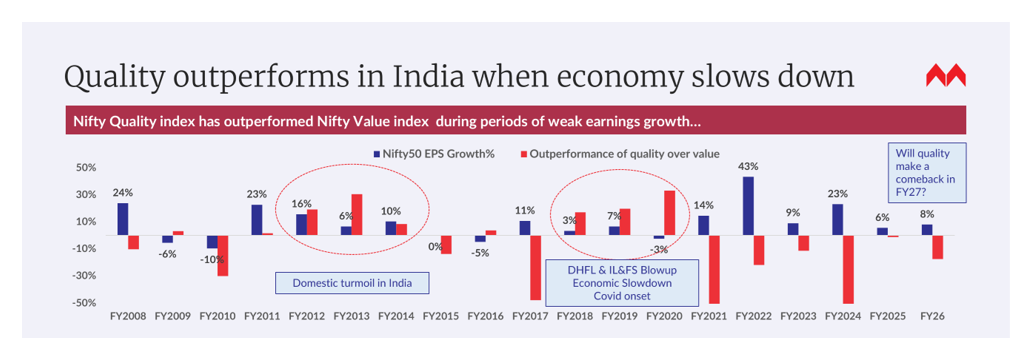
Source: Marcellus Investment Managers, NSE, NSDL. Quality outperformance refers to the Nifty Quality 30 index’s outperformance versus the Nifty Value 20 index’s returns.
Investment implications
In our Consistent Compounders Portfolio (CCP), we invest 19 Indian companies with clean accounts, strong balance sheets and well-managed franchises. Most of these companies either provide essential goods & services to Indian households (e.g. tea, salt, hospital care, medical diagnostics) or to citizens in other countries (medicines, hospital care). After a blockbuster in the five years ending Diwali 2021, this portfolio struggled from 2022-25. However, with the Indian economy entering Sankat kaal, CCP is outperforming again in 2026. CCP is available to both Indians and NRIs as PMS product with a minimum investment of Rs 50 lakh.
Consistent Compounders Portfolio — CCP PMS vs Nifty50 TRI, annualised returns by phase
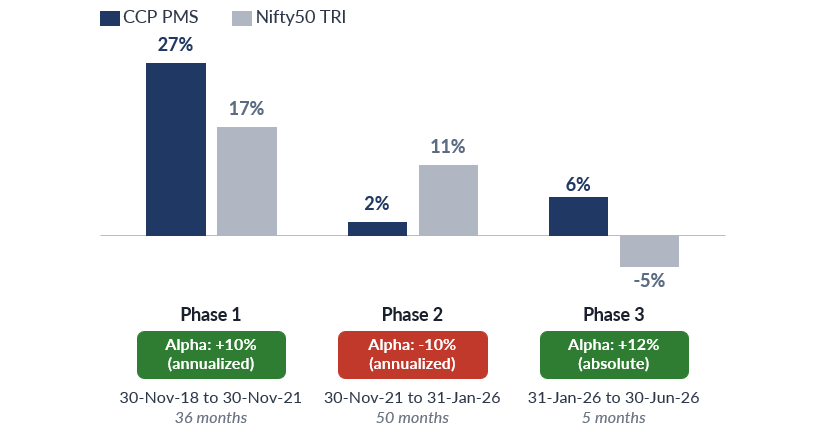
Consistent Compounders Portfolio — CCP performance vs Nifty50 TRI, by period (Dec 2018 till June 2026)
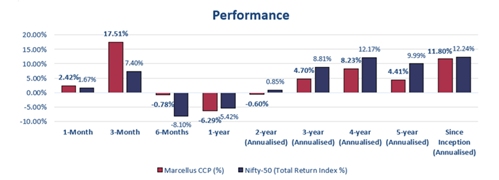
Note: Performance data for the domestic portfolio is shown net of fixed fees and expenses, and net of performance fees, charged till the last quarter end for client accounts. Short-period returns are absolute; longer-period returns are annualized. The calculation or presentation of performance results has NOT been approved or reviewed by the SEC, SEBI or any other regulatory authority. Past performance is not indicative of future results.
Marcellus also provides its clients the option to be directly onboarded, without the intervention or intermediation of any person engaged in distribution services (including distributors/referral partners).
*For relative performance of particular Investment Approach to other Portfolio Managers within the selected strategy, please refer https://www.apmiindia.org/apmi/welcomeiaperformance.htm?action=PMSmenu, Under PMS Provider Name please select Marcellus Investment Managers Private Limited and select your Investment Approach Name for viewing the stated disclosure
If you would like to invest with us, please scan the QR code below.

The tool designed to help user explore products and Asset allocation; shall not be considered as Investment advice.
The above material is neither investment research, nor investment advice. Marcellus does not seek payment for or business from this material/email in any shape or form. Marcellus Investment Managers Private Limited (“Marcellus”) is regulated by the Securities and Exchange Board of India (“SEBI”) as a provider of Portfolio Management Services. Marcellus is also a US Securities & Exchange Commission (“US SEC”) registered Investment Advisor. No content of this publication including the performance related information is verified by SEBI or US SEC. If any recipient or reader of this material is based outside India and USA, please note that Marcellus may not be regulated in such jurisdiction and this material is not a solicitation to use Marcellus’s services. This communication is confidential and privileged and is directed to and for the use of the addressee only. The recipient of this material is urged to consult their own legal and tax consultants/advisors before making any investments. The recipient, if not the addressee, should not use this material if erroneously received, and access and use of this material in any manner by anyone other than the addressee is unauthorized. If you are not the intended recipient, please notify the sender by return email and immediately destroy all copies of this message and any attachments and delete it from your computer system, permanently. No liability whatsoever is assumed by Marcellus as a result of the recipient or any other person relying upon the opinion unless otherwise agreed in writing. The recipient acknowledges that Marcellus may be unable to exercise control or ensure or guarantee the integrity of the text of the material/email message and the text is not warranted as to its completeness and accuracy. The material, names and branding of the investment style do not provide any impression or a claim that these products/strategies achieve the respective objectives. Further, past performance is not indicative of future results. Marcellus and/or its associates, the authors of this material (including their relatives) may have financial interest by way of investments in the companies covered in this material. Marcellus does not receive compensation from the companies for their coverage in this material. Marcellus does not provide any market making service to any company covered in this material. In the past 12 months, Marcellus and its associates have never i) managed or co-managed any public offering of securities; ii) have not offered investment banking or merchant banking or brokerage services; or iii) have received any compensation or other benefits from the company or third party in connection with this coverage. Authors of this material have never served the companies in a capacity of a director, officer or an employee. All recipients of this material must before dealing and or transacting in any of the products referred to in this material must make their own investigation, seek appropriate professional advice and carefully read the Private Placement Memorandum/Disclosure Document, Form ADV, Form CRS and any other documents or disclosures provided to them by Marcellus, as applicable.
This material may contain confidential or proprietary information and user shall take prior written consent from Marcellus before any reproduction in any form.