OVERVIEW
POPULAR ARTICLES
Accustomed to seeing current account deficits, India will now have to get used to capital account deficits as well, as Indian promoters rush to invest abroad. This unique twin deficit problem will not only create sustained pressure on the INR, but it will also expose Indian retail investors, who ploughed over $100bn in the post-Covid stockmarket rally, to pressure on their household balance sheets. To protect your wealth in Sankat Kaal, you can invest in our Global funds in GIFT City with an investment of $5K OR invest in our flagship domestic product, Consistent Compounders.
Exhibit 1: FPI net equity outflows in Jan-May 2026 have already surpassed that of CY2025
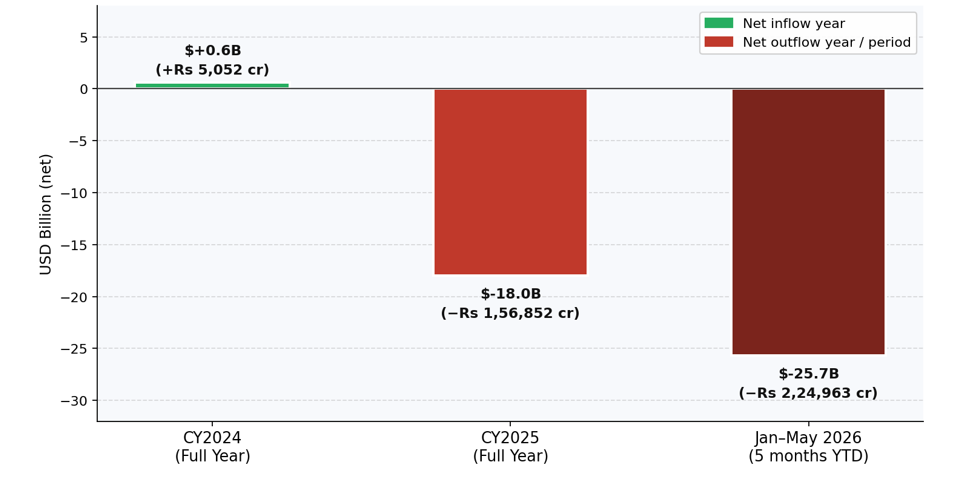
Source: NSDL depository data; Business Standard (25th Dec 2024), Outlook Money/NSDL (25th Dec 2025), Business Standard/PTI/NSDL (1st May 2026), and finnovate.in/NSDL sectoral data (Jun 2026)
FII exits is the canary in the coalmine
FII outflows have hit record levels of $18 billion in CY2025, surpassed by $26 billion in just Jan-May 2026. This is NOT a transient correction — it is a sustained, structural repositioning and as explained below, it has significant implications for your & my money.
Note: FII stands for Foreign Institutional Investment i.e. investment in financial assets like shares and bonds. FDI stands for Foreign Direct Investment i.e. investment in factories & actual physical assets.
1. Big ticket outward flows of FDI from India into America. Donald Trump is publicly squeezing India Inc and coaxing desi promoters into investing vast sums into USA. POTUS’ pressure aside, the low cost of industrial land & working capital in America plus the opportunity to avoid tariffs is persuading dozens of smaller Indian firms to set up large factories in America. It seems likely that India’s net FDI figure will be negative or close to zero for several years to come. As explained below, this has major implications for the Indian economy and its currency.
2. India seems likely to run twin deficits (both on current & capital account) implying sustained pressure on the INR. For several decades now India has run a current account deficit due to our need for imported gadgets & machinery and our love for overseas holidays & foreign education. Historically, this was offset by a capital account surplus thus creating a manageable situation in terms of INR depreciation (which used to be around 40% per decade ). Now, the new normal is likely to be that alongside the current account deficit, India will also have a capital account deficit i.e., FII selling will continue until stockmarket valuations slide further and FDI will also be negative or near zero (see previous bullet). A current plus capital account deficit implies sustained pressure on the INR which could end up giving up half of its value each decade. This has obvious adverse implications for the value of your wealth in US$.
3. Indian retail investors likely to see pressure on their balance sheets as their wealth is transferred to FIIs via the stockmarket. Domestic institutions (DIIs) have absorbed ~90% of the FII selling thus preventing a market crash in India. But this is creating a novel risk of wealth transfer from domestic retail to exiting foreign institutions. The post-Covid stockmarket rally in India was very unusual as it saw a long & sustained rally in companies with dodgy accounts. Indian investors poured over $80 billion into this rally (see chart below). FIIs saw Indian companies trading at stratospheric valuations, encashed their desi investments and sent this $100bn back home to New York, London, Singapore and Hong Kong. This very material transfer of wealth from Indians to foreigners will now start biting as local investors stare at their stagnant portfolios in a country where net household savings are close to multi-decade lows (5.1% of GDP in FY23), household debt is at 41% of GDP and, critically, non-housing consumer debt now rivals rich-world levels at sub-$3,000 per capita income.
Exhibit 2: FPI and DII ownership pattern flipped in 2025 (for NSE listed companies)
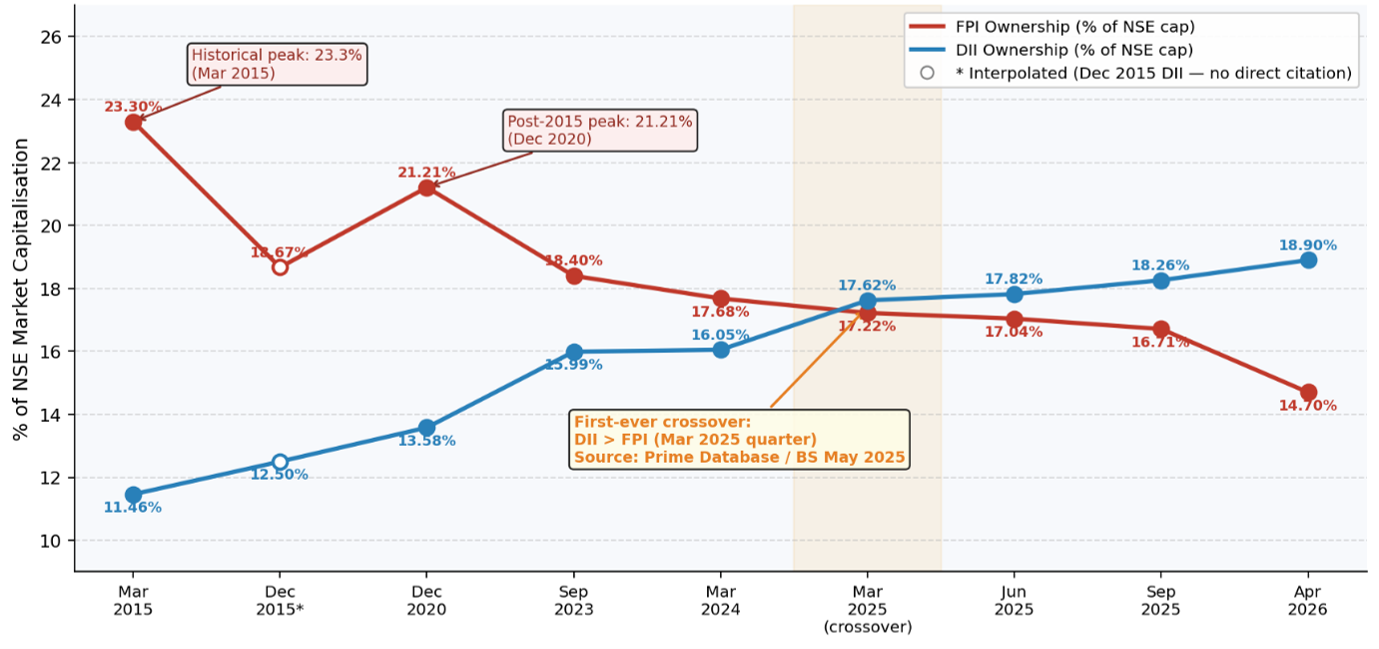
Source: Prime Database (primeinfobase.com) quarterly reports, reported by Business Standard and JM Financial; *- DII number interpolated as no public document available for this period.
Implications for Indian Investors
We are in Sankat Kaal and you & I need to protect the value of our hard earned wealth. I believe that there are two ways of doing so in the coming years: 1) Invest in $ denominated assets globally in a tax-efficient & cost-efficient way through Marcellus’ GIFT City funds; and 2) Invest in Marcellus’ portfolios of quality Indian stocks which are seeing solid profit growth quarter-after-quarter year-after-year. Both methods are explained below and if you reply to this email, I will be happy to share more information on these methods.
Through its offices in GIFT City, Gujarat, Marcellus offers multiple funds through which investors can acess America and the other developed economies. Ticket sizes for these investments start from US$5K (Rs 4.5 lakhs). The track record of our flagship global product – the Global Compounders Portfolio – is shown below.
To know more about this small ticket global equities fund, please reply to this email or visit our website using the link: Marcellus Global Equities Fund.
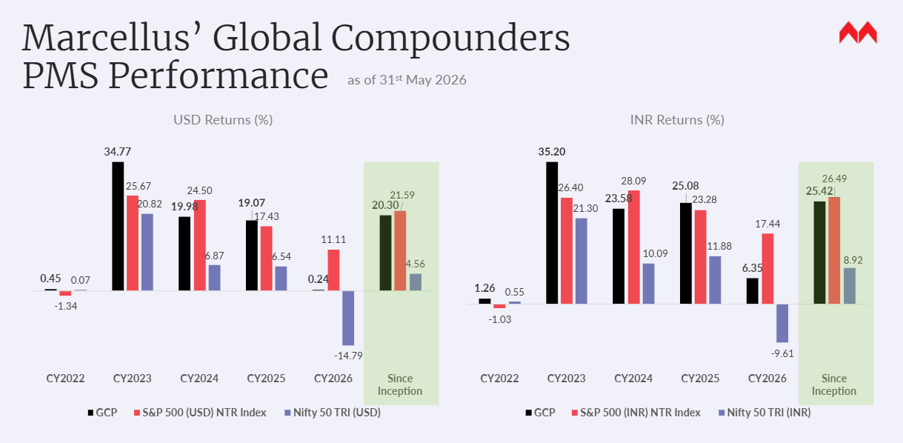
Note: Marcellus performance data is shown gross of taxes and net of fees & expenses charged till end of last month on client account. Performance fees are charged annually in December. Returns more than 1-year are annualized. Marcellus’ GCP USD returns are converted into INR using USD: INR exchange rate from RBI – Link for the reference.
Note: * Since Inception performance calculated from 31st Oct 2022. The inception date is 31st Oct 2022, being the next business day after the account got funded on 28th October 2022. S&P 500 net total return is calculated by considering both capital appreciation and dividend payouts. The calculation or presentation of performance results in this publication has NOT been approved or reviewed by the IFSCA or US SEC. Performance is the combined performance of RI and NRI strategies. S&P 500 NTR is the benchmark for the strategy. Nifty 50 is provided for reference to illustrate the relative performance of the US and Indian markets. Past performance pertains to Marcellus’ GCP PMS strategy, not to this IFSC Retail Scheme and is not indicative of future results.
Marcellus GCP PMS is offered by Marcellus Investment Managers GIFT Branch in a segregated managed accounts format.
The Consistent Compounders PMS portfolio (CCP) is Marcellus’ flagship domestic offering with over Rs 1800 crores invested in this strategy. As you might know, we avoid naughty companies in sectors with high exposure to regulated or government-related activities. After four difficult years, CCP is beating the benchmark again (see chart below) largely because the investee companies are able to sustain profit growth through, both, good years an Sankat Kaal.
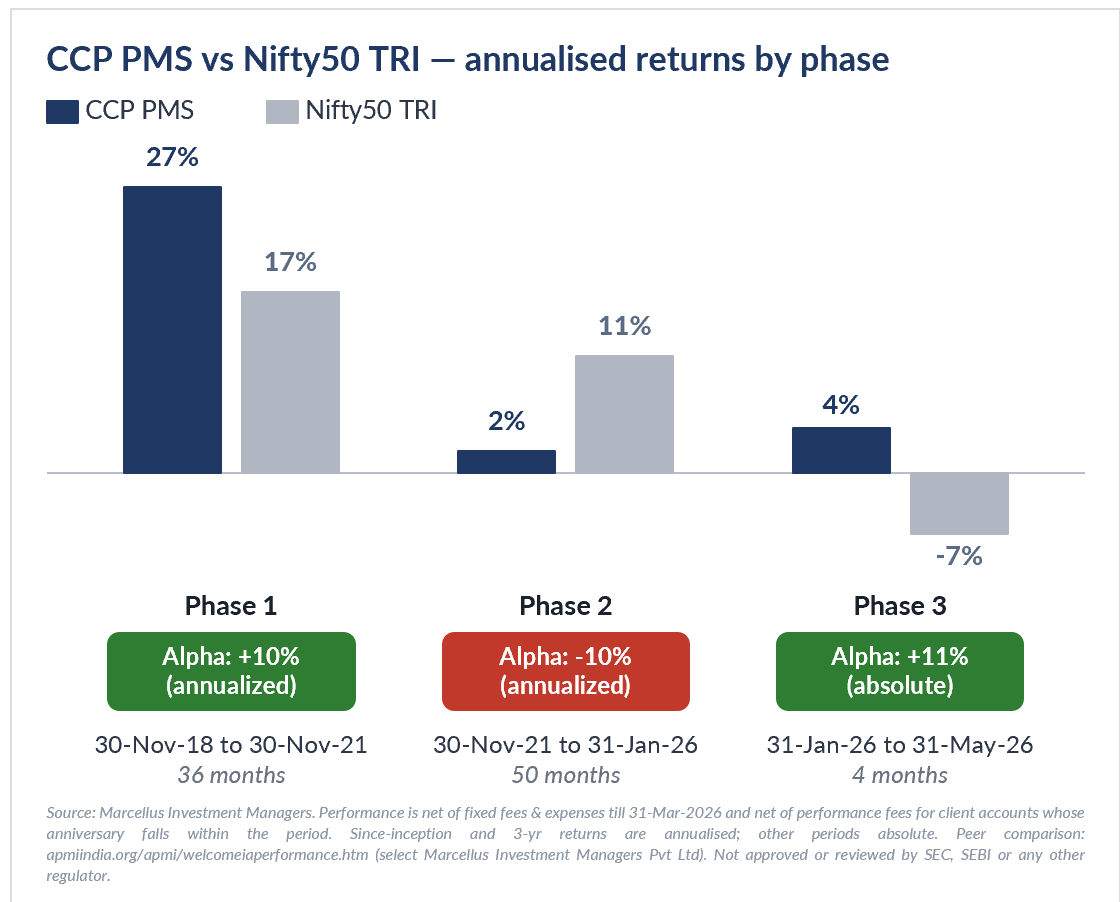
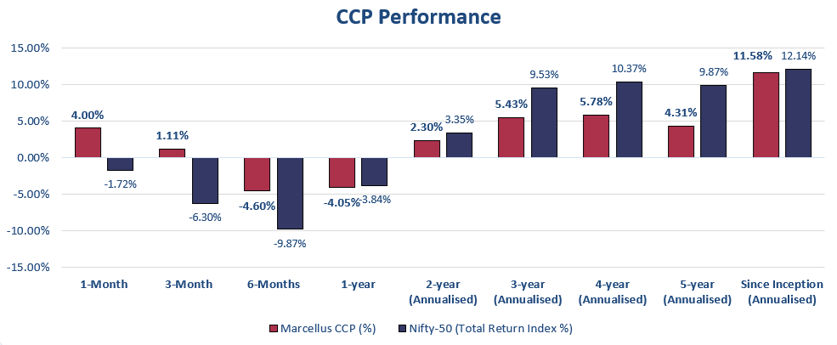
Source: Marcellus Investment Managers; Performance Data shown is net of fixed fees and expenses charged till the last quarter end and is net of Performance fees charged for client accounts, whose account anniversary / performance calculation date falls upto the last date of this performance period; 1 month, 3 months & 6 months returns are absolute; other time period returns are annualized. The calculation or presentation of performance results in this publication has NOT been approved or reviewed by the SEC, SEBI or any other regulatory authority.
*For relative performance of particular Investment Approach to other Portfolio Managers within the selected strategy, please refer https://www.apmiindia.org/apmi/welcomeiaperformance.htm?action=PMSmenu, Under PMS Provider Name please select Marcellus Investment Managers Private Limited and select your Investment Approach Name for viewing the stated disclosure.
If you would like to invest with us in Consistent Compounders PMS or explore varied offerings, please scan the QR code underneath.

Thanks
Saurabh Mukherjea
Click here for details about our regulatory registration and licensing information.
Disclaimer:
Copyright © 2026 Marcellus Investment Managers Pvt Ltd, all rights reserved Note: the above material is neither investment research, nor investment advice. Marcellus does not seek payment for or business from this material/email in any shape or form. Marcellus Investment Managers Private Limited (“Marcellus”) is regulated by the Securities and Exchange Board of India (“SEBI”) as a provider of Portfolio Management Services. Marcellus is also a US Securities & Exchange Commission (“US SEC”) registered Investment Advisor. Marcellus Investment Managers Private Limited (“Marcellus”) is regulated by the International Financial Services Centres Authority (IFSCA) as a Fund Management Entity No content of this publication including the performance related information is verified by SEBI or US SEC. If any recipient or reader of this material is based outside India and USA, please note that Marcellus may not be regulated in such jurisdiction and this material is not a solicitation to use Marcellus’s services. All recipients of this material must before dealing and or transacting in any of the products/services referred to in this material must make their own investigation, seek appropriate professional advice. This communication is confidential and privileged and is directed to and for the use of the addressee only. The recipient, if not the addressee, should not use this material if erroneously received, and access and use of this material in any manner by anyone other than the addressee is unauthorized. If you are not the intended recipient, please notify the sender by return email and immediately destroy all copies of this message and any attachments and delete it from your computer system, permanently. No liability whatsoever is assumed by Marcellus as a result of the recipient or any other person relying upon the opinion unless otherwise agreed in writing. The recipient acknowledges that Marcellus may be unable to exercise control or ensure or guarantee the integrity of the text of the material/email message and the text is not warranted as to its completeness and accuracy. The material, names and branding of the investment style do not provide any impression or a claim that these products/strategies achieve the respective objectives. Further, past performance is not indicative of future results. Marcellus and/or its associates, the authors of this material (including their relatives) may have financial interest by way of investments in the companies covered in this material. Marcellus does not receive compensation from the companies for their coverage in this material. Marcellus does not provide any market making service to any company covered in this material. In the past 12 months, Marcellus and its associates have never i) managed or co-managed any public offering of securities; ii) have not offered investment banking or merchant banking or brokerage services; or iii) have received any compensation or other benefits from the company or third party in connection with this coverage. Authors of this material have never served the companies in a capacity of a director, officer or an employee. This material may contain confidential or proprietary information and user shall take prior written consent from Marcellus before any reproduction in any form.