OVERVIEW
POPULAR ARTICLES

Investors consistently earn less than the funds they invest in — NOT because fund managers underperform, but because investors put more money in after strong runs and pull back after weak ones, a behaviour directly visible in the data across most equity categories. This “timing penalty”, which our analysis suggests would be approximately 1% point per year on average, is the gap between what a fund returned and what its investors actually earned . The fix requires no market insight — only process: systematic investment plans (SIPs) remove the repeated timing decision that causes the problem, while a disciplined asset allocation with regular rebalancing may help counter return-chasing, buying what has lagged and trimming what has run.
Most investors check a mutual fund’s past returns before putting money in. A fund that delivered 22% annualised over three years feels reassuring. But here is a question worth asking: did the investors in that fund actually earn 22%? The answer often is “No, they did not”.
A fund’s published return assumes that the investment held throughout the entire period. The investor’s actual return adjusts for the timing of when money flowed in and out. When investors put more in after a good run and pull back after a bad one, the two numbers diverge — consistently against the investor.
A concrete illustration: suppose a fund falls 15% in year one and then rallies 40% in year two. Its two-year annualised return is about 9%. Now suppose most investors, unsettled by the first-year loss, reduce their holding and only reinvest at the start of year two. Those investors earn 40% on a smaller base, having sold near the low. The fund’s reported 9% tells them nothing useful about what their account actually earned. The difference is not caused by the fund manager doing anything wrong — it is caused entirely by when the investor chose to act.
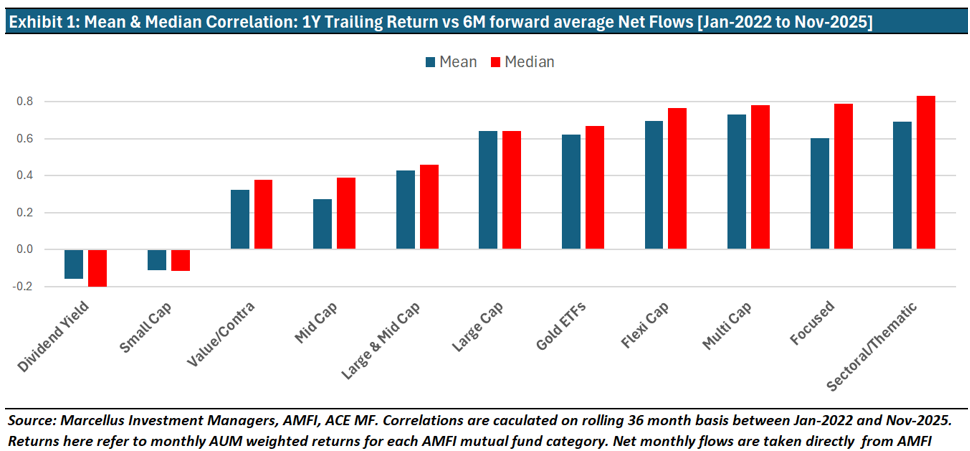
In exhibit 1, we measure this tendency directly by calculating the rolling correlation between the category’s trailing one-year AUM-weighted return and the net inflows received over the following six months, from January 2022 to May 2026, for ten active equity categories and Gold ETFs. As you would expect this correlation is relatively high for most active equity categories & for gold i.e. the higher AUM-weighted returns in the trailing 12 months, were associated with the higher the net inflows received over the next six months.
If you think about it, active equity investing and gold are the categories with the highest return potential and highest meaningful return cyclicality — exactly the conditions may make recent performance a powerful, if unreliable, guide to investor behaviour. A positive number in Exhibit 1 means that investors tended to put more money into that category after it had already done well.
Most categories confirm to this pattern i.e. the money tends to flow in after a period of punchy returns. Focused funds (0.79 median correlation), Multi Cap (0.78), Flexi Cap (0.77), Large Cap (0.64), Sectoral/Thematic (0.83), and Gold ETFs (0.67) all show strong positive readings. Midcap (0.39) and Large & Mid Cap funds (0.46) follow similarly. Investors and advisors alike appears struggle to deal with “Recency Bias” – a cognitive error where people overemphasize the importance of recent events or the latest information they possess.
The good news however is that two categories stand apart. Dividend Yield shows a mild negative median correlation (−0.12), consistent with its investor base being income-oriented rather than performance-chasing. Small Cap is the sharper outlier at −0.12: investors here have actually scaled back after strong runs. This is good to see especially in a developing equity market like India, but it begs the question, “How did this happen?”.
A possible explanation for the refreshingly rational response of Small Cap mutual fund investors could be SEBI’s February 2024 circular directing AMCs to conduct monthly stress tests on small cap portfolios and publicly disclose the estimated number of days required to liquidate 25% and 50% of their holdings. Shortly after, some of the largest funds in Small Cap fund category, namely, SBI Small Cap Fund, Nippon India Small Cap Fund, among others, voluntarily moved to SIP-only mode, restricting fresh lump sum investments. This intervention may have moderated the flow-chasing behaviour visible in other categories and is directly visible in the negative correlation reading for small caps post-2024.
Sectoral and thematic funds make the timing dynamic most visible – with a very high correlation between recent returns and subsequent asset inflows. Exhibit 2 shows the new scheme launches each month against the Nifty 500’s trailing one-year return. The relationship is notable. The new fund launches in this category cluster around months of elevated trailing returns. Twelve new sectoral or thematic schemes were launched in a single month in December 2024, coinciding with double-digit trailing broad-market returns. When trailing returns were flat or negative, launches slowed sharply. The supply of new thematic products expands precisely when investor enthusiasm — and potentially entry valuations — are highest.
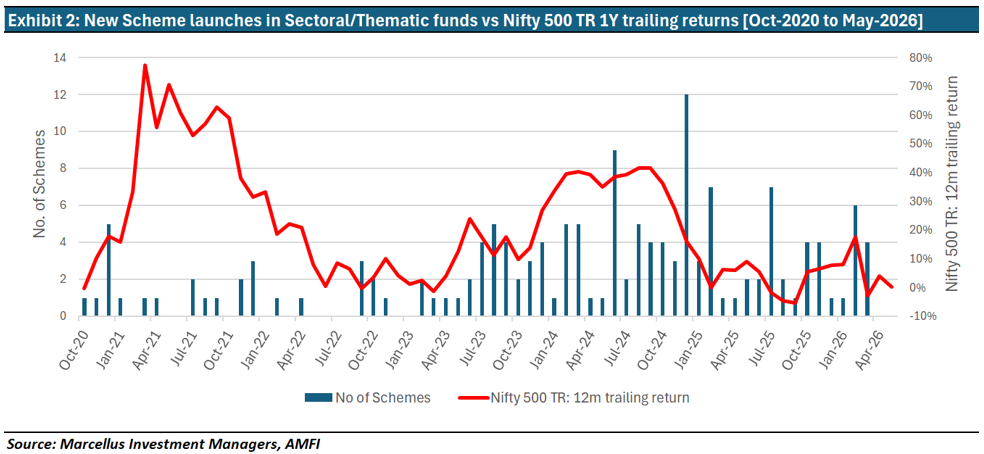
Exhibit 3 quantifies the annualised returns actually earned by an investor investing in the middle of the month within each category (which is the flow or money weighted return as shown in column A) versus an investor investing at the start of the month in proportion of each funds AUM contribution to overall category AUM (time weighted rate of return shown in column B). The annual return between the flow and time weighted returns difference (shown in the last column in exhibit 3) averages around 1% per year. This may be termed as “Timing Tax” i.e. the tax that investors pay for letting recent returns sway their judgement of where & when to invest.
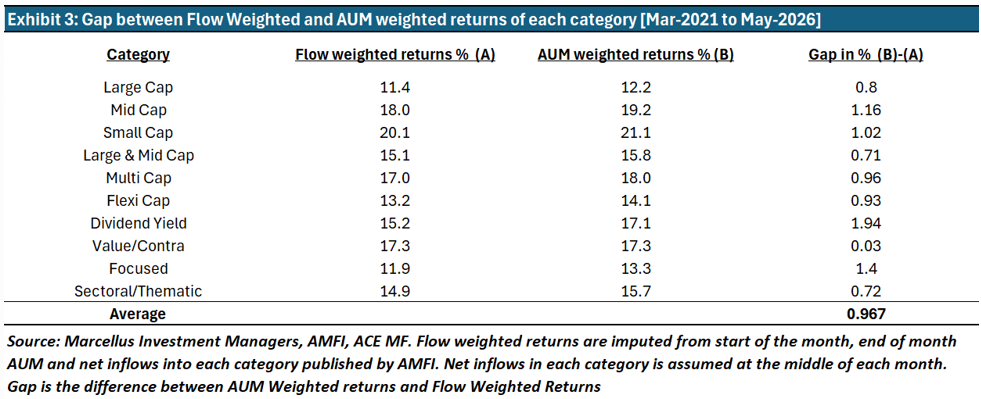
Notice in the table above that even Small Cap and Dividend Yield — the only two categories where we saw mature behaviour from investors in Exhibit 1 — carry a timing tax. The apparent disconnect arises because the rolling correlation tests a specific mechanism: does return-chasing drive flows? For these two categories the answer is largely no, but for different reasons. For Small Cap, the SEBI February 2024 circular restricting fresh lump-sum investments structurally prevented inflows during a period of strong trailing returns — a regulatory intervention, not investor discipline. For Dividend Yield, the low correlation throughout the period suggests flows were not being driven by trailing returns.
Regardless of the reason for the timing mismatch, the Gap % in Exhibit 3 measures the outcome: did investors earn less than the category returned? The answer is yes — by 1.94pp annually for Dividend Yield, because the category was under-owned during its best years (the 2021–22 value cycle); and by 1.02pp for Small Cap, where the heaviest inflows preceded the SEBI restrictions and coincided with peak valuations, potentially leaving some investors with their highest exposure near the top and unable to average down thereafter. Even excluding these two categories, the average timing tax across the remaining eight equity categories is ~84 bps per year.
How to avoid paying the “Timing Tax”?
None of this argues against equity mutual funds. The categories studied have delivered strong returns over the five-year window May 2021 to May 2026: Gold ETFs at 26% and Multi Cap at 18.9% annualised — all on an AUM-weighted basis, which reflects where investor money was actually sitting. The argument is narrower: a category delivering strong return is useful only if the investor can benefit from the same. Investing heavily after a recent rally and redeeming after a drawdown is the surest way to ensure they do not.
Investors may be able to reduce the “Timing Tax” with couple of simple approaches:
· For volatile equity categories and Gold, investing through systematic investment plans (SIPs) removes the cognitive burden of repeated timing decisions that frequently result in timing errors — buying after rallies, pausing after falls. While SIPs may or may not generate better returns than lump sum investments, their case rests entirely on behavioral grounds: most investors may find it difficult to resist the pull of recent performance, so SIPs deliver improve actual outcomes by automating the decision and keeping them invested.
· Have an asset allocation plan and regularly rebalancing back to decided asset allocation. Rebalancing to fixed weights buys into funds/asset classes which have lagged while selling those funds/asset classes which have done relatively well recently. This is opposite of the return chasing behavior which can contribute to the “timing tax”. Our blog ( https://marcellus.in/blogs/are-equities-really-the-best-way-to-compound-wealth-in-the-long-run/) and podcast (https://youtu.be/oUiP7aRfJy4 ) on a diversified Multi-Asset Portfolio (MAP) will help you understand the potential benefits of regularly rebalancing across diversified asset classes – you can earn equity-style returns with structurally lower volatility compared to a pure equity index like the Nifty 50 i.e. time may work more favorably, rather than imposing a tax on you.
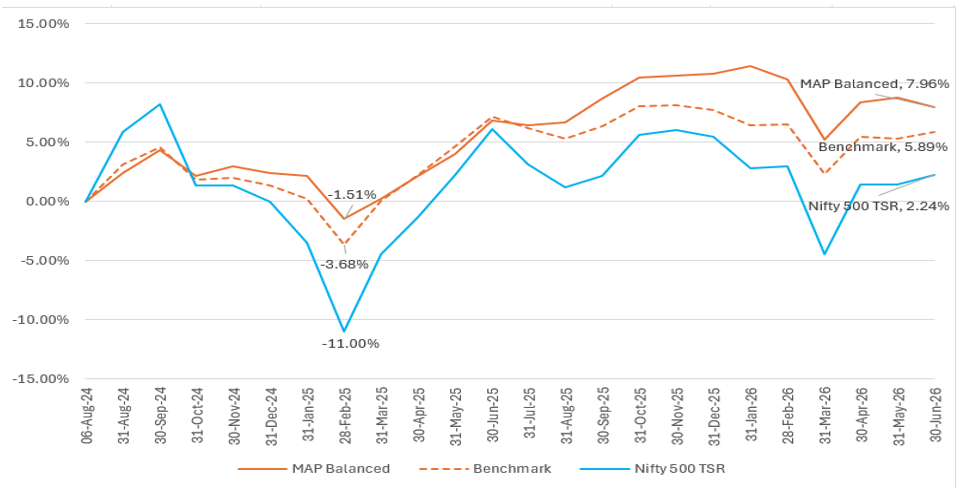
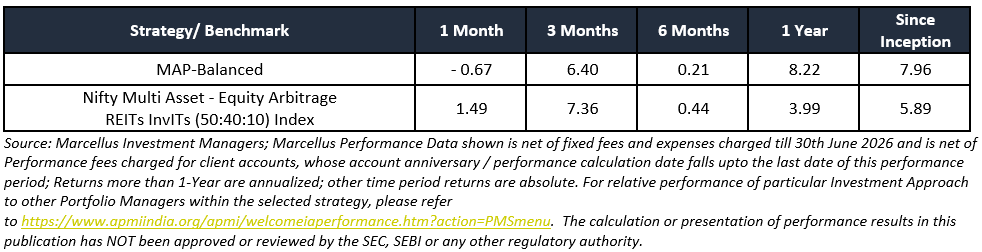
Marcellus’ ‘MAP-Balanced’ which has generated 7.96% returns since inception in Aug-24 to June-26 net of all fees and costs against 2.24% of Nifty 500 TSR (see the chart below).
If you would like to explore this free service (with no-strings attached) then either scan the QR code below OR visit connect.marcellus.in.
Please note that this is neither a financial plan, nor an investment advice, this tool provides general asset allocation guidnace only.

Thanks,
Saurabh Mukherjea
Click here for details about our regulatory registration and licensing information
Disclaimer:
The above material is neither investment research, nor investment advice. Marcellus does not seek payment for or business from this material/email in any shape or form. Marcellus Investment Managers Private Limited (“Marcellus”) is regulated by the Securities and Exchange Board of India (“SEBI”) as a provider of Portfolio Management Services. Marcellus is also a US Securities & Exchange Commission (“US SEC”) registered Investment Advisor. References to financial planning relate only to asset allocation under Marcellus’ PMS license. No content of this publication including the performance related information is verified by SEBI or US SEC. If any recipient or reader of this material is based outside India and USA, please note that Marcellus may not be regulated in such jurisdiction and this material is not a solicitation to use Marcellus’s services. This communication is confidential and privileged and is directed to and for the use of the addressee only. The recipient of this material is urged to consult their own legal and tax consultants/advisors before making any investments. The recipient, if not the addressee, should not use this material if erroneously received, and access and use of this material in any manner by anyone other than the addressee is unauthorized. If you are not the intended recipient, please notify the sender by return email and immediately destroy all copies of this message and any attachments and delete it from your computer system, permanently. No liability whatsoever is assumed by Marcellus as a result of the recipient or any other person relying upon the opinion unless otherwise agreed in writing. The recipient acknowledges that Marcellus may be unable to exercise control or ensure or guarantee the integrity of the text of the material/email message and the text is not warranted as to its completeness and accuracy. The material, names and branding of the investment style do not provide any impression or a claim that these products/strategies achieve the respective objectives. Further, past performance is not indicative of future results. Marcellus and/or its associates, the authors of this material (including their relatives) may have financial interest by way of investments in the companies covered in this material. Marcellus does not receive compensation from the companies for their coverage in this material. Marcellus does not provide any market making service to any company covered in this material. In the past 12 months, Marcellus and its associates have never i) managed or co-managed any public offering of securities; ii) have not offered investment banking or merchant banking or brokerage services; or iii) have received any compensation or other benefits from the company or third party in connection with this coverage. Authors of this material have never served the companies in a capacity of a director, officer or an employee. All recipients of this material must before dealing and or transacting in any of the products referred to in this material must make their own investigation, seek appropriate professional advice and carefully read the Private Placement Memorandum/Disclosure Document, Form ADV, Form CRS and any other documents or disclosures provided to them by Marcellus, as applicable.
This material may contain confidential or proprietary information and user shall take prior written consent from Marcellus before any reproduction in any form