OVERVIEW
POPULAR ARTICLES

Between January-June 2026, South Korean retail investors borrowed their way from US$19bn to a record US$27bn of margin credit to chase an AI-driven stocks. When the KOSPI broke, 1.2 million leveraged accounts were margin-called and roughly 360,000 were liquidated. India’s equivalent instrument, the Margin Trading Facility, has grown 6x in three years to ₹1.43 lakh crore (US$15 bn). On aggregate numbers India looks safer than Korea. We think that comfort is misplaced. SEBI’s derivatives clampdown has converted retail’s bounded losses into unbounded ones; Koreans levered into a rising market whereas Indian are levering into a drawdown; and India’s dangerous concentration sits with the lenders, not the stocks, which means diversifying across Indian equities does not protect you. The takeaway is not to run away from the Indian market but to diversify by holding a meaningful share of savings in dollar assets. We can help you do that — respond to this email or reach us via invest.marcellus.in.
Note on currency: US$ equivalents shown in brackets throughout are converted at closing spot rates on 5 August 2026 of ₹95.16 and ₩1,425.51 per US dollar. Because the figures cited span January 2026 to July 2026, they are not converted at the rate prevailing on each date, and are indicative of scale rather than exact contemporaneous value.
Exhibit 1: Korea’s retail margin book — six months of accumulation, five weeks of unwind
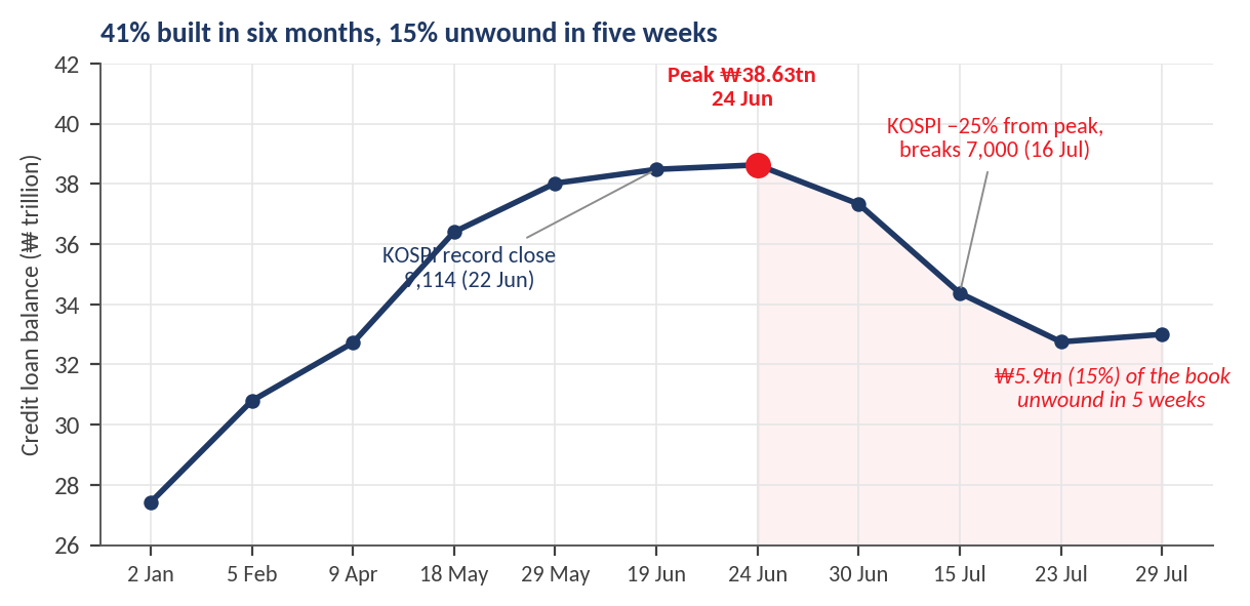
Source: Marcellus Investment Managers; Korea Financial Investment Association (KOFIA) credit loan balance, as reported by Seoul Economic Daily, Korea Herald and Reuters on the dates shown. Points are individual reported observations rather than a continuous daily series; the connecting line is indicative between observations. KOSPI index levels per Korea Exchange as reported.
“There are decades where nothing happens; and there are weeks where decades happen.”
— attributed to Vladimir Lenin
The Korean retail investor meltdown
Korea entered 2026 with the strongest fundamental story in Asia. Global demand for memory chips was accelerating so fast that Korean exports rose 71% year-on-year in June 2026, the strongest annual pace in almost half a century. The economy posted its best quarter in nearly six years and the government raised its 2026 growth forecast to 3% from 2%. The KOSPI, which had spent years as the developed world’s cheapest major market, went on a tear posted a record close of 9,114 on 22 June.
None of that is a bubble. What made it one was how the last leg was financed. Retail investors did not simply buy the rally — they borrowed to buy it, through four channels stacked on top of one another:
- Credit loans from brokerages (margin loan), the direct analogue of India’s MTF, which rose from US$19 bn on 2 January to US$27bn on 24 June — up 41% in under six months.
- Loans secured against already-deposited securities, taken by investors who had exhausted their credit limits, which swelled from in 2026 to US$18 bn.
- Bank credit lines and overdrafts. Korean household borrowing jumped from US$1.5bn to US$5 bn in May 2026 alone with much of the growth coming from personal credit lines and overdraft accounts.
- Single-stock 2x leveraged ETFs on Samsung Electronics and SK Hynix, introduced in May 2026 and sold out on listing.
Taken together, retail borrowing to buy Korean shares averaged US$43 bn a day in the second quarter of 2026 — an all-time record. Korean brokerages earned roughly US$1 bn of interest income on it in that single quarter, up 9% sequentially.
One further feature of what happened in Korea in 2026 deserves emphasis, because it recurs in the Indian section below. Yuanta Securities summarised Korea’s first half as record half-year returns, extreme concentration in semiconductors and IT hardware, record foreign net selling and unprecedented volatility. Retail was not levering up alongside institutional money. It was levering up to absorb what foreign investors were distributing.
The unwind was mechanical and it was fast.
Exhibit 2: The chronology of the break
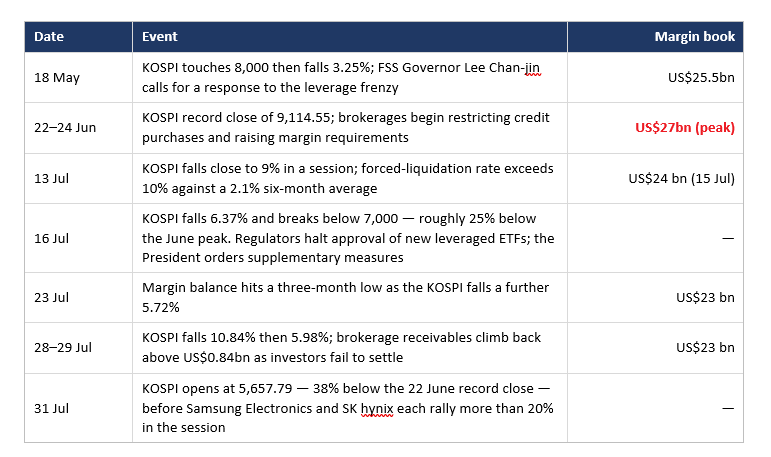
Source: Marcellus Investment Managers; KOFIA and Korea Exchange data as reported by Seoul Economic Daily, Korea Herald, Reuters and Eastern Herald, June–July 2026.
As per Goldman Sachs, more than 1.2 million leveraged retail accounts hit margin-call thresholds and roughly 320,000 to 360,000 were forcibly liquidated — close to one in every thirty Korean adults
At its peak, Korea’s credit-loan balance was equivalent to roughly 0.53% of Korean market capitalisation. Anybody who had looked at that ratio in May 2026 and concluded that Korean leverage was immaterial would have been arithmetically correct and catastrophically wrong. The aggregate ratio is not the risk. Concentration, tenor, the speed of the margin-call machinery and the identity of the marginal buyer are the risk.
Exhibit 3: Korea’s margin-to-market-cap ratio was at its lowest at the top and its highest after the crash
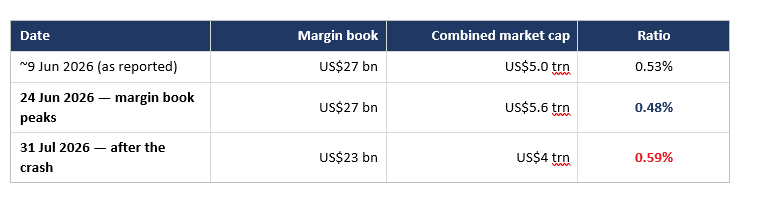
Source: Marcellus Investment Managers. Margin book per KOFIA. Market capitalisation is KOSPI plus KOSDAQ per Korea Exchange, as reported by The Asia Business Daily (₩7,670.06trn (US$5.4trn) and ₩550.27trn (US$386.0bn) respectively at 10:30am on 19 June 2026) and Seoul Economic Daily. The ~9 June ratio is the one reported in the Korean press and is corroborated by working backwards from the published splits: ₩28.57trn (US$20.0bn) of KOSPI margin at 0.43% implies a KOSPI market capitalisation of ₩6,644trn (US$4.7trn), and ₩9.36trn (US$6.6bn) of KOSDAQ margin at 1.73% implies ₩541trn (US$379.5bn). The 24 June and 31 July market-cap figures are interpolated between reported prints and are flagged as derived; KRX’s daily statistics series should be used if these rows are quoted independently.
Korea’s margin:market cap ratio was at its lowest on the day the margin book peaked, because market capitalisation was climbing faster than the borrowing. It is at its highest now, after the damage, because prices fell faster than the book could unwind. An analyst monitoring this single metric would have received a reassuring signal at the exact top and an alarming one only once the losses had been crystallised. The aggregate ratio is not a risk gauge. It is a coincident indicator of what has already happened.
India’s book is smaller and better spread. It is also more dangerous.
India’s MTF (Margin Trading Facility) lets an investor buy delivery shares by putting up a minimum of 25% of the value, with the broker funding the rest, holding the shares pledged in the client’s own demat account and charging daily interest. At the end of FY23 the whole national book was ₹25K crore (US$2.6bn). On 30 July 2026 it stood at ₹143K crore (US$15 bn) i.e. in around 3 years, the MTF book is up 5x.
Exhibit 4: India’s MTF book — from rounding error to ₹1.43 lakh crore (US$15.0bn)
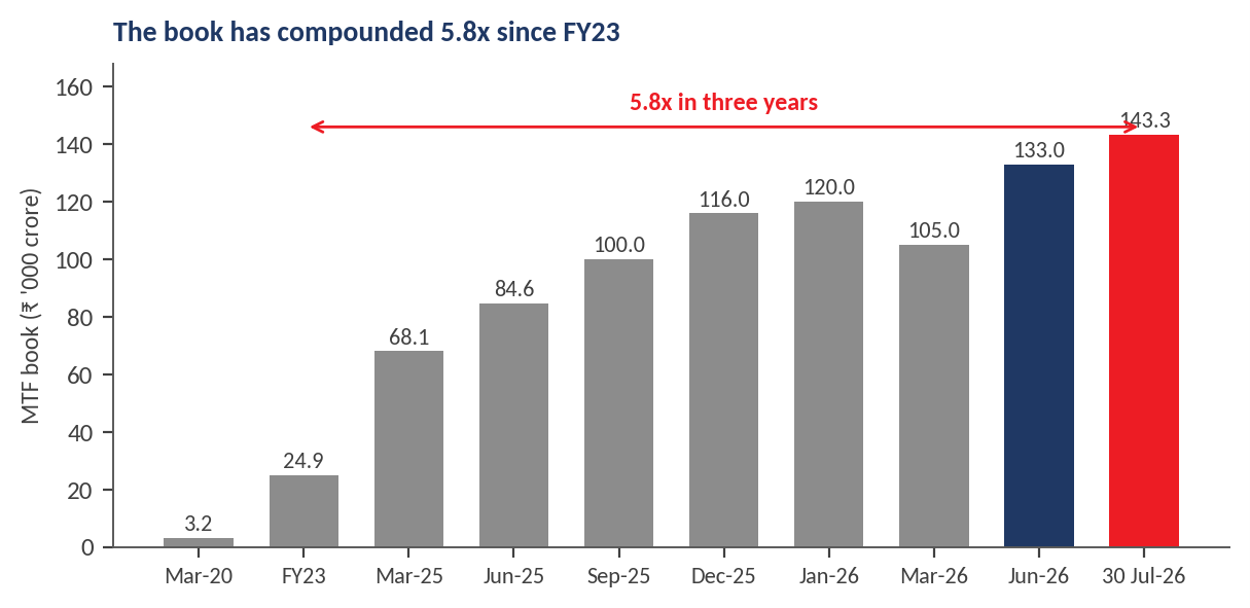
Source: Marcellus Investment Managers; NSE and BSE daily Margin Trading Disclosure files, aggregated by mtf.trading. FY23 figure per PPFAS Asset Management. March 2020 figure per Business Standard. Sep-25, Dec-25 and Jan-26 are month-end press-reported levels; Mar-26 and Jun-26 per Business Standard; 30 Jul-26 per mtf.trading. Growth multiple of 5.8x is measured FY23 to 30 July 2026.
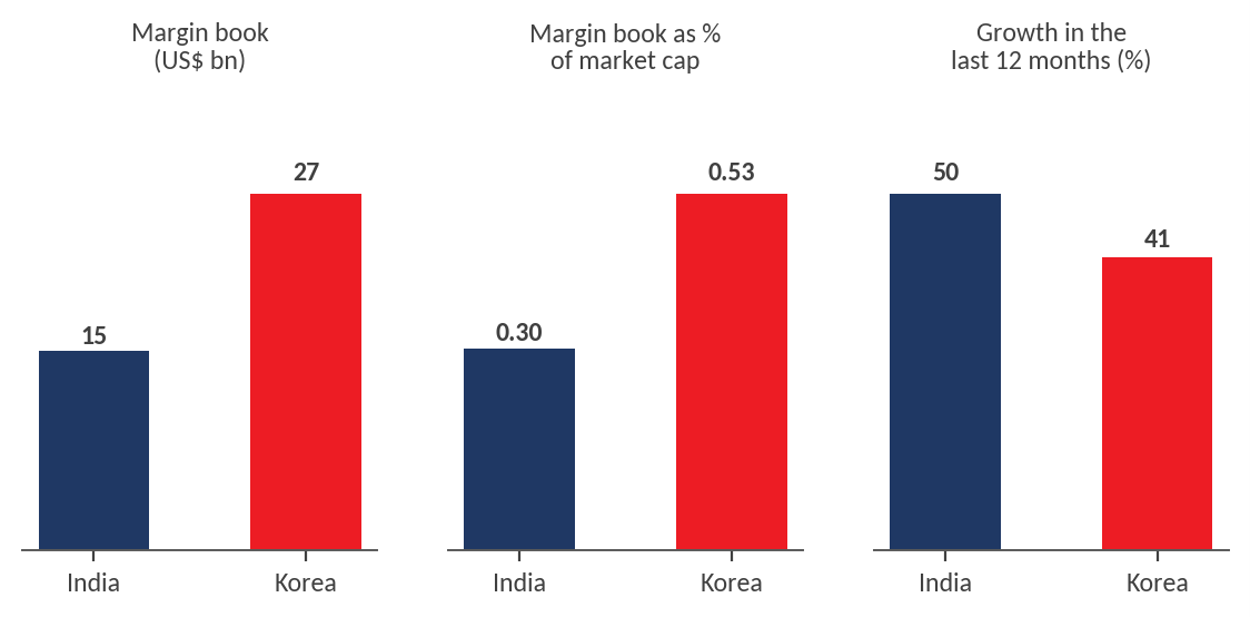
Source: Marcellus Investment Managers. India: MTF book of ₹1.43 lakh crore (US$15.0bn) per NSE/BSE disclosures via mtf.trading, 30 July 2026; growth of 50% year-on-year per Reuters, 21 July 2026. Denominator is the combined market capitalisation of all BSE-listed companies of ₹483.35 lakh crore (US$5.1trn) at the close of 29 July 2026 per BSE, as reported by Business Today, giving a ratio of 0.30%; the figure stood at ₹490.55 lakh crore (US$5.2trn) on 3 August 2026 and at a then-record ₹482.31 lakh crore (US$5.1trn) in early July 2026. Korea: KOFIA credit loan balance at the 24 June 2026 peak of ₩38.63trn (US$27.1bn); growth of 41% measured from ₩27.42trn (US$19.2bn) on 2 January 2026. Ratio of 0.53% is the figure reported in the Korean press for early June 2026, derived from 0.43% for the KOSPI and 1.73% for the KOSDAQ; computing it instead on a near-consistent date basis, using the 24 June margin book against the reported KOSPI-plus-KOSDAQ market capitalisation of ₩8,220.33trn (US$5.8trn) on 19 June 2026, gives 0.47%. Both are defensible and they are different dates; see Exhibit 3 for the full 0.47% to 0.59% range through the cycle. Korean figures exclude the additional ₩25.93trn (US$18.2bn) of securities-collateralised lending. The two denominators are both total listed market capitalisation on the primary domestic exchanges and are therefore comparable, though neither is adjusted for free float.
India’s book is smaller in absolute terms, smaller relative to market capitalisation, and far better spread. Anand Rathi’s Roop Bhootra has made the point fairly: hardly any single stock in India’s MTF book exceeds roughly ₹2,200 crore (US$0.23bn), which caps any one name at about 1.5% of the total. Korea had four stocks carrying the market. India has hundreds (source: Margin trading facility book grows for third straight month, hits ₹1.33 trn | Markets News – Business Standard).
However, we believe India is more exposed than Korea was, for three reasons that the aggregate numbers cannot show.
Reason one: India has converted bounded losses into unbounded ones
India’s MTF boom is the direct, intended consequence of policy. Having concluded that retail investors were being harmed by equity derivatives — SEBI’s own study found that more than 93% of individual F&O traders lost money between FY22 and FY24, with cumulative losses above ₹1.8 lakh crore (US$18.9bn) — the regulator tightened derivatives rules and set about deepening the cash market instead. Retail speculation duly migrated. HDFC Securities, one of the three largest MTF lenders, has seen its book more than double in fifteen months, and attributes much of it to traders who were previously active in single-stock futures. Kotak Securities expects MTF to compound at 20–25% a year against about 10% for derivatives.
Moving a speculator from options into margin lending reduces their leverage. It also changes the nature of what can go wrong, in a way we do not think has been widely appreciated.
Exhibit 6: The same speculative impulse, a fundamentally different liability
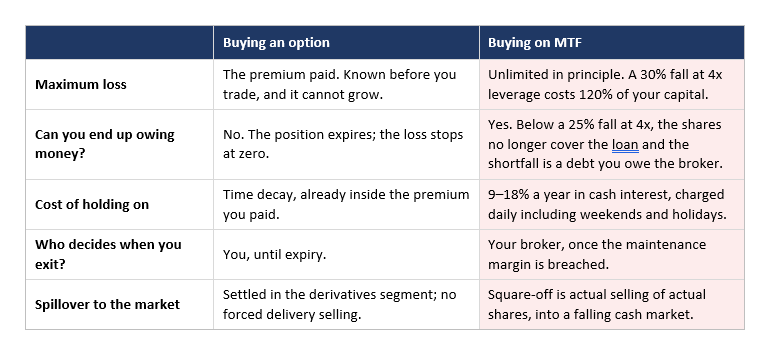
Source: Marcellus Investment Managers. MTF terms per SEBI’s margin trading framework (minimum 25% client margin, Group 1 securities, positions held up to 360 days) and published broker schedules; interest range of 9–18% per Reuters, 21 July 2026, and 9–24% per mtf.trading. Loss percentages are arithmetic at 4x gross leverage and are derived in Exhibit 7.
An option buyer who is wrong loses a premium and goes home. An MTF borrower who is wrong loses a multiple of their capital and, past a point, acquires a debt. India has taken roughly 130 million retail traders — median age 32, most of them earning under ₹5 lakh a year — and moved their speculation from an instrument with a floor to one without one. That is a worse household-balance-sheet outcome even if it is a better market-structure outcome, and it is the opposite of what Korea did.
Reason two: Korea levered into a melt-up. India is levering into a drawdown.
A rising margin book normally signals a rising market. Not so in India. India’s market capitalisation fell by more than US$533 bn in the first ten weeks of 2026. The Sensex was down about 11% over that period. The Nifty IT index touched its lowest level since May 2021 in early July.
Reuters reported in July 2026 that the most heavily MTF-bought stocks in India include Tata Consultancy Services and Infosys — both down more than 30% in 2026 — alongside HDFC Bank. All three were also the stocks most heavily sold by foreign investors. Indian retail is not riding a melt-up on borrowed money. It is averaging down into falling stocks, on borrowed money, against institutional selling.
Exhibit 7: What a drawdown does to a leveraged investor
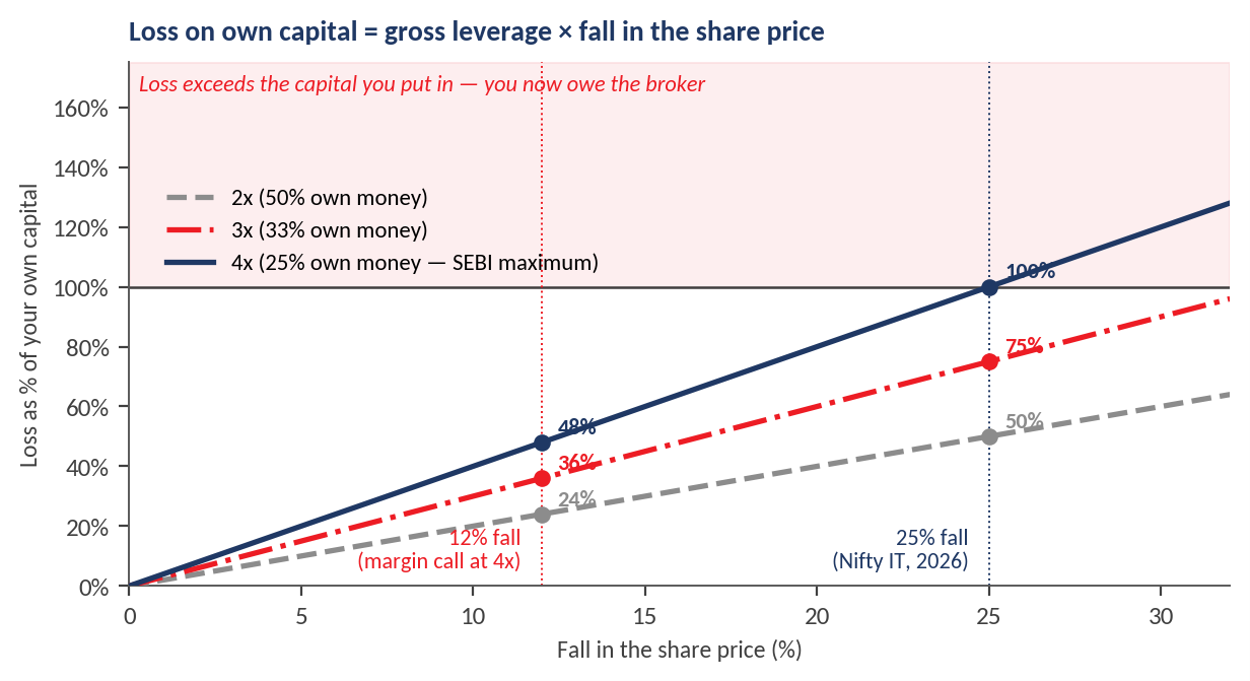
Source: Marcellus Investment Managers. Pure arithmetic: loss as a percentage of the investor’s own capital equals gross leverage multiplied by the fall in the share price. SEBI’s framework permits a minimum client margin of 25%, i.e. maximum gross leverage of 4x; 3x and 2x are shown because VaR-and-ELM-based initial margins mean many stocks attract lower effective leverage. Margin-call threshold assumes a 15% maintenance margin.
Follow the 4x line in the chart above since that is what SEBI’s 25% minimum margin permits and what brokers advertise. Put in ₹1 lakh, borrow ₹3 lakh, buy ₹4 lakh of stock:
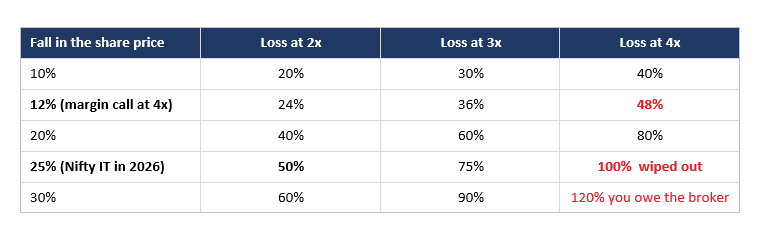
Source: Marcellus Investment Managers; arithmetic as described in Exhibit 7. At 4x leverage a 15% maintenance margin is breached after a fall of 11.8%, which is why 12% is shown as the margin-call row; at 3x the call comes at 21.6% and at 2x at 41.2%.
Two thresholds are worth committing to memory. At the maximum leverage SEBI permits, a 12% fall triggers the margin call and has already destroyed 48% of the investor’s capital. A 25% fall wipes out the capital entirely. The Nifty has had two 10%-plus drawdowns in the last eighteen months, and the IT index has fallen more than 30% this year alone.
And then there is the carry, which often goes under the radar. Interest accrues daily on the borrowed portion, weekends and holidays included. On the ₹3 lakh borrowed above, at 12% a year, that is roughly ₹100 a day — ₹36,000 over a year. Measured against the ₹4 lakh position that is 9%, so the stock has to rise 9% before the investor makes a rupee. Measured against their own ₹1 lakh it is 36%. At 18%, the top of the range Indian brokers charge, a flat year costs 54% of the investor’s capital. Put differently, at a 15% funding cost a 5% gain on the position is entirely consumed by interest within about five months — before securities transaction tax, GST, brokerage, pledge charges and 20% short-term capital gains tax on whatever survives.
Korea’s borrowers at least had a melt-up and cheap money. India’s are paying a punitive carry to average down into falling stocks. This book does not need a crash to destroy client capital. It is doing so already, quietly, at about ₹100 a day for every ₹3 lakh borrowed.
Meanwhile the shock absorber is thinning. Net equity mutual fund inflows fell 43% between March and May 2026, from ₹40,450 crore (US$4.3bn) to ₹22,908 crore (US$2.4bn), while the MTF book compounded at roughly 9% a month. The SIP stoppage ratio also crossed 100% in both March and April 2026 — more accounts closing than opening — and outstanding SIP accounts contracted in both months, before improving to a six-month low by June.
Exhibit 8: Leverage accelerated exactly as the unlevered bid weakened
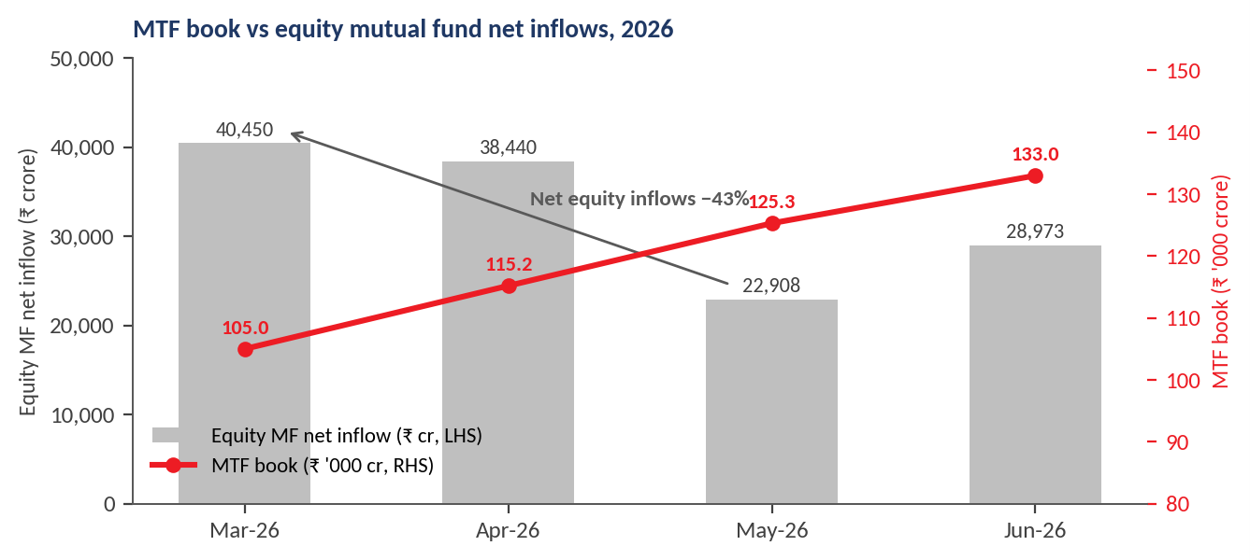
Source: Marcellus Investment Managers; AMFI monthly data for equity mutual fund net inflows; MTF book per NSE/BSE disclosures as reported by Business Standard and mtf.trading. Mar-26 (₹1.05 trn (US$11.0bn)) and Jun-26 (₹1.33 trn (US$14.0bn)) MTF levels are as reported; the Apr-26 and May-26 levels are derived by applying the reported month-on-month growth rates of 9.7% and 8.8% to the March level and are flagged as derived rather than primary-source figures. The derived chain reconciles to the reported June level within 0.2%.
Reason three: the concentration is in the lenders, not the stocks
Because no single Indian stock carries much of the MTF book, the market has concluded that concentration risk is absent. It has simply moved somewhere less visible.
Exhibit 9: Eight brokers carry two-thirds of India’s margin book
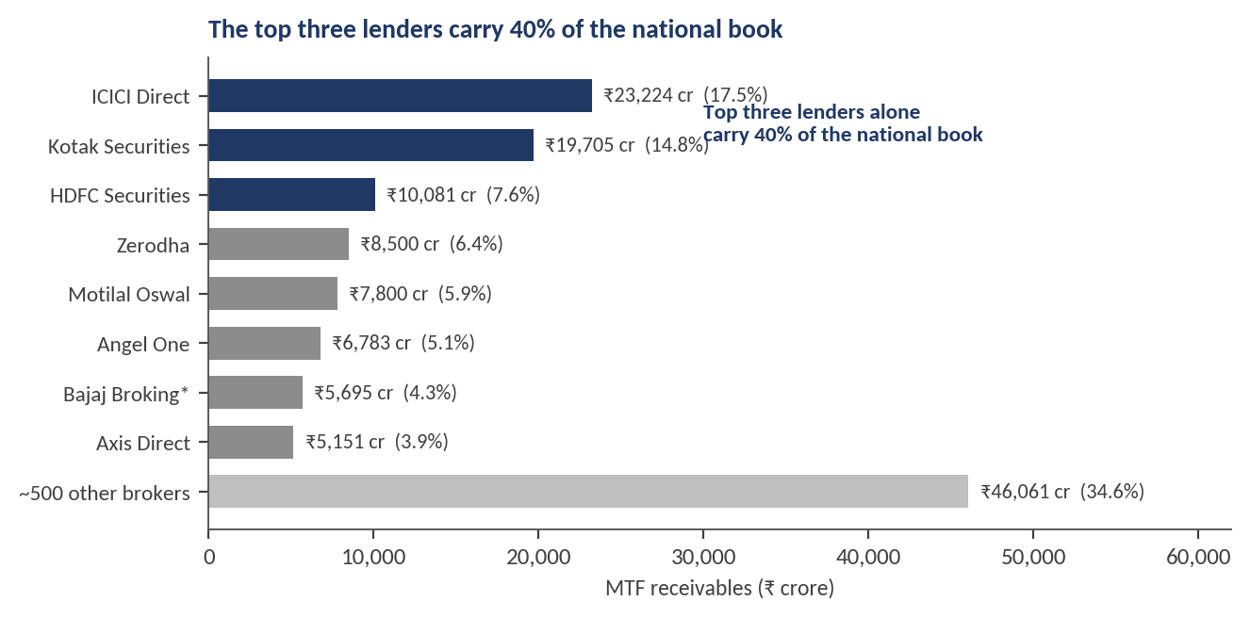
Source: Marcellus Investment Managers; per-broker MTF receivables curated by mtf.trading from credit-rating reports, annual reports, quarterly results and conference calls. ICICI Direct, Kotak Securities, HDFC Securities and Angel One as at 30 June 2026; Zerodha as at 22 July 2026. Motilal Oswal is the group Margin Trade Funding book as at 30 June 2026, disclosed in the company’s Q1FY27 results. *Bajaj Broking as at 31 March 2026 and is therefore stale relative to the others. Shares are computed against the June 2026 national book of ₹1.33 lakh crore (US$14.0bn). The residual for other brokers is derived as the balance.
ICICI Direct alone carries about 17% of the national book. The top three lenders carry 40% and the top eight carry 65%, with the remainder fragmented across roughly 500 brokers where credit quality, funding access and liquidity buffers are weaker. PPFAS Asset Management flagged precisely this in February 2026 (source: PPFAS Mutual Fund releases source of margin trading facility book and its impact on liquid funds – The Economic Times)s. The growth rate at individual lenders corroborates the national picture: Motilal Oswal disclosed in its Q1FY27 results that the group’s MTF book had grown 55% year-on-year to ₹7,800 crore (US$0.82bn), against 33% growth in its wealth-management loan book as a whole. Margin funding is expanding faster than the rest of what these firms lend against.
The consequence is the one that should concern any Indian equity investor, whether or not they have ever used MTF. When a forced unwind comes, a broker managing a margin call does not sell the overvalued stock. It sells the liquid one. Liquidation is indiscriminate by design, so the selling lands on quality large-caps and index names because those are what can actually be sold in size. Owning a well-chosen Indian portfolio with zero margin exposure does not protect you from somebody else’s margin call. This is why we regard India’s MTF build-up as a market-structure risk rather than a stock-selection risk — and market-structure risk cannot be diversified away inside the same market.
Where this may end, and what an investor can actually do
We are not forecasting an Indian version the meltdown Korea saw in July. We are making a narrower case: the conditions that turned Korea’s leverage into a cascade are being assembled in India in a different order, and the mechanism by which it would transmit is now in place. The likely path from here has four steps, none of which requires anybody to behave irrationally.
- The book keeps growing. MTF is now a high margin, secured, recurring revenue line for brokers, and they are cutting rates to win share. Kotak guides to 20–25% annual growth. Regulatory policy change has channelled retail from derivatives into leveraged cash.
- The funding gets shorter. With bank funding curbed, the marginal rupee of MTF credit comes from wholesale markets that reprice quickly against the cycle.
- The trigger is unremarkable. A 12% index move margin-calls a 4x book. India has had two of those in eighteen months, without any leverage-related drama, because the book was a third of its current size.
- The selling is indiscriminate and self-reinforcing. Calls land simultaneously across the crowded names, square-offs push prices lower, lower prices generate more calls. In Korea the forced-liquidation rate went from 2.1% to above 10% in days.
For an investor, the honest conclusion is that none of the usual defences work well. Avoiding MTF yourself is necessary but insufficient. Avoiding the heavily margined stocks is impractical, because the book is spread across hundreds of names and the forced selling will hit liquid quality regardless. Holding cash protects capital but sacrifices compounding for an event with no date attached. And Indian mutual funds, however well run, are structurally obliged to be invested in the same market.
Which leaves the one defence that does work: own assets whose price is set somewhere other than Dalal Street, in a currency other than the rupee.
Why dollar diversification is the answer to a rupee-leverage problem
The case does not rest on predicting a margin crisis. It rests on three things that are already true.
- The fire, if it comes, is domestic and rupee-denominated. Forced deleveraging is a local liquidity event. Dollar assets held offshore are not in the collateral chain, are not sold to meet an Indian margin call, and typically rise in rupee terms when the rupee weakens under stress.
- The rupee imposes a standing drag. The rupee has gone from ₹18 to the dollar in 1991 to around ₹96.6 in late July 2026 — roughly 5% a year, decade after decade. Over the period covered in Exhibit 10 below, the drag was about 3.8% a year. That is the head start a dollar asset enjoys before any question of relative stock returns.
We would make one final observation about timing. Leverage is easiest to step away from while the market is calm, dollars are cheapest to buy while the rupee is orderly. Korea’s retail investors did not lack information in May 2026. The FSS Governor had publicly warned about the leverage frenzy; the Bank of Korea had flagged it in its financial stability report; brokerages were already restricting credit purchases. The warnings were all there. What was missing was anybody acting on them while acting was still cheap.
Since 31 October 2022, the Nifty 50 has compounded at 9.20% a year in rupees and just 5.16% in dollars. Over the same period our Global Compounders Portfolio compounded at 25.36% in rupees and 20.73% in dollars. An Indian investor who diversified into dollar equities with Marcellus gave up nothing and earned roughly 16 percentage points a year more than the Nifty, in their own currency.
Exhibit 10: Global Compounders Portfolio — wealth creation since inception, in USD and in INR
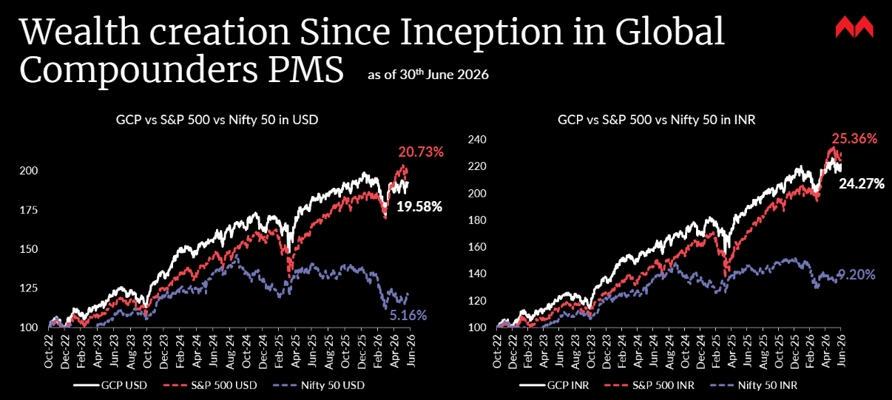
Note: Marcellus’ performance data shows the gross of taxes and net of fees & expenses charged till end of last month on client account. Performance fees are charged annually in December. Returns more than 1 year are annualized. Marcellus’ GCP USD returns are converted into INR using USD: INR exchange rate from RBI – Link for the reference
*Since Inception performance calculated from 31st Oct 2022. The inception date is 31st Oct 2022, the next business day after the account got funded on 28th October 2022. S&P 500 net total return is calculated by considering both capital appreciation and dividend payouts. The calculation or presentation of performance results in this publication has NOT been approved or reviewed by the IFSCA or US SEC. Performance is the combined performance of RI and NRI strategies. S&P 500 NTR is the benchmark for the strategy. Nifty 50 is provided for reference to illustrate the relative performance of the US and Indian markets. Past performance pertains to Marcellus’ GCP PMS strategy, not to this IFSC Retail Scheme and is not indicative of future results.
Marcellus GCP PMS is offered by Marcellus Investment Managers GIFT Branch in a segregated managed accounts format.
Access for Indian investors runs through GIFT City, Gujarat, where Marcellus offers multiple global funds that give Indian investors exposure to US$ assets. Ticket sizes begin at around US$5,000 (approximately ₹4.5 lakh), subject to the specific product, regulatory classification and investor eligibility. Our flagship global product is the Global Compounders Portfolio shown in Exhibit 10 above. Marcellus GCP PMS is offered by Marcellus Investment Managers GIFT Branch in a segregated managed accounts format.
If you would like to invest with us, please visit invest.marcellus.in OR scan the QR code below.

Click Here for details about our regulatory registration and licensing information.
The above material is neither investment research, nor investment advice. Marcellus does not seek payment for or business from this material/email in any shape or form. Marcellus Investment Managers Private Limited (“Marcellus”) is regulated by the Securities and Exchange Board of India (“SEBI”) as a provider of Portfolio Management Services. Marcellus is also a US Securities & Exchange Commission (“US SEC”) registered Investment Advisor and is regulated by the International Financial Services Centres Authority (IFSCA) as a Fund Management Entity. No content of this publication including the performance related information is verified by SEBI, IFSCA or US SEC. If any recipient or reader of this material is based outside India and USA, please note that Marcellus may not be regulated in such jurisdiction and this material is not a solicitation to use Marcellus’s services. The PMS strategy, Category III AIF products and IFSCA retail schemes are distinct offerings with different regulatory frameworks, risk profiles, fee structures and investment thresholds; minimum investment amounts referenced (e.g. ~US$5,000) are applicable to specific IFSCA retail schemes and may not apply to PMS or Category III AIF products. Investors should refer to product-specific documents for details before investing. All recipients of this material must, before dealing and or transacting in any of the products and services referred to in this material, make their own investigation and seek appropriate professional advice. Past performance is not indicative of future results. Marcellus and/or its associates, the authors of this material (including their relatives) may have financial interest by way of investments in the companies covered in this material. Marcellus does not receive compensation from the companies for their coverage in this material. This material may contain confidential or proprietary information and user shall take prior written consent from Marcellus before any reproduction in any form.