OVERVIEW
POPULAR ARTICLES
A simple equal weighted portfolio of 5 widely available assets (rebalanced annually) gives you returns similar to Indian equities with risk which is nearly 1/4th that of the Nifty50. This allows you to compound your wealth at a healthy rate while allowing you to sleep peacefully at night, both, during heart stopping years like 2008 (when the Nifty50 fell over 60%) and through the very long periods of ZERO returns which visit the Indian market more frequently than anyone would like to admit. Our free goal planning & asset allocation service ( plan.marcellus.in) helps you build your personalised Multi-Asset Portfolio methodically, calmly and cost-efficiently.
The dilemma of the Indian investor
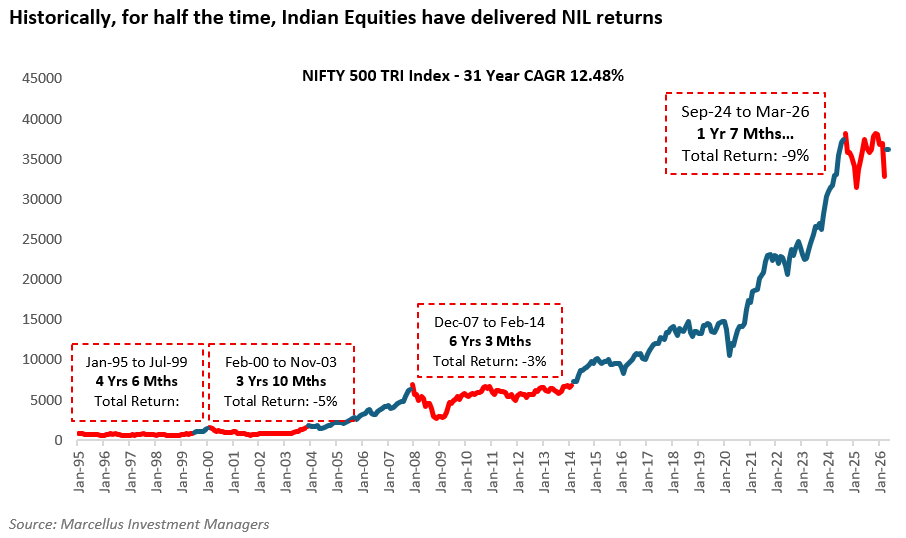
Indian equities’ long-term returns are modest at best (12.7% is the 31-year CAGR of the Nifty500) even these returns come with heart-stopping risk eg. in 2008 the Nifty corrected by over 60%. Furthermore, there are very long periods when Indian Equities give zero returns eg. from 1993-2003, the Sensex gave no returns – see chart below.
On the other hand, low-risk investments such as debt gave even more modest returns which after adjusting for capital gains taxes (which are bizarrely high on Indian debt if you are a domestic investor) are barely 4% per annum.
So, what is a retail investor to do with her wealth India given that equities are risky and give modest returns and bonds give sub-par returns?
Enter the 30 year Asset Allocation Quilt
To answer this question, we looked at long term returns from five widely available assets which have low correlation with each other:
· Indian equities (represented by the Nifty50)
· Global equities (represented by the S&P500)
· Gold
· Debt (represented by CRISIL Comp. Bond Index)
· Cash (represented by CRISIL 3M Till).
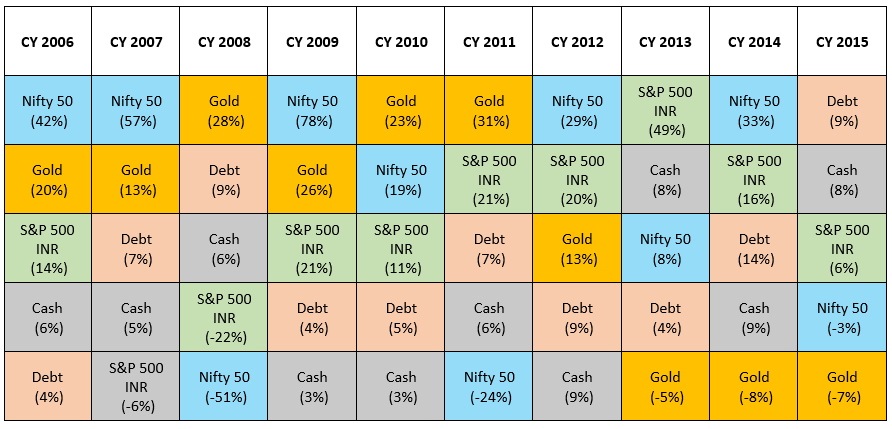
To make the exercise as rigorous as possible, we went as far back in time as was practically possible from a data availability perspective. We used data on S&P500, gold and cash from 1996 onwards. We used data on the Nifty50 from 2000 onwards and we used data on debt from 2003 onwards. We then calculated annual returns from each of these 5 asset classes to create what we call the 30-year Asset Allocation Quilt – see below.
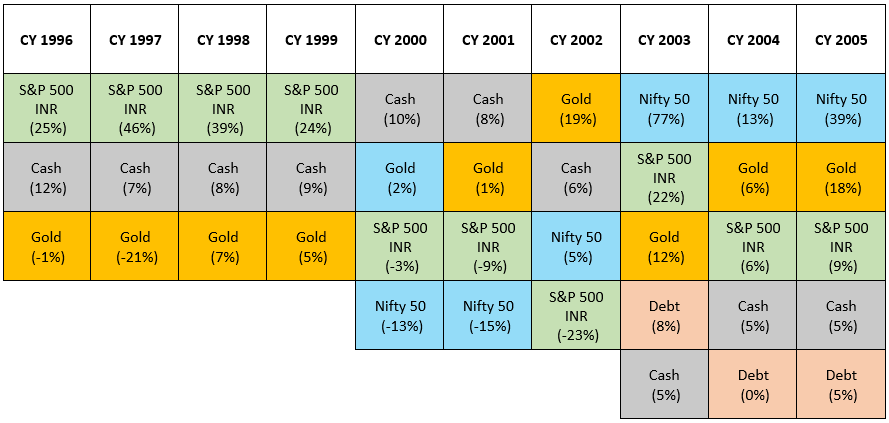
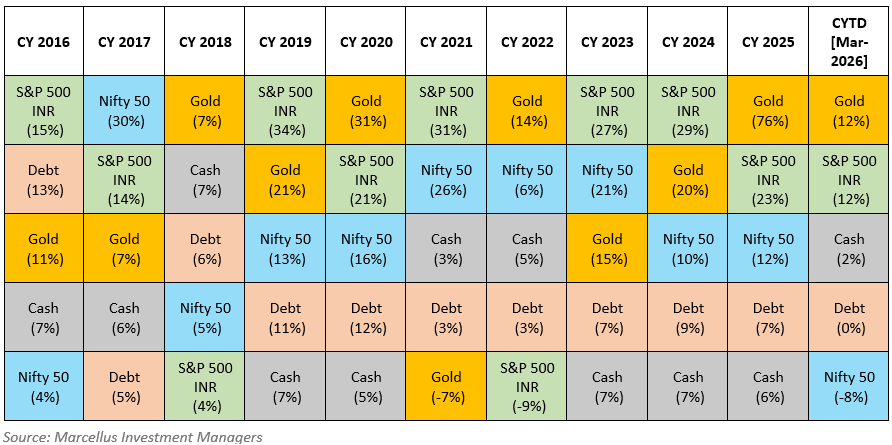
What we found from the 30-year Asset Allocation Quilt made us rethink the widely touted advice that equities are the best asset for long term wealth creation. Here are the key takeaways:
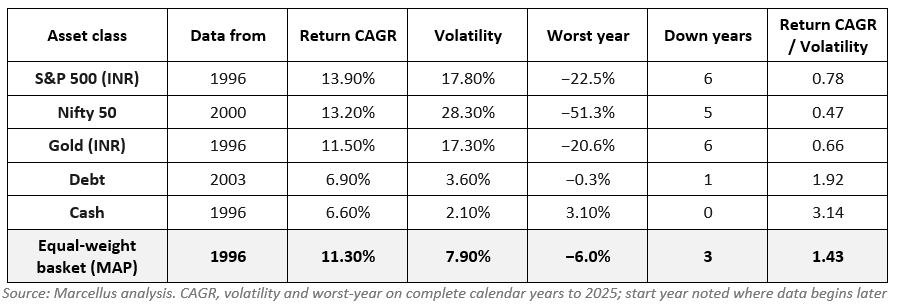
- Owning all five asset classes in equal measure — 20% each, rebalanced every 1 January — compounded at 11.3% a year over the full 30 years (1996–2025), turning ₹1 lakh into roughly ₹25 lakh.
- It did so with a remarkably smooth ride: annual-return volatility of just 7.9% (versus 28% for the Nifty), only 3 losing years in 30, and a worst year of just −6%.
- In the 2008 crash the Nifty fell 51% and US equities (in rupees) fell 22% — but gold rose 28%, debt 9% and cash 6%, so the basket lost only 6%. That is the entire case for diversification in one year.
- No single asset wins for long. The annual winner changed almost every year; last year’s number-one repeated only 37% of the time. Chasing the previous winner failed nearly two-thirds of the time.
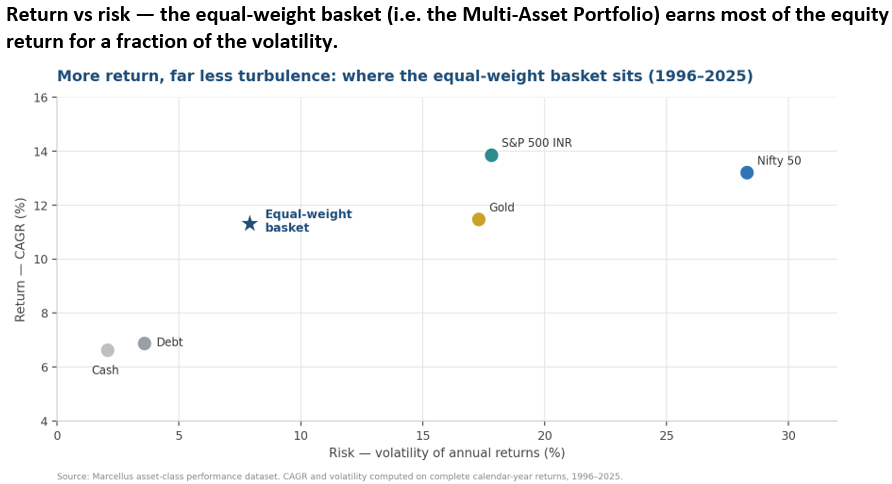
- The basket earned 81% of the best single asset’s return (S&P 500 in INR, 13.9%) for barely a quarter of the Nifty’s turbulence. Most of the return, a fraction of the stress — that is the point.
- Does last year’s winner stay on top? Answer: Almost never — the previous year’s number-one repeated only 37% of the time. Chasing it failed nearly two-thirds of the time. Of the 30 year-to-year transitions in the quilt’s top row, the leading asset class held its crown only 11 times. The other 19 times, money that piled into last year’s star backed the wrong horse. This is the data behind the warning every adviser gives and every investor ignores: performance-chasing is a structurally losing strategy, and the quilt proves it.
- In this 30-year window (1996-2025) annual rebalancing slightly reduced return (versus just owning the Nifty50) BUT DRAMATICALLY REDUCED RISK. In fact, if you look at the table below, you will see that with just 1/4th the volatility associated with equities, an annual weighted Multi-Asset Portfolio (MAP) generates returns which are comparable to equities (11.3% vs 13.2% for Nifty 50). In other words, for every unit of risk taken, MAP gives you 1.43 units of return. In contrast, the Nifty50 fails miserably on this front – for every unit of risk taken, it gives just 0.47 units of return i.e. MAP is 3x as good as the Nifty50 in generating low term risk-adjusted returns.
The way forward from Marcellus: Goal-based asset allocation
The 30-year quilt makes one argument over and over: nobody can reliably pick next year’s winner, so the discipline is to own the spread and rebalance. A diversified basket gives up a little of the top-performing asset’s return in exchange for a dramatically smoother journey — and a smoother journey is what keeps real investors invested. For an Indian portfolio, the genuinely useful refinements are the two assets investors most often skip: a meaningful gold allocation (which carried the basket through 2008 and delivered a 76% rupee return in 2025) and a global-equity sleeve in rupee terms (the single best 30-year performer).
So how can you get your very own diversified Multi-Asset Portfolio?
Marcellus offers a free goal planning and asset allocation framework wherein you can reach out to us and get a detailed 4-page financial report free of charge.
We work with a three-step approach to help our clients diversify globally:
- Map your life goals to financial goals. How much do you need for near, medium, and long-term goals?
- Allocate your investments across multiple uncorrelated asset classes. Avoid over concentration, illiquidity and disproportionate risk-reward. Get the allocation right based on your needs and your risk tolerance.
- Remain disciplined. Continue to save and channel savings to investments. Review and rebalance regularly.
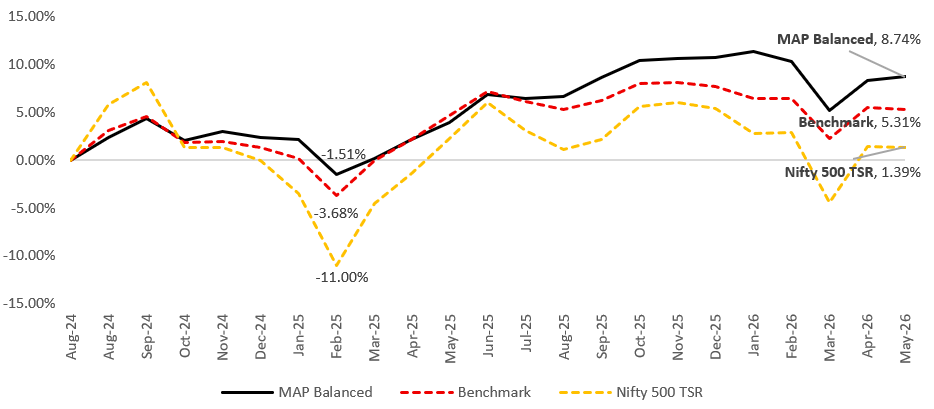
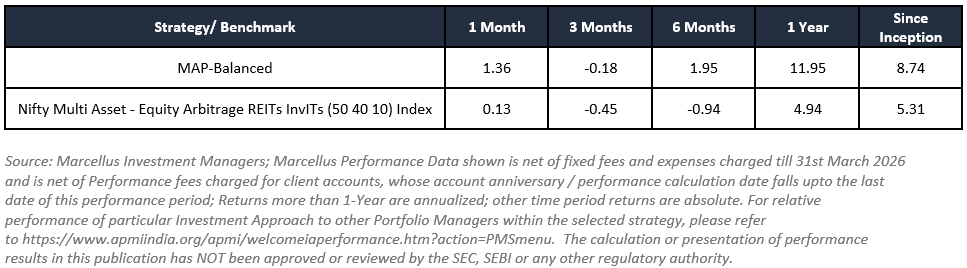
Marcellus’s ‘MAP-Balanced’ which has delivered 8.74% returns since inception in Aug-24 to May-26 net of all fees and costs against 1.39% of Nifty 500 TSR (see the chart below).
If you would like to explore this free service (with no-strings attached) then either scan the QR code below OR visit plan.marcellus.in.

Please note that this is neither a financial plan, nor an investment advise.
Thanks,
Saurabh Mukherjea
Click here for details about our regulatory registration and licensing information
Here are the sources which helped us write this blog:
1. Hisabhkaro.com, ‘How Much Retirement Corpus Do You Need in India?’ (March 2026); Arthgyaan.com, ‘Does the 4% SWR Rule Work in India?’ (February 2024) and ‘Safe Withdrawal Rates and Required Portfolio Returns’ (February 2026); Aditya Birla Sun Life Insurance retirement corpus calculator (November 2025).
2. Kiplinger, ’16 Retirement Mistakes You Will Regret Forever’ (2026), citing Dutch Point Credit Union savings projections. Assumes 8% annual return.
3. Aaron R. Simpson, CFP, ‘Don’t Let Sequence of Returns Risk Ruin Your Retirement’, Kiplinger (October 2025).
4. Vanguard, ‘Target Retirement Glide Path’ (Workplace Solutions documentation); Morningstar India, ‘Use a glide path approach to investing’; Outlook Money, ‘Glide to Your Retreat’.
5. World Population Prospects 2024 Revision, UN DESA; Government of India / Sample Registration System; India Data Map, ‘India’s Life Expectancy in 2025: Key Insights and Trends’; Data For India life expectancy series (December 2025).
6. UNFPA India Ageing Report 2023, United Nations Population Fund.
7. ACKO India Health Insurance Index 2024; Aon Global Medical Trend Rates Report 2025.
8. Plum, ‘Health Report of Corporate India 2023’, covered by Business Standard, ‘India’s workforce faces rising medical inflation, reveals report’ (Anjali Singh, November 2023); Onsurity, ‘Medical Inflation in India 2026: Impact on Health Insurance’ (April 2026).
9. Hisabhkaro.com, ‘How Much Retirement Corpus Do You Need in India?’ (March 2026) — India-adjusted Safe Withdrawal Rate analysis arriving at 3.5% (vs the global 4% Trinity rule) and a 28–30x corpus multiple, with 31–33x for early retirees on a 40-year horizon; Arthgyaan.com, ‘Does the 4% SWR Rule Work in India?’ (February 2024) — SWP drawdown simulations on Sensex TRI and PPF returns.
10. HSBC Quality of Life Report 2024 — survey of 11,230 affluent individuals across 11 markets, defining ‘affluent’ as those with USD 100,000-2,000,000 in investable assets.
11. Jefferies India Household Balance Sheet study (covered by Cafemutual, July 2023), showing 51% real estate, 15% gold, 14% bank deposits, 6% insurance, 6% pension funds, 5% equity, 3% cash of total household assets as of March 2023. On long-run equity returns: Nifty 50 has delivered approximately 12–14% CAGR over the past 20 years versus average CPI inflation of ~6.8% (CalcNation / RupayWise India CPI history dataset).
12. BusinessToday, ‘TCS layoffs shake Indian IT: Mass exits show even safe jobs aren’t untouchable’ (28 July 2025), citing Phil Fersht (CEO, HFS Research) in Mint and Keith Bachman of BMO Capital Advisors. Estimate of 400,000–500,000 jobs at risk reported by The Perfect Stories analyst compilation (September 2025).
13. Business Standard, ‘IT union AIITEU slams TCS’ 225-day billability and 35-day bench policy’ (Avik Das, 19 June 2025); coverage also in Goodreturns (‘No Project? No Pay Hike!’, June 2025) and The Bridge Chronicle (July 2025). Policy effective from 12 June 2025.
14. India Retirement Index Study (IRIS) 4.0, Max Life Insurance & Kantar Insights, October 2024 — 2,077 respondents aged 25-65 across 28 Indian cities.
15. PGIM India Mutual Fund, ‘Retirement Readiness Report 2025’ (Third Edition), December 2025 — NielsenIQ survey of 3,088 Indian adults aged 26-60 across 19 cities.
16. Outlook Money, ‘Glide to Your Retreat’; Morningstar India, ‘Use a glide path approach to investing’; Finnovate, ‘Asset Allocation by Age in India: Ideal Equity, Debt, Gold Split’ (February 2026); Jiraaf, ‘Asset Allocation Strategies for Retirement in India’ (October 2025). Note: Brinson, Hood & Beebower (1986), ‘Determinants of Portfolio Performance’, Financial Analysts Journal, established that ~90% of portfolio return variability is explained by asset allocation.
Disclaimer:
The above material is neither investment research, nor investment advice. The performance information mentioned is provided for illustration of asset allocation outcomes and should not be construed as indicative of future performance. Marcellus does not seek payment for or business from this material/email in any shape or form. Marcellus Investment Managers Private Limited (“Marcellus”) is regulated by the Securities and Exchange Board of India (“SEBI”) as a provider of Portfolio Management Services. Marcellus is also a US Securities & Exchange Commission (“US SEC”) registered Investment Advisor. No content of this publication including the performance related information is verified by SEBI or US SEC. If any recipient or reader of this material is based outside India and USA, please note that Marcellus may not be regulated in such jurisdiction and this material is not a solicitation to use Marcellus’s services. All recipients of this material must before dealing and or transacting in any of the products/services referred to in this material must make their own investigation, seek appropriate professional advice. This communication is confidential and privileged and is directed to and for the use of the addressee only. The recipient, if not the addressee, should not use this material if erroneously received, and access and use of this material in any manner by anyone other than the addressee is unauthorized. If you are not the intended recipient, please notify the sender by return email and immediately destroy all copies of this message and any attachments and delete it from your computer system, permanently. No liability whatsoever is assumed by Marcellus as a result of the recipient or any other person relying upon the opinion unless otherwise agreed in writing. The recipient acknowledges that Marcellus may be unable to exercise control or ensure or guarantee the integrity of the text of the material/email message and the text is not warranted as to its completeness and accuracy. The material, names and branding of the investment style do not provide any impression or a claim that these products/strategies achieve the respective objectives. Further, past performance is not indicative of future results. Marcellus and/or its associates, the authors of this material (including their relatives) may have financial interest by way of investments in the companies covered in this material. Marcellus does not receive compensation from the companies for their coverage in this material. Marcellus does not provide any market making service to any company covered in this material. In the past 12 months, Marcellus and its associates have never i) managed or co-managed any public offering of securities; ii) have not offered investment banking or merchant banking or brokerage services; or iii) have received any compensation or other benefits from the company or third party in connection with this coverage. Authors of this material have never served the companies in a capacity of a director, officer or an employee. This material may contain confidential or proprietary information and user shall take prior written consent from Marcellus before any reproduction in any form.