OVERVIEW
POPULAR ARTICLES

In our 21st October blog (India’s New Kings & Queens Are Flourishing in Small Town India) we showed how a new class of business families is flourishing in small-town India. In our 27th October 2026 blog we showed how one route into this class runs through auto dealerships. Another one runs through mutual fund distribution. Over the past decade the Nifty 50 has compounded at about 11% a year and India’s mutual fund assets have grown nearly 6x. Mutual fund distributors (MFDs) have ridden this growth. A typical MFD now earns revenues of around Rs 15 lakhs a year from mutual funds, insurance, fixed deposits and other products, up 50–85% from FY16. The average active MFD takes home about Rs 10 lakh a year. The money is made less by those who join than by those who stay: an MFD who has been in the business since FY16 has grown her revenue by about 12% a year to over Rs 31 lakh, and the number of MFDs managing more than Rs 1,000 crore has risen 10x in five years. The earnings come from a sticky client book, the high trail on equity funds and a vast, underserved small-town market. Please visit invest.marcellus.in if you would like to invest with us in a rapidly changing India.
“Without counsel plans fail, but with many advisers they succeed.” – Proverbs 15:22
Where we left off: the new Kings & Queens of small-town India
In India’s New Kings & Queens Are Flourishing in Small Towns, we showed that a new breed of wealthy Indian is on the rise. In our 27th October blog, New Kings & Queens: India’s Auto Dealers, we followed the money from India’s auto makers to the families who run their dealerships.
Another way to become a new king or queen in India – and a route which needs far less capital than is required for an auto dealership – is to become a mutual fund distributor or MFD. In this blog we follow the money from India’s stock market to the 1.3 lakh individuals who sell mutual funds, insurance and fixed deposits to the country’s savers.
Ten years of 11% a year growth in Indian equities
Over the past decade the Nifty 50 has risen from 7,738 at the end of March 2016 to 22,331 at the end of March 2026, a compound annual growth rate of 11.2%, or 12.5% including dividends. That growth came through demonetisation, GST, the IL&FS crisis and Covid. Mutual funds grew faster still: the industry’s assets rose from Rs 12.3 lakh crore to Rs 73.7 lakh crore, as systematic investment plans (SIPs) brought crores of first-time investors into the market.
Exhibit 1: Indian equities have compounded at 11% a year and mutual fund assets have grown six-fold
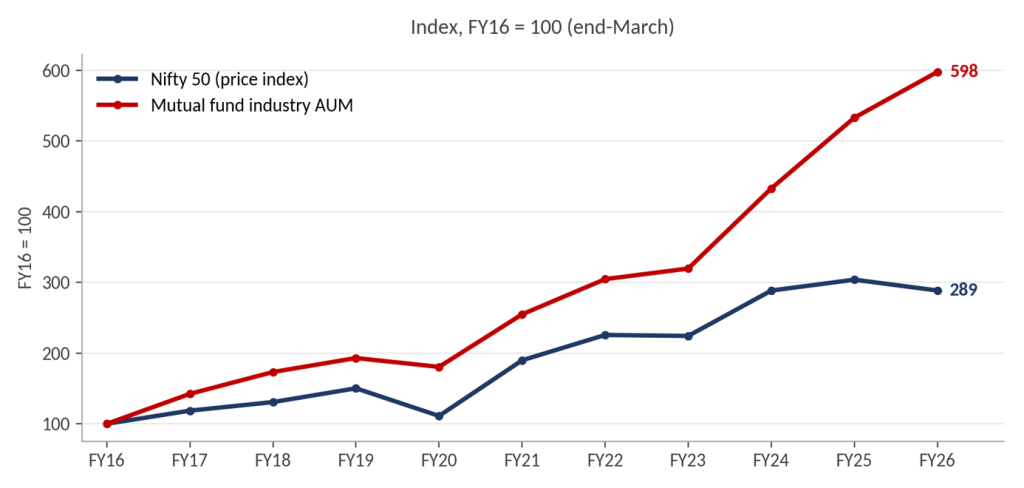
Source: Marcellus Investment Managers; NSE index levels (Marcellus research database); AMFI. End-March levels. Nifty 50 price index; mutual fund industry assets under management. Nifty 50 TRI used for the return including dividends. Index data is shown for context only and is not the performance of any Marcellus strategy. Past performance is not indicative of future results.
This has not only translated into wealth for the shareholders of the companies in these indices, but also for those who sell our products as well as those of other asset managers – much like the growth of the auto industry has translated into growth for auto dealerships. We estimate that asset management companies (AMCs) paid distributors about Rs 29K crore of commission in FY26, 4.6x the ~Rs 6.3K crore they paid in FY16.
So, who has pocketed the gains?
A pool of commission that has grown more than four-fold in a decade creates a lot of wealth. Much of it accrues to banks, to listed distributors and to the shareholders of asset managers. But how has the growth of this sector translated into wealth creation for the new Kings & Queens – the individual MFDs who sit across the table from India’s savers in towns across the country?
The answer: a typical MFD earns Rs 13–17 lakh a year and keeps more than half of it
A typical MFD in India earns revenue of between Rs 13.5 lakh and Rs 17.2 lakh a year from commissions, up 50–85% from FY16, with a profit margin of about 55% for the average active MFD (or about Rs 9.5 lakh, ~Rs 79,000 a month) after all costs, and an accounting return on capital employed (ROCE) of about 143%. Of course, for an MFD the largest capital employed is her client book, which takes years to build; valued at what Prudent Corporate paid for a Pune-based MFD practice in 2025 – about 5.5x its annual commission – the economic ROCE comes to about 17%.
The number of individual MFDs registered with AMFI has itself grown by 165% over the last ten years, from about 71,000 to 1.88 lakh, of whom about 1.30 lakh are active. The lower end of our range is the typical MFD (excluding the top ~1,500 individual MFDs); the upper end is the average active MFD.
To size these earnings, we built a simple five-step model of the average active individual MFD. These are estimates rather than reported figures, but they give a sense of scale.
Step 1: the commission pool
We start with the average assets of each category of mutual fund, the share of those assets sold through distributors (‘regular’ rather than ‘direct’ plans) and the annual trail commission the AMC pays on each category. Together, India’s AMCs paid about Rs 29,245 crore in FY26. Active equity funds account for about 74% of the pool.
Step 2: how much reaches individual MFDs
Not all of this reaches individual MFDs. Banks and large brokers took about 24% in FY26 and corporate and wealth firms about 29%. National distribution platforms such as NJ and Prudent pass about 65% of what they earn to the MFDs who work with them and keep the rest. That leaves about 42%, or ~Rs 12,138 crore, for individual MFDs.
Exhibit 2: About 42% of the commission paid by AMCs reaches individual MFDs
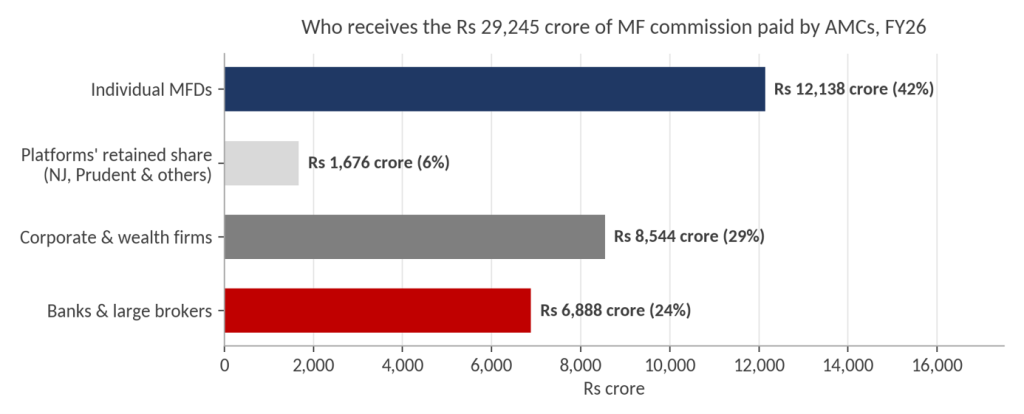
Source: Marcellus Investment Managers estimates based on AMFI, AMFI-Crisil Factbook 2026, 1 Finance analysis of AMFI commission disclosures, Cafemutual, o3 Capital, IRDAI, SEBI, RBI, PFRDA and Prudent Corporate filings. FY26. Group shares use the FY25 mix of AMFI commission disclosures. Figures may not add up due to rounding. Mention of these companies is for illustration only and is not a recommendation.
Step 3: from the pool to one MFD
Dividing ~Rs 12,138 crore among the 1.30 lakh active individual MFDs gives about Rs 9.3 lakh of mutual fund commission per MFD in FY26, up from Rs 4.7 lakh in FY16. Commission is paid including GST, so an MFD large enough to be registered for GST passes part of it on to the government – about Rs 0.7 lakh on average.
Step 4: what else does she sell?
Mutual funds are only half the story. Alongside them, she also sells life and health insurance, company fixed deposits, portfolio management services (PMS), alternative investment funds (AIFs), the National Pension System (NPS) and bonds. Anchoring on a Cafemutual survey of distributors’ income and growing each product in line with its industry, we estimate that the average MFD earned ~Rs 8.5 lakh a year from these products in FY26: Rs 2.9 lakh from life insurance, Rs 2.1 lakh from health and general insurance, Rs 1.5 lakh from fixed deposits and the rest from AIFs, NPS, PMS, bonds and referral fees. PMS, AIFs and NPS are small for the average MFD; AIFs and NPS are the fastest growing.
Exhibit 3: Half of an MFD’s revenue comes from products beyond mutual funds
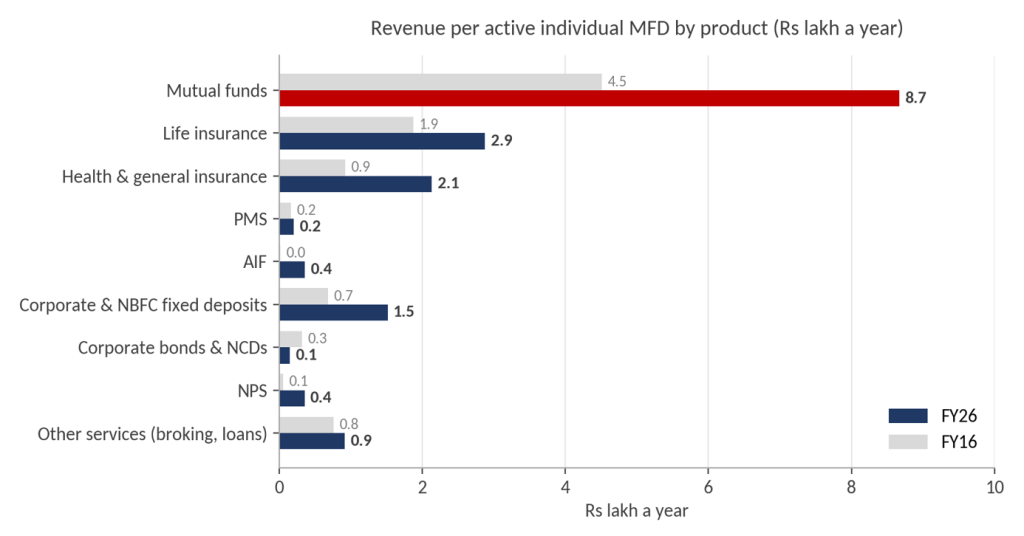
Source: Marcellus Investment Managers estimates based on AMFI, AMFI-Crisil Factbook 2026, 1 Finance analysis of AMFI commission disclosures, Cafemutual, o3 Capital, IRDAI, SEBI, RBI, PFRDA and Prudent Corporate filings. Average active individual MFD. Mutual funds net of GST. Other products anchored on the Cafemutual MFD income survey and grown with each industry: life insurance new business premium, health insurance premium, PMS assets, AIF commitments, NBFC deposits, NPS assets and nominal GDP.
Step 5: costs and take-home
Adding it all up, the average active MFD earned revenue of about Rs 17.2 lakh in FY26. Running a one-person practice with an assistant, a small office, software, travel, marketing and compliance costs her about Rs 7.7 lakh a year, which leaves her about Rs 9.5 lakh – before income tax and before paying herself for her own time. Her business needs very little capital: some equipment, a rent deposit and a month of receivables, or about Rs 6.6 lakh.
Exhibit 4: The average MFD takes home about Rs 9.5 lakh a year
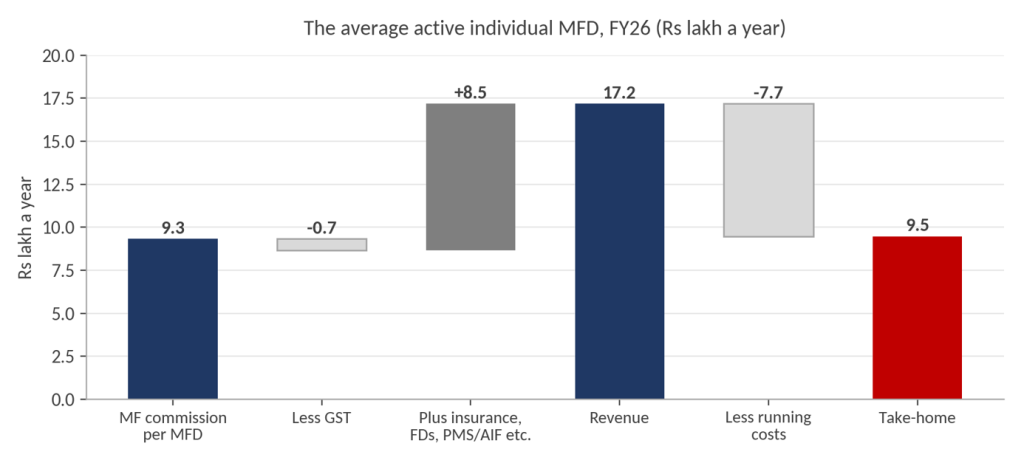
Source: Marcellus Investment Managers estimates based on AMFI, AMFI-Crisil Factbook 2026, 1 Finance analysis of AMFI commission disclosures, Cafemutual, o3 Capital, IRDAI, SEBI, RBI, PFRDA and Prudent Corporate filings. FY26. Costs are Marcellus assumptions for a one-person practice. Figures may not add up due to rounding.
Exhibit 5: The MFD math, FY16 vs FY26
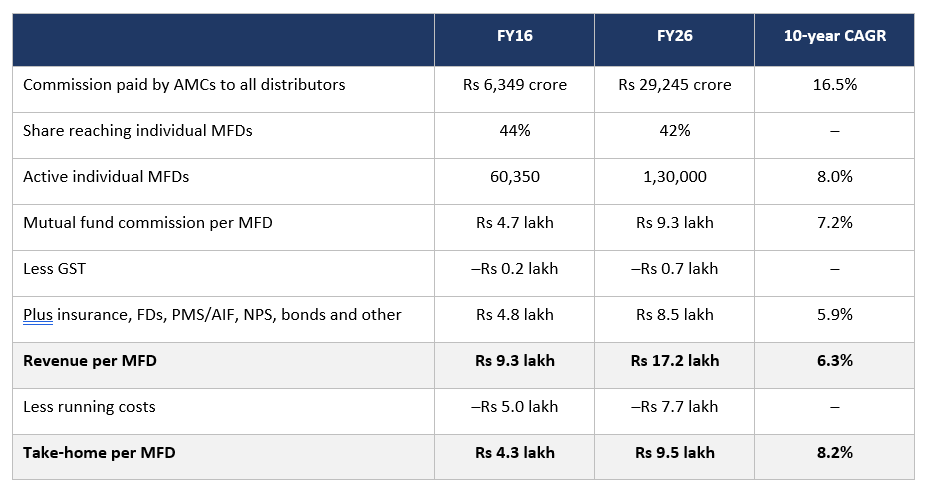
Source: Marcellus Investment Managers estimates based on AMFI, AMFI-Crisil Factbook 2026, 1 Finance analysis of AMFI commission disclosures, Cafemutual, o3 Capital, IRDAI, SEBI, RBI, PFRDA and Prudent Corporate filings. Average active individual MFD; FY16 active MFDs estimated at 85% of registered individuals; FY26 active MFDs per o3 Capital.
Why is becoming an MFD lucrative?
On the face of it, selling mutual funds is a modest business. The average MFD’s revenue has grown 6.3% a year over the decade, only a little ahead of inflation, because about 1.9 lakh new MFDs joined the profession and the commission pool was shared among many more hands. Yet three features can turn an MFD practice into a durable engine of wealth for those who stay the course.
- Your clients are your moat – and scale begets scale
An MFD is paid a trail commission for as long as her client stays invested, so each client she wins is the start of an annuity that grows with the market. The longer the relationship she holds, the stronger the bond with the client, and the less likely the client is to leave. Investors who come through a distributor stay invested for longer: about 24% of the assets in regular plans have been held for more than five years, against 14% in direct plans; for SIPs the gap is wider still, at 34% against 20%.
Exhibit 6: Clients who invest through an MFD stay invested for longer
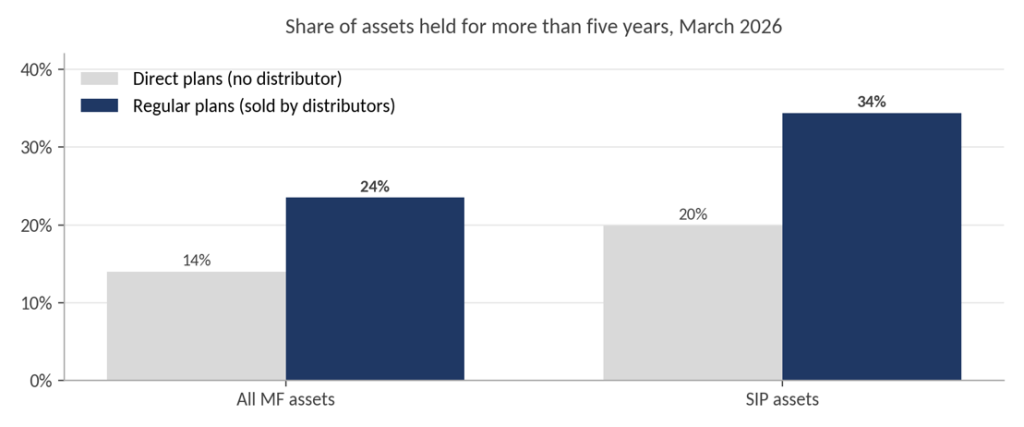
Source: AMFI-Crisil Factbook 2026. March 2026. Share of assets held for more than five years.
As a result, outcomes depend on vintage. An MFD who was active in FY16 and is still active today has grown her revenue from about Rs 10.5 lakh to Rs 31.4 lakh – 11.6% a year. The typical MFD, excluding the top ~1,500, has grown hers from Rs 9.0 lakh to Rs 13.5 lakh, or 4.1% a year, which is a decline after inflation, because most MFDs who joined in the last decade are still building their books.
Exhibit 7: An MFD who stayed the course since FY16 has grown her revenue by about 12% a year
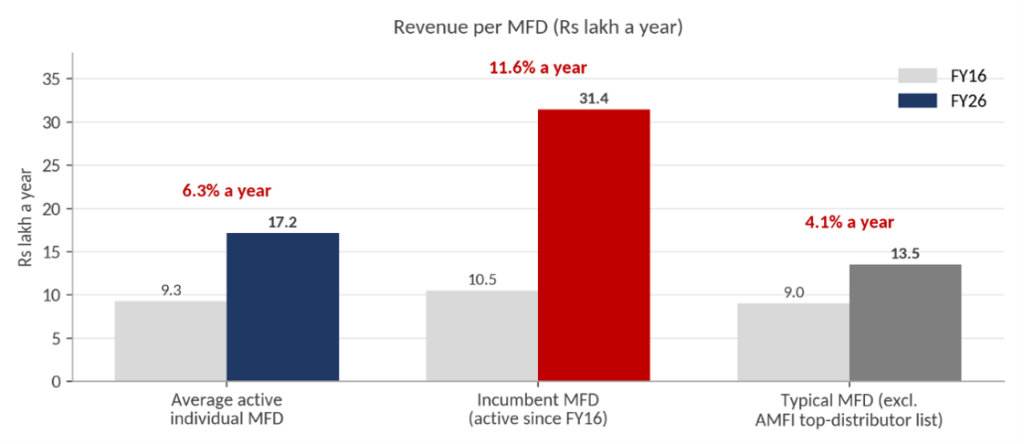
Source: Marcellus Investment Managers estimates based on AMFI, AMFI-Crisil Factbook 2026, 1 Finance analysis of AMFI commission disclosures, Cafemutual, o3 Capital, IRDAI, SEBI, RBI, PFRDA and Prudent Corporate filings. Incumbent = MFDs active in FY16 and still active in FY26 (cohort estimate); typical = excluding the ~1,500 individual MFDs on AMFI’s commission disclosure list.
In this industry scale begets scale. The ~1,500 individual MFDs who cross AMFI’s top-distributor disclosure thresholds (chiefly more than Rs. 100Cr of assets or Rs. 1Cr of commission) earned about Rs 1.8 crore each in FY25 on an average book of about Rs 190 crore. The top MFDs would comfortably sit among the 3.24 lakh Indians declaring more than Rs 1 crore of income. In fact, we estimate that the top MFDs earn as much as the Executive Directors of BSE500 companies.
Bigger books are also more profitable: a large practice runs at a profit margin of about 67% against 55% for the average MFD. And the higher rungs of the ladder are filling up fastest: the number of individual MFDs managing more than Rs 1,000 crore rose from 12 in March 2021 to 125 in March 2026, and those managing more than Rs 25 crore from 3,487 to 13,451.
Exhibit 8: The bigger the MFD, the faster that group has grown
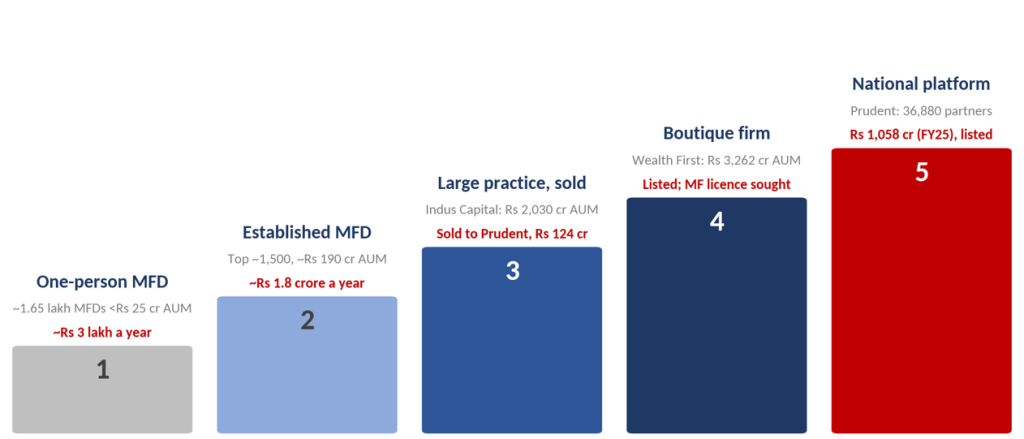
Source: IDFC MF ‘Mutual Fund Trend’ (March 2021) and Cafemutual analysis of AMFI data (March 2026), via Cafemutual. Individual MFDs by assets under management. The two sources may define assets slightly differently.
As they grow, successful MFDs turn into firms. The number of corporate MFD entities has risen from ~6,500 in FY16 to 10,790 in FY26, new corporate registrations from 368 a year to 2,372, and the number of employees registered under individual MFDs from 69 to 366 in three years. Thirty-one of India’s 100 largest distributors are now wealth boutiques set up by individual MFDs. The endgame is visible in real deals: in 2025 Prudent bought Indus Capital, a Pune sole proprietorship with about Rs 2,030 crore of assets, for about Rs 124 crore; Pune’s Sapient Finserv merged into Equirus Wealth; and Ahmedabad’s Wealth First, a listed boutique, has applied for its own mutual fund licence.
Trust is everything in this business, especially in small-town India, where an MFD is often the first person a family turns to with its savings, and where a satisfied client brings her relatives, colleagues and neighbours. That is why the business has tended to reward those already inside it.
- Selling equity is the most lucrative of all
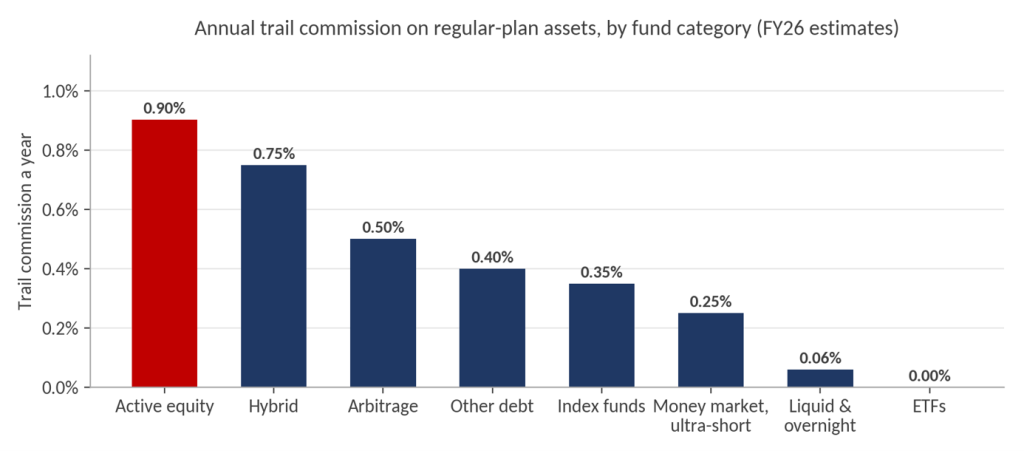
Not all products pay equally. An actively managed equity fund pays its distributor a trail of about 0.90% of assets a year, against about 0.40% for a debt fund, 0.06% for a liquid fund and nothing for an exchange-traded fund. Equity funds therefore account for about 74% of the commission pool.
Exhibit 9: Equity funds pay distributors the highest trail commission
Source: Marcellus Investment Managers estimates. FY26. Equity includes solution-oriented funds. Rates based on asset-weighted differences between regular- and direct-plan expense ratios (PrimeInvestor) and Prudent Corporate’s commission yield.
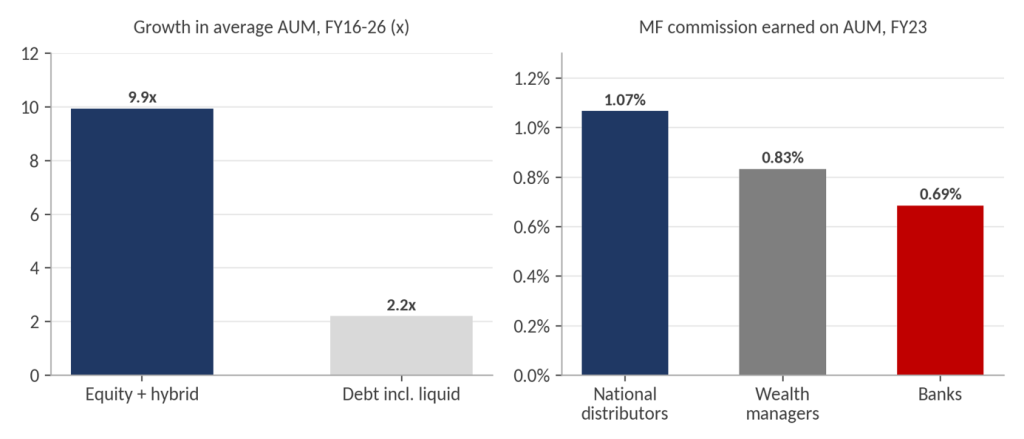
Equity has also been where the growth is: the average assets of equity and hybrid funds have grown 9.9x over the decade, against 2.2x for debt funds. Distributors who built equity-heavy SIP books have therefore earned the most per rupee: national distributors such as NJ and Prudent earned about 1.07% on their mutual fund assets in FY23, against about 0.69% for banks, whose books lean towards debt and wealthy clients.
Exhibit 10: Equity has grown fastest, and equity-focused distributors earn more per rupee
Source: Marcellus Investment Managers estimates (AMFI data); Marcellus research on Prudent Corporate (FY23 commission yields). Mention of these companies is for illustration only and is not a recommendation.
- Growth is highest in B30 towns
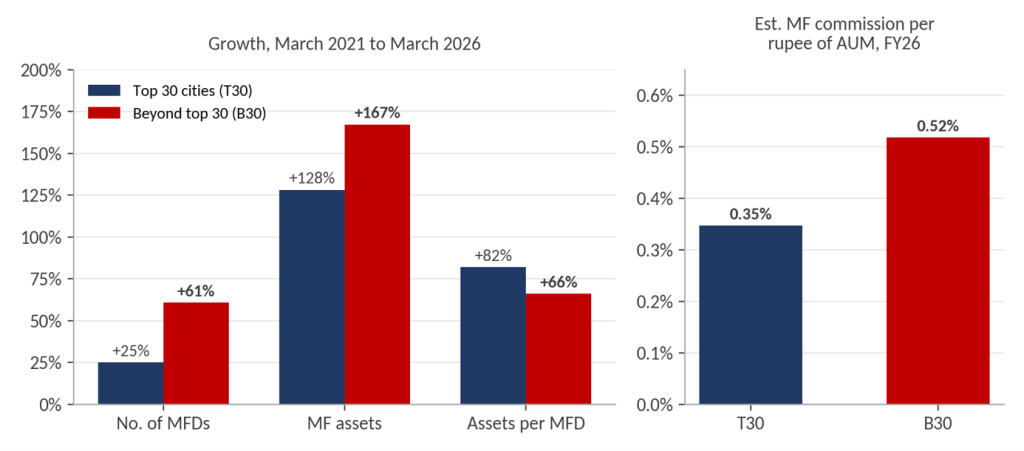
India beyond its top 30 cities (‘B30’) is the most underserved market for financial products, and it is opening up as the country gets financialised. Between March 2021 and March 2026 the number of MFDs grew 61% in B30 towns against 25% in the top 30 cities, and B30 mutual fund assets grew 167% against 128%. Small-town savers also buy more equity: about 64% of B30 assets are in equity funds, against 39% in the top 30 cities, so a B30 MFD earns about 0.52% on every rupee of assets against 0.35% for her big-city peer.
Exhibit 11: MFDs and mutual fund assets are growing fastest beyond India’s top 30 cities
Source: AMFI-Crisil Factbook 2026 (MFD counts include employees of distribution firms); Marcellus Investment Managers estimates of commission per rupee of assets, based on AMFI-Crisil asset mix by geography.
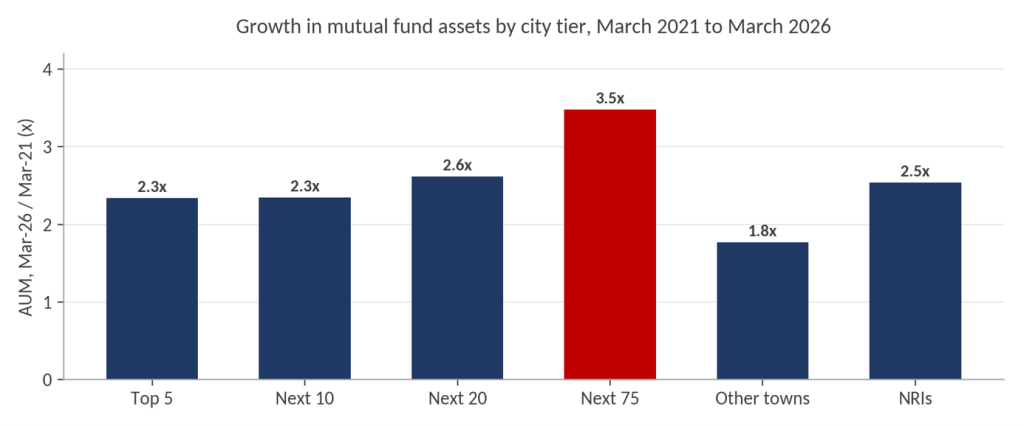
The fastest-growing tier is not the metros but the next 75 cities, where mutual fund assets grew 3.5x over the last five years. Even among India’s top-100 individual MFDs, those in tier-2 and tier-3 towns – from Siliguri and Agra to Korba and Navsari – grew their assets by about 32% in FY25, against about 25% for those in the five largest metros.
Exhibit 12: Mutual fund assets have grown fastest in India’s next 75 cities
Source: AMFI-Crisil Factbook 2026. Growth in assets under management, March 2021 to March 2026. AMFI revised its city classification in March 2026, which may affect the ‘other towns’ category.
Even though big-city MFDs still manage much bigger books – about Rs 33 crore per MFD against Rs 8.6 crore in B30 – and have grown them faster, we believe that as India financialises and the new kings and queens of small-town India rise, the growth in MFDs’ fortunes there could be equally strong.
India: an MFD in every district, a client book in every family
The decade of 11% a year growth in Indian equities has created wealth well beyond the stock market. A large part of it has flowed to India’s 1.30 lakh active individual MFDs – many of them in India’s smaller towns – who together earned about Rs 12,138 crore of mutual fund commission in FY26, and as much again from insurance, deposits and other products. The model rewards those with patience, trust and an equity-heavy client book, and it is unforgiving to the sub-scale newcomer. In that sense, the MFD’s client book is a quintessential tentacle of the small-town ‘Octopus’ we described in Behold the Leviathan: built on national products, run on local trust, and with the potential to compound year after year.
Through extensive travel and meetings with distributors, bankers, local businesses and listed companies, we at Marcellus seek to keep abreast of a rapidly changing country. You can participate in our endeavour by investing with us. If you would like to learn more about our investment approach, which focuses on companies we assess to be clean and well-managed, please visit invest.marcellus.in# or scan the QR code below.

# This tool is designed to help users explore products and asset allocation guidance; it does not constitute a formal financial plan or investment advice.
Click Here for details about our regulatory registration and licensing information.
The stocks mentioned above may form part of Marcellus’ portfolio. Marcellus, its clients, and/or its employees may therefore have an interest in the said stock(s). Note: the above material is neither investment research, nor investment advice. Marcellus does not seek payment for this material/email in any shape or form. Marcellus Investment Managers Private Limited (“Marcellus”) is regulated by the Securities and Exchange Board of India (“SEBI”) as a provider of Portfolio Management Services (SEBI PMS Registration No. [INP●]). Marcellus is also a US Securities & Exchange Commission (“US SEC”) registered Investment Advisor (SEC File No. [801-●]) and is regulated by the International Financial Services Centres Authority (IFSCA) as a Fund Management Entity (IFSCA Registration No. [●]). Registration with SEBI, the US SEC or IFSCA does not imply a certain level of skill or training, nor does it guarantee performance. No content of this publication including the performance related information is verified by SEBI, IFSCA or US SEC. If any recipient or reader of this material is based outside India and USA, please note that Marcellus may not be regulated in such jurisdiction and this material is not a solicitation to use Marcellus’s services. The PMS strategy, Category III AIF products and IFSCA retail schemes are distinct offerings with different regulatory frameworks, risk profiles, fee structures and investment thresholds. Investors should refer to product-specific documents for details before investing. All recipients of this material must, before dealing and or transacting in any of the products and services referred to in this material, make their own investigation and seek appropriate professional advice. Investments in securities market are subject to market risks. Read all the related documents carefully before investing. Past performance is not indicative of future results. Marcellus and/or its associates, the authors of this material (including their relatives) may have financial interest by way of investments in the companies covered in this material. Marcellus does not receive compensation from the companies for their coverage in this material. This material may contain confidential or proprietary information and user shall take prior written consent from Marcellus before any reproduction in any form. Investments in securities markets are subject to market risks and there is no assurance that any investment objective will be achieved. As per SEBI Master Circular for Portfolio Managers dated July 16, 2025 (Clause 2.3), clients have an option to be on-boarded directly by the Portfolio Manager without intermediation of persons engaged in distribution services.