OVERVIEW
POPULAR ARTICLES

Even as the conventional tax-paying middle class gets crushed economically in India, the number of individuals declaring more than Rs 1 crore of income has risen about seven-fold in twelve years to 3.24 lakh, and the number of listed companies earning Rs 50–500 crore of annual profit has almost doubled since FY10 – with the entire increase coming from independent promoters rather than India’s established business houses. Company-level data for over 35,000 listed and unlisted companies tells the same story: companies earning US$6–60mn (roughly Rs 50–500 crore) of PAT more than doubled in number between FY15 and FY25, grew aggregated profits faster than India’s largest companies, and nearly one in five of them has since seen their PAT surpass around Rs 500 crores. This new class owes little to India’s education system and much to local dominance. To see what this class looks like, we travelled 100 km north of Mumbai to Boisar, where the Adhikari family has grown from a building-materials supplier in 1989 into conglomerate spanning hospitals, construction, logistics, a school and fuel retail – the quintessential ‘Octopus’. As we begin a new series mapping the new rulers of India, please visit invest.marcellus.in to learn more about our investment offerings that are in tandem with a rapidly-changing India.
The middle class: running harder to stand still
In Breakpoint (March 2026), and in our blog India’s Middle Class is Losing Ground to the Rich & the Poor, we used a decade of income tax data to show that the Indian middle class has stalled economically. Taxpayers earning Rs 5 lakh to Rs 1 crore a year – 53% of those filing non-negative returns in 2023-24 – saw their average income move from Rs 10.23 lakh in 2012-13 to just Rs 10.69 lakh in 2023-24, a compound annual growth of 0.4%.
Adjusted for inflation, the picture is starker still. Consumer prices rose about 80% between FY13 and FY24, which means that the average income of taxpayers in this band is now worth about 42% less in real terms than it was a decade ago (because the band is defined in nominal rupees, this partly reflects changes over time in who falls within it. In FY13 rupees, the Rs 10.69 lakh earned in FY24 buys what Rs 5.95 lakh did then.
Exhibit 1: Middle-class incomes have barely moved in nominal terms – and have collapsed in real terms
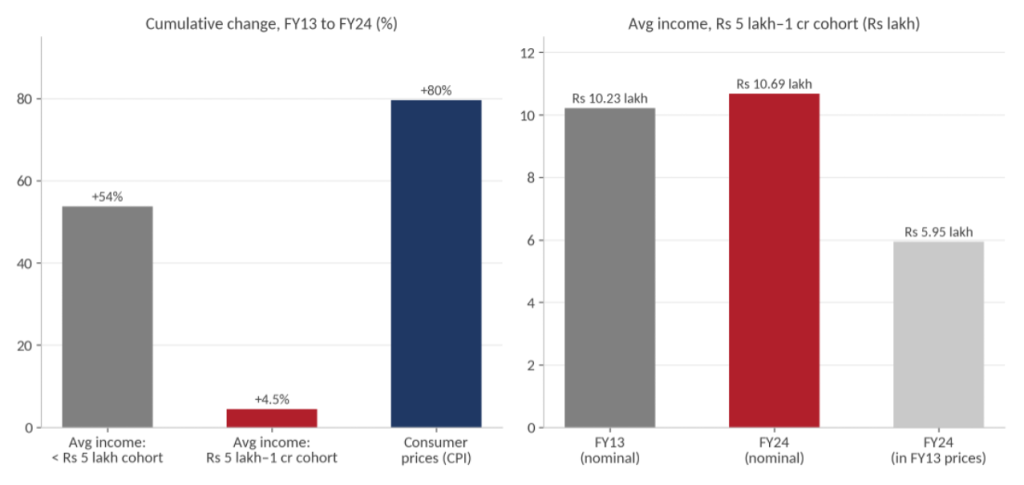
Source: Marcellus Investment Managers; Income Tax Department data as analysed in India’s Middle Class is Losing Ground to the Rich & the Poor and Breakpoint (2026); MOSPI CPI (combined, base 2012=100) via LSEG. FY13 and FY24 refer to the 2012-13 and 2023-24 income years. CPI change is based on fiscal-year average index levels; real income is the FY24 nominal average deflated by that change.
Meanwhile, a new class is quietly taking charge
Interestingly, even as the middle class struggles to stay afloat, a different class is thriving. In Behold the Leviathan (2024) we wrote about a new elite emerging from India’s interiors – people without IIT, IIM or foreign degrees, for whom pedigree matters far less than it did for the generation before (source: Business Standard review). These are individuals who earn more than Rs 1 crore a year, or who run a cluster of small businesses that together add up to a local conglomerate. The largest among them own businesses earning anywhere between Rs 50 crore and Rs 500 crore of profit after tax (PAT) a year.
The tax data captures their rise clearly. The number of individuals declaring an income above Rs 1 crore has risen from 44,078 in AY2013-14 to just under 2.3 lakh in AY2023-24, and to 3.24 lakh in AY2025-26 – roughly a seven-fold increase in twelve years. At the very top, the number of individuals declaring more than Rs 100 crore has quadrupled from 142 to 576 in just four years (source: Ministry of Finance reply in Parliament, July 2026, via OfficeChai).
Exhibit 2: India’s crorepati class has grown about seven-fold in a dozen years
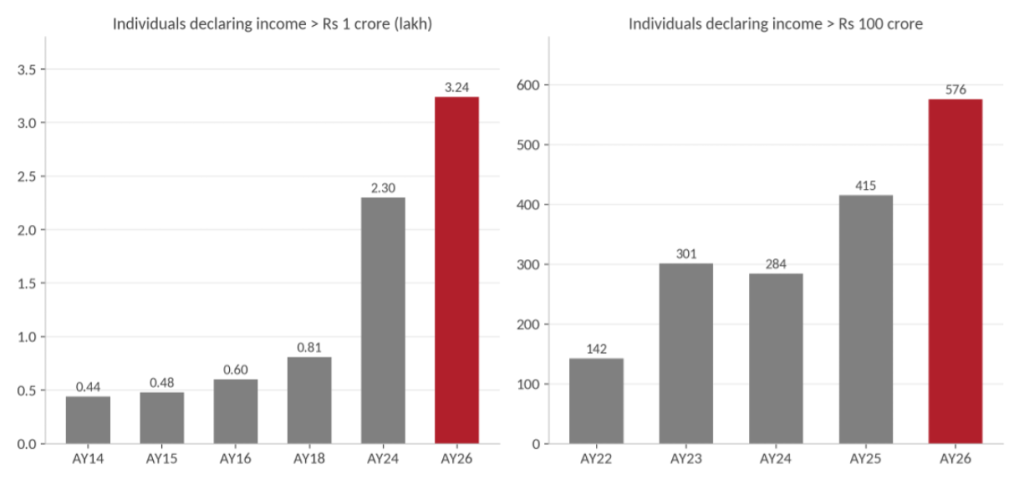
Source: Marcellus Investment Managers; CBDT (AY2014-15 to AY2017-18; AY2015-16 via Business Standard); Government data via Business Today (AY2013-14: 44,078; AY2023-24: just under 2.3 lakh); Ministry of Finance reply in Parliament, July 2026, via OfficeChai (AY2025-26 and the Rs 100 crore series). AY = assessment year; AY2025-26 corresponds to income earned in FY25. Years not shown were not available on a consistent basis.
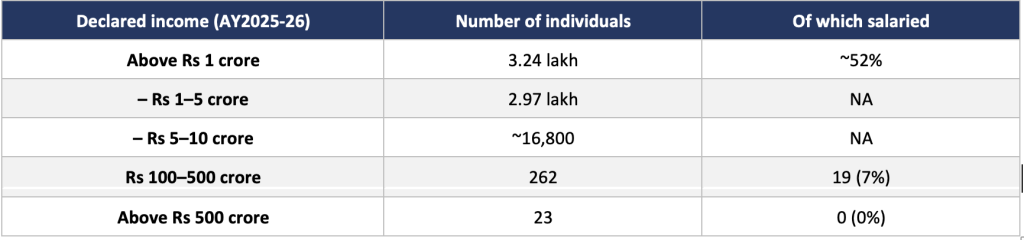
And crucially, this is not a class of salaried executives. While about 52% of all those declaring more than Rs 1 crore are salaried – many of them senior corporate and start-up employees – the share collapses as one goes up the ladder. Of the 262 individuals declaring Rs 100–500 crore, only 19 draw a salary; of the 23 declaring more than Rs 500 crore, none do. The top of India’s income pyramid belongs to business owners, promoters and investors.
Exhibit 3: The higher one goes, the fewer salaried people one finds
The same pattern shows up in the companies which this class builds. Using annual financial statements for about 2,000 listed companies, we counted those earning Rs 50–500 crore of PAT each year. That number has risen from 428 in FY10 to 815 in FY25. But the more revealing finding is who owns them. Companies belonging to long established business groups – the Tatas, Birlas, Kirloskars, Kalyanis and their peers – numbered 247 in FY10 and 230 in FY25 i.e. no growth at all! The entire increase has come from independent promoters with no business-group affiliation, whose count in this profit band has risen from 96 in FY10 (127 in FY14) to 497 in FY25. Of these 497, 277 listed only after April 2015. In other words, India’s mid-sized profit pool is being colonised by new families, not old ones.
Exhibit 4: The growth in mid-sized profit-makers has come entirely from independent promoters
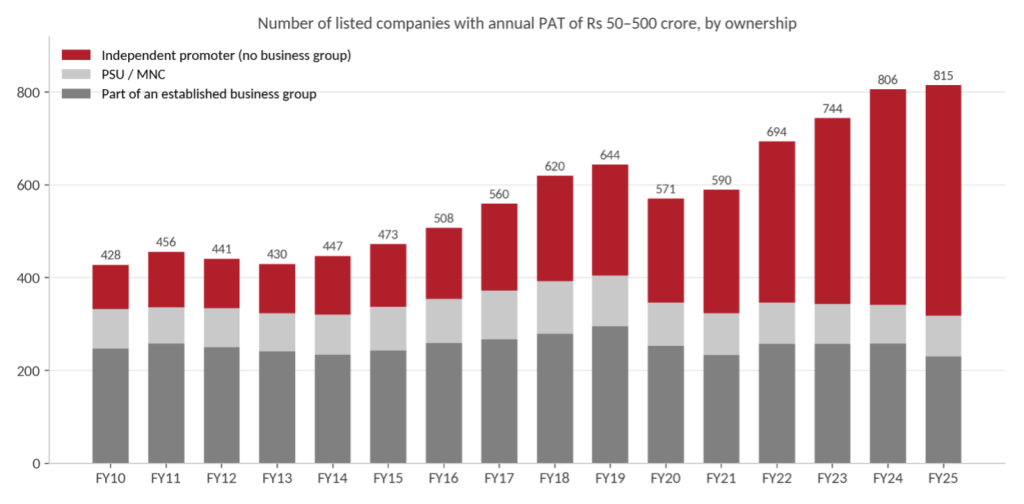
Source: Marcellus Investment Managers; ACE Equity (Accord Fintech) annual financials for March year-end companies, PAT before exceptional items, extracted from Marcellus’ research database on 12 October 2026. Ownership classification is ACE Equity’s current business-house tag (‘Private’ = independent promoter) applied to all years. FY26 is excluded because results coverage is incomplete. Listing dates are the first date of price history in our database.
These listed companies are only the visible tip of a much larger iceberg – most such enterprises are unlisted, family-owned and, as we discuss below, spread across several unrelated lines of business. For the owners of these flourishing enterprises, it matters little how much or where one is educated – a basic school education often suffices. This newly ascendant business class are increasingly the ones driving investment, hiring and consumption in India’s towns.
Analysing a decade of company-level data beyond the listed universe
To look beneath the tip of the iceberg, we analysed profit data from CMIE for more than 35K listed and unlisted companies in FY15 and FY25. We used standalone profits for banking, financial services and insurance companies and consolidated profits for the rest. We sorted the companies into three classes by PAT: ‘Rulers’ earning more than US$60mn (about Rs 507 crore in FY25), ‘Challengers’ earning US$6–60mn (about Rs 50–507 crore in FY25) and ‘Plebeians’ earning less than that. The Challenger band is, in effect, the Rs 50–500 crore PAT band in which the enterprises of India’s newly ascendant business class sit. Each company is tagged with its FY15 class and followed through to FY25, so that a Challenger which grew into a Ruler still counts as a Challenger when we measure that cohort’s growth.
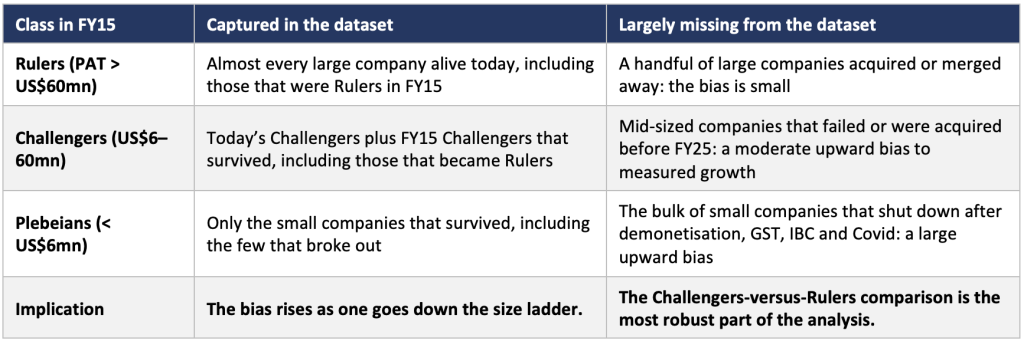
One caveat is essential. The dataset is built from the companies that exist in the database as of FY25, with their history filled backwards to FY15. Companies that shut down, were struck off or were merged away before FY25 are therefore largely missing. Our FY15 cohorts are thus made up of companies that, by and large, survived the decade, which flatters the growth measured in this blog. There is no clean way around this, as a complete list of companies alive in FY15 – including those that later died – with comparable financials is sadly not available.
Exhibit 5: What the FY25-based dataset captures – and what it misses
However, even among the survivors, the state of the Plebians is not a happy one. Half of the companies that were Plebeians in FY15 were either loss-making in FY25 or had no FY25 profit in the database (because they had merged, gone dormant or not filed), compared with a quarter of the FY15 Challengers and a sixth of the FY15 Rulers. Since companies that died before FY25 are not in the data at all, the true attrition among small companies is higher still. In short, India is a really difficult country in which to run a small business.
Exhibit 6: The lower the PAT, the greater the economic hammering – even among survivors
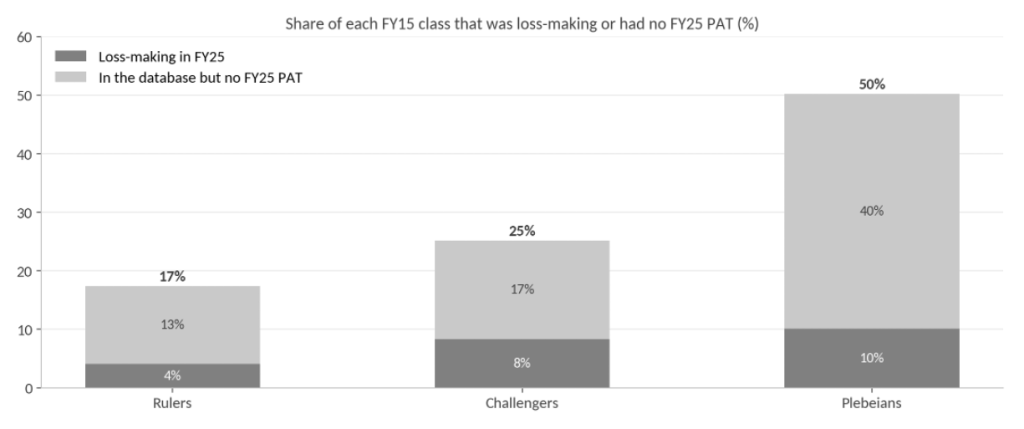
Source: Marcellus Investment Managers; CMIE (sourced from IIFL Capital). Reported PAT; standalone figures for banking, financial services and insurance companies, consolidated for all others (standalone where consolidated figures are unavailable). Size classes use US$ thresholds converted at average exchange rates of about Rs 61.2/US$ (FY15) and Rs 84.6/US$ (FY25). The dataset covers companies in the database as of FY25 with their history back-filled, and is therefore subject to survivorship bias.
With that caveat in mind, three findings stand out. First, the Challengers have outgrown the Rulers. Companies that were Challengers in FY15 grew their aggregate profits at 12.9% a year over the next decade, against 11.4% for those that were Rulers; excluding BFSI companies, the gap widens to 12.3% versus 9.7%. The result holds if we use a fixed Rs 50–500 crore band instead of dollar thresholds (12.4% vs 11.4%). Second, their numbers have more than doubled: there were 1,522 Challengers in FY15 and 3,414 in FY25. Measured by aggregate profits and by their numbers, the Rs 50–500 crore PAT companies are flourishing in modern India.
Exhibit 7: Challengers have grown profits faster than Rulers over FY15–25
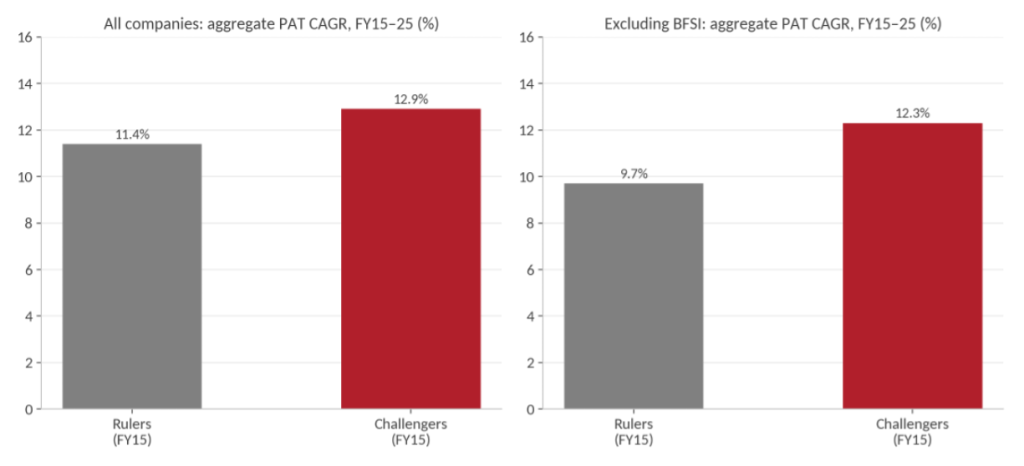
Source: Marcellus Investment Managers; CMIE (sourced from IIFL Capital). See the notes to Exhibit 6 for the PAT basis, thresholds and survivorship bias. Cohort CAGR = growth in the aggregate PAT of companies in that class in FY15 that also have FY25 PAT.
Third, the Challengers are storming the top league. Of the 1,522 Challengers of FY15, 268 – or 18% – are Rulers today. Furthermore, only 29% of FY25’s 738 Rulers were Rulers a decade ago implying that 71% of the corporates earning PAT above Rs 500 cr today were ‘Challengers’ a decade ago.
While the largest source of new Rulers is the FY15 Challenger cohort, the growth, however, is concentrated: the median Challenger’s profit grew 2.2 times over the decade, and the top tenth of Challengers accounts for two-thirds of the cohort’s entire increase in profits. This is a contest in which the fittest win big, not a rising tide that lifts all boats and hence it is difficult to interpret the rise of the Challengers as broad based democraticisation of wealth. This is precisely why the winners are accumulating the wealth, and the local clout, that define the new class.
Exhibit 8: Seven in ten of today’s Rulers were not Rulers a decade ago
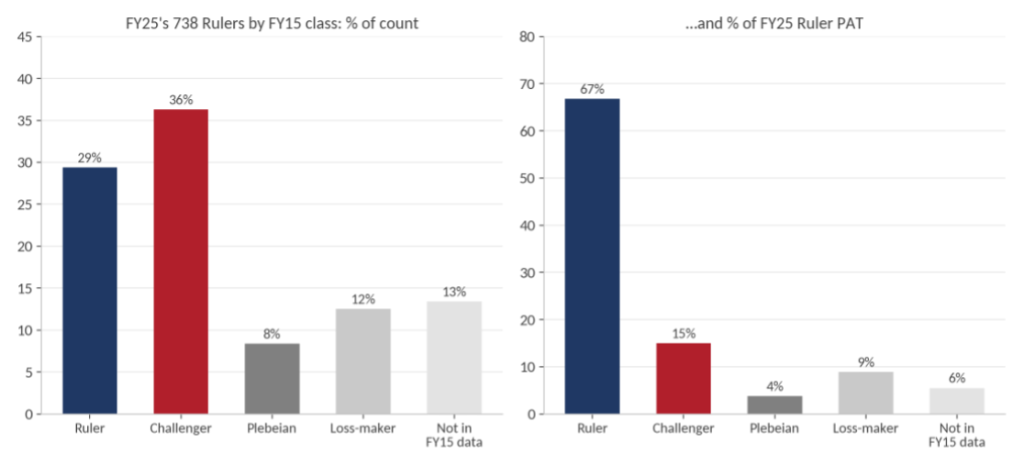
Source: Marcellus Investment Managers; CMIE (sourced from IIFL Capital). See the notes to Exhibit 6 for the PAT basis, thresholds and survivorship bias. “Not in FY15 data” = companies without FY15 PAT in the dataset, e.g., companies incorporated or demerged after FY15.
Who are they, where are they, and where do they come from?
Who constitutes this new class? Where in India are they concentrated? And what socio-economic backgrounds do they come from? These are difficult questions and we will invest several months trying to get to the bottom of this. Tax data tells us how much these people earn but not who they are. Corporate databases capture only the small fraction that list. Household surveys rarely reach the top of the distribution. In the next set of blogs that we publish, we will try to identify this class – or, more accurately, the many sub-classes within it – that are beginning to make their mark on India’s economic growth.
The company-level data does offer a first clue on the ‘where’. Using the registered-office addresses of these companies, the number of Challengers based outside India’s seven largest metropolitan regions grew 2.7 times between FY15 and FY25, against 2.1 times within them, lifting their share from 26% to 30%. Within Maharashtra, the number of Challengers registered in the Mumbai region grew 1.7 times, while in Pune it grew 2.5 times and in the rest of the state 2.7 times (albeit from a small base). The new class is spreading outside of India’s traditional corporate centres and into its hinterland.
Exhibit 9: Challengers are multiplying fastest away from the big metros
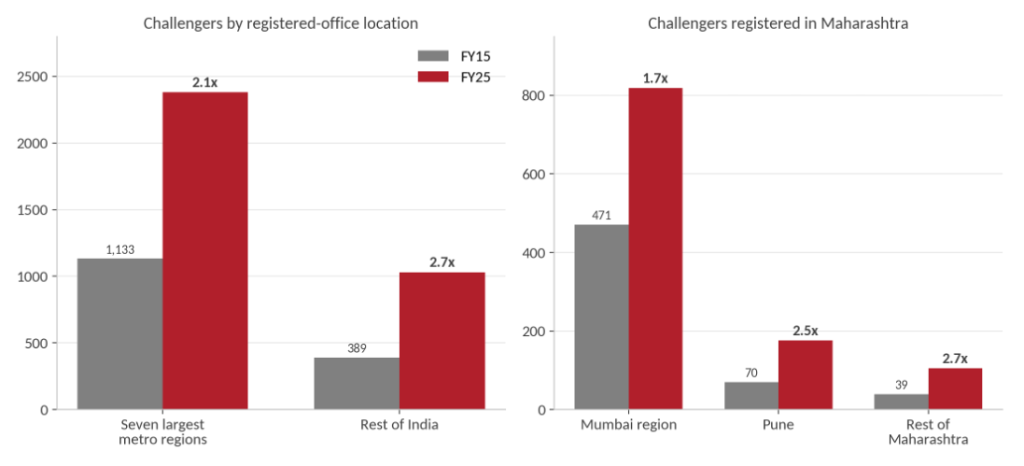
Source: Marcellus Investment Managers; CMIE (sourced from IIFL Capital). See the notes to Exhibit 6 for the PAT basis, thresholds and survivorship bias. Location is classified by keywords in the registered and head office addresses. Seven largest metropolitan regions = Mumbai (including Thane and Navi Mumbai), Delhi NCR (Delhi, Gurugram, Noida), Bengaluru, Chennai, Kolkata and Hyderabad; companies with offices in more than one location are counted as metro. Rest of Maharashtra excludes Mumbai region and Pune.
You don’t have to travel far: the Adhikaris of Boisar
To get a sense of what this class looks like, you don’t need to go very into India’s hinterland. Take the Western Railway line about 100 km north of Mumbai and you reach Boisar, a small industrial town in Palghar, Maharashtra’s northernmost coastal district, which borders Gujarat. Boisar is the residential hub for the Tarapur MIDC industrial estate – set up in 1972 and home to more than 1,000 chemical, pharmaceutical, steel and textile units – and for India’s first nuclear power station at Tarapur. It is also slated to get a station on the Mumbai–Ahmedabad bullet-train corridor.
Exhibit 10: Boisar at a glance
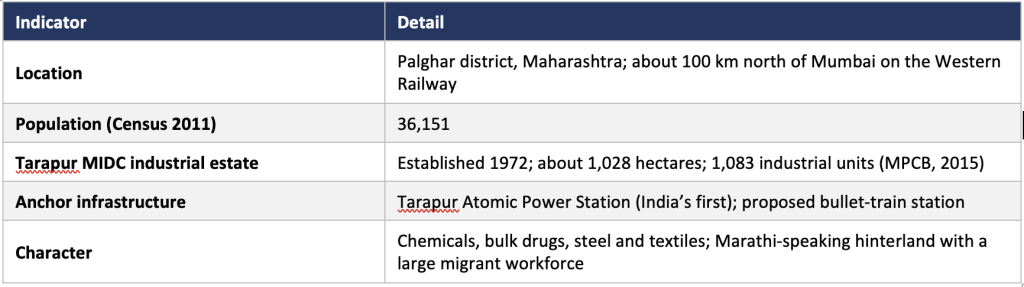
Source: Marcellus Investment Managers; MPCB CEPI presentation on Tarapur (2015); Census of India 2011 and Wikipedia (population and infrastructure).
Tarapur’s industrial estate has produced Challengers of its own. Three companies with registered offices in Boisar and Tarapur – textile maker Siyaram Silk Mills, bulk-drug maker Aarti Drugs and vinyl-flooring maker Responsive Industries – each earned between Rs 60 crore and Rs 80 crore of PAT in FY15 and between Rs 165 crore and Rs 200 crore in FY25, two to three times as much a decade later. Firms like these are the anchor customers around which a local business ecosystem grows.
Exhibit 11: Boisar’s own Challengers have doubled or tripled their profits
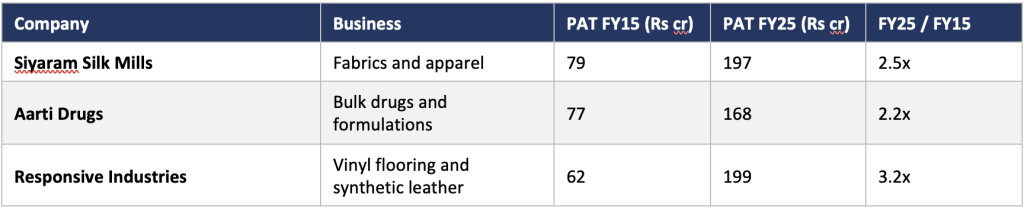
Source: Marcellus Investment Managers; CMIE (consolidated reported PAT where available, otherwise standalone)- sourced from IIFL Capital. Registered offices: MIDC Tarapur (Siyaram Silk Mills, Aarti Drugs) and Betegaon, Boisar East (Responsive Industries). Mention of these companies is for illustration only and is not a recommendation.
In Boisar, one family name is hard to miss. The Adhikaris, as they are known locally, began in 1989 under Vinod Adhikari as a supplier of building materials to the factories and construction projects that the industrial estate was drawing in (source: Adhikari Projects). A road transport business followed in 1993 (source: TradeIndia). Over time the group integrated backwards and sideways – into stone metal and artificial crush sand from its own crushers, ready-mix concrete, and a fleet of excavators, tippers and transit mixers – and counts L&T, Tata, Jindal, BARC (Bhabha Atomic Research Centre), Viraj and Siyaram’s[1] among the clients it has served. One of Adhikari’s trading entities alone, Sandhya Traders, reports annual turnover in the Rs 25–100 crore band in its GST profile (source: IndiaMART).
Over the past decade, the Adhikari conglomerate has expanded beyond construction. In 2019 the family opened Adhikari Lifeline, a multispeciality hospital at Nagzari, and followed it with a second at Betegaon in 2020, alongside a cosmetic clinic (source: Adhikari Lifeline). The Betegaon hospital lists 22 doctors and a 4.7 rating from 645 reviews on Justdial (source: Justdial). Also in 2020, the Adhikari Group set up Vidyasankul’s Sanskruti World School, a CBSE school running from nursery to Grade X, with a junior college attached (source: Sanskruti Vidyasankul). On the Boisar–Palghar state highway, an IndianOil outlet trading as Adhikari Fuel sells petrol and CNG and offers EV charging (source: IndianOil locator). Construction, logistics, healthcare, education and fuel: the family now touches almost every aspect of daily life in the town.
Exhibit 12: The Adhikari octopus – from building materials to hospitals and schools
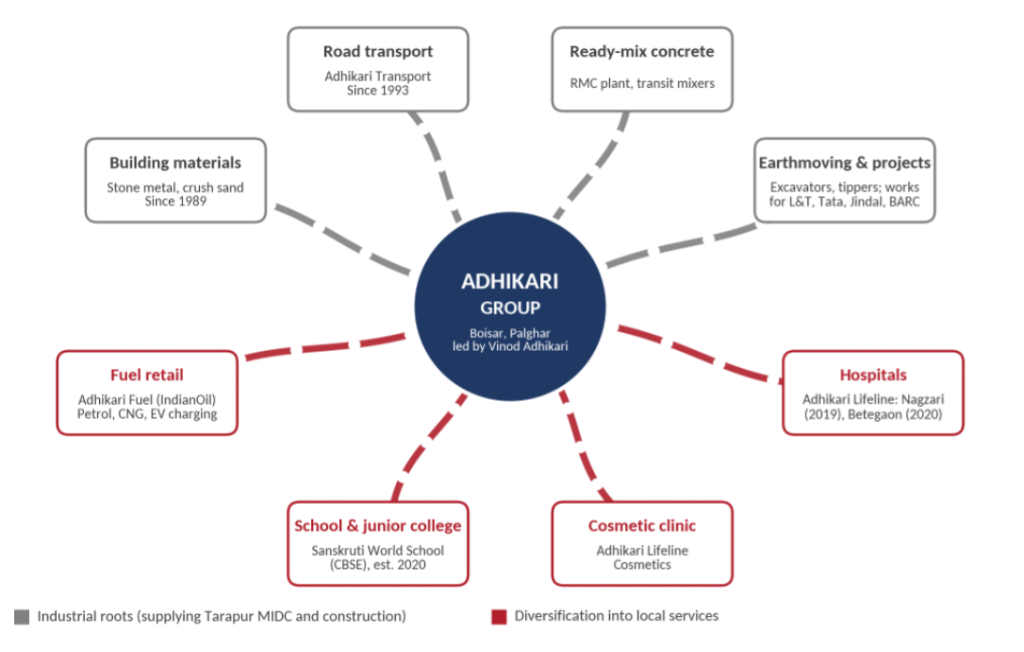
Source: Marcellus Investment Managers; company websites and listings (Adhikari Projects, Adhikari Transport, Adhikari Lifeline, Sanskruti Vidyasankul, IndiaMART, TradeIndia, IndianOil locator).
Exhibit 13: How the Adhikari Group grew its tentacles
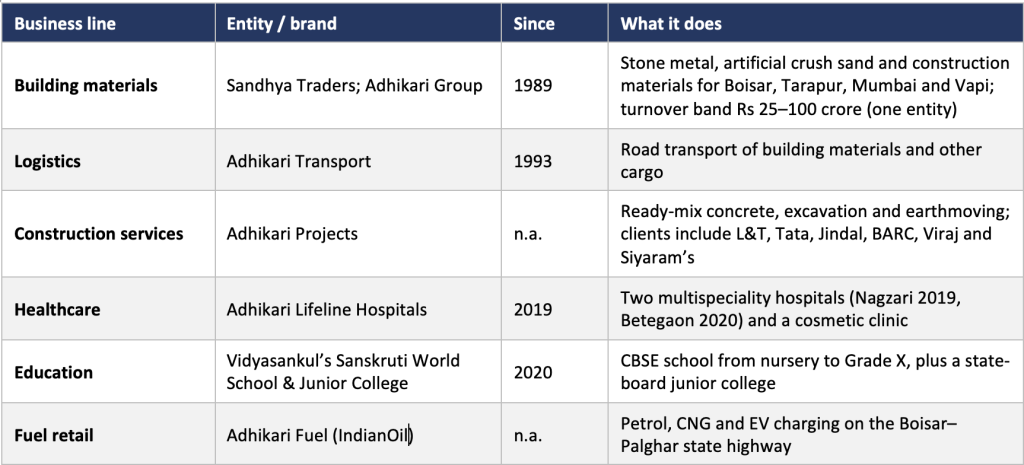
Source: Marcellus Investment Managers; IndiaMART; TradeIndia; Adhikari Projects; Adhikari Lifeline; Sanskruti Vidyasankul; IndianOil. n.a. = start year not publicly disclosed.
Exhibit 14: The family name on the town’s landmarks
 Adhikari Lifeline Hospital, Betegaon, Boisar |
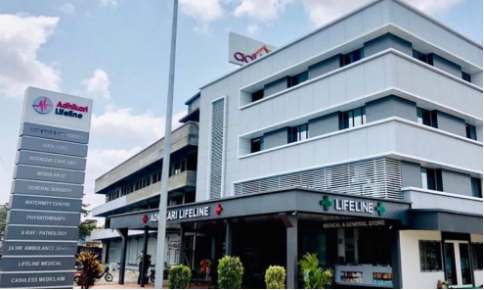 Adhikari Lifeline Hospital, Nagzari Naka, Boisar MIDC Road |
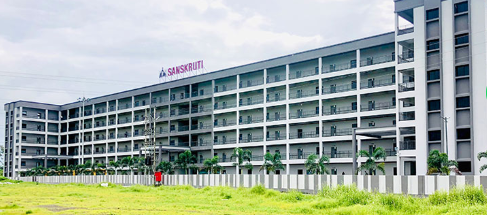 Vidyasankul’s Sanskruti World School, Boisar |
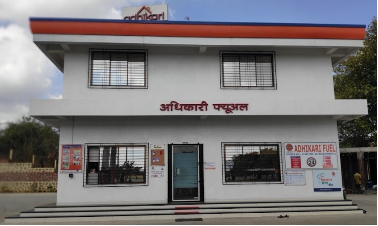 Adhikari Fuel (IndianOil), SH-32 Boisar–Palghar Road |
Source: Marcellus Investment Managers, Google images.
Over time, the Adhikaris have grown their tentacles into multiple business lines, making them the quintessential ‘Octopus’ that we had described in Behold the Leviathan (2024). The logic of the octopus is worth spelling out, because it explains why this model is so hard for outsiders to replicate:
- Each tentacle funds the next. The cash flows, land bank and equipment built up by supplying an industrial estate become the collateral and capital for the next venture. A family that already owns trucks, crushers and land is well placed to build a hospital or a school.
- Local trust is the moat. National hospital and school chains have been slow to reach towns of Boisar’s size. A family whose name is already on the town’s trucks and construction sites starts with a reservoir of recognition and goodwill that any new entrant would find hard to accumulate in a short period of time.
- The services they build are the ones the middle class prizes. Private healthcare and English-medium education are exactly what aspirational families in small-town India want for themselves and their children – categories that, as we argued in our earlier blog, could benefit as the middle class leans more heavily on the private sector for family healthcare and education. In our view, it is Increasingly the local octopus, not a listed national chain and not the government, that provides them.
India: A Million Adhikaris Now
Boisar is not unusual. The Maharashtra Industrial Development Corporation alone has developed over 200 industrial areas across the state, and every industrial cluster, district headquarters and highway town in India has its own version of the Adhikaris. We reckon there will be millions of such Adhikaris in the years to come – families who will have the means, the local power and the standing to propel their local economies forward. As the middle class that powered India’s first three decades of liberalisation stagnates, and as a newly ascendant business class powers ahead, the complexion of consumption and investment is likely to change in India. Through extensive travel characterised by plenty of meetings with government officials, bankers, local businesses and listed companies, we at Marcellus seek to keep abreast of a rapidly changing country.. You profit from our endeavour by investing with us. If you would like to learn more about our investment approach, which focuses on companies we assess to be clean and well-managed, please visit invest.marcellus.in or scan the QR code below.

# This tool is designed to help users explore products and asset allocation guidance; it does not constitute a formal financial plan or investment advice
Click Here for details about our regulatory registration and licensing information. The stocks mentioned above may form part of Marcellus’ portfolio. Marcellus, its clients, and/or its employees may therefore have an interest in the said stock(s). Note: the above material is neither investment research, nor investment advice. Marcellus does not seek payment for or business from this material/email in any shape or form. Marcellus Investment Managers Private Limited (“Marcellus”) is regulated by the Securities and Exchange Board of India (“SEBI”) as a provider of Portfolio Management Services. Marcellus is also a US Securities & Exchange Commission (“US SEC”) registered Investment Advisor and is regulated by the International Financial Services Centres Authority (IFSCA) as a Fund Management Entity. No content of this publication including the performance related information is verified by SEBI, IFSCA or US SEC. If any recipient or reader of this material is based outside India and USA, please note that Marcellus may not be regulated in such jurisdiction and this material is not a solicitation to use Marcellus’s services. The PMS strategy, Category III AIF products and IFSCA retail schemes are distinct offerings with different regulatory frameworks, risk profiles, fee structures and investment thresholds. Investors should refer to product-specific documents for details before investing. All recipients of this material must, before dealing and or transacting in any of the products and services referred to in this material, make their own investigation and seek appropriate professional advice. Investments in securities market are subject to market risks. Read all the related documents carefully before investing. Past performance is not indicative of future results. Marcellus and/or its associates, the authors of this material (including their relatives) may have financial interest by way of investments in the companies covered in this material. Marcellus does not receive compensation from the companies for their coverage in this material. This material may contain confidential or proprietary information and user shall take prior written consent from Marcellus before any reproduction in any form. Clients have an option to be on-boarded directly by the Portfolio Manager without intermediation of persons engaged in distribution services. Investments in securities markets are subject to market risks and there is no assurance that any investment objective will be achieved. As per SEBI Master Circular dated June 07, 2024, clients have an option to be on-boarded directly by the Portfolio Manager without intermediation of persons engaged in distribution services.