
Note: For all strategies except GCP, Performance data shown is net of fixed fees and expenses charged till September 30th, 2024 and is net of annual performance fees (Except for Little Champs Portfolio) charged for client accounts whose account anniversary/performance calculation date falls upto the last date of this performance period. Since, for Little Champs Portfolio, performances fees are charged on cumulative gains at the third anniversary, of the respective client account, the effect of the same has been incorporated for client accounts whose third account anniversary falls upto the last date of this performance period. Performance data is not verified either by Securities and Exchange Board of India or U.S. Securities and Exchange Commission.
*For relative performance of particular Investment Approach to other Portfolio Managers within the selected strategy, please refer https://www.apmiindia.org/apmi/WSIAConsolidateReport.htm?action=showReportMenu Under PMS Provider Name please select Marcellus Investment Managers Private Limited and select your Investment Approach Name for viewing the stated disclosure.
Note: APMI provides performance data of Portfolio Managers managing domestic strategies only. Hence, GCP is excluded.
For GCP, performance data is shown gross of taxes and net of fees & expenses charged till end of last month on client account. . Performance fees are charged annually in December. Returns more than 1 year are annualized. GCP USD returns are converted into INR using exchange rate published by RBI.
Source: https://www.rbi.org.in/scripts/ReferenceRateArchive.aspx
The calculation or presentation of performance results in this publication has NOT been approved or reviewed by the IFSCA or US SEC. Performance is the combined performance of RI and NRI strategies.
Consistent Compounders Portfolio (CCP)
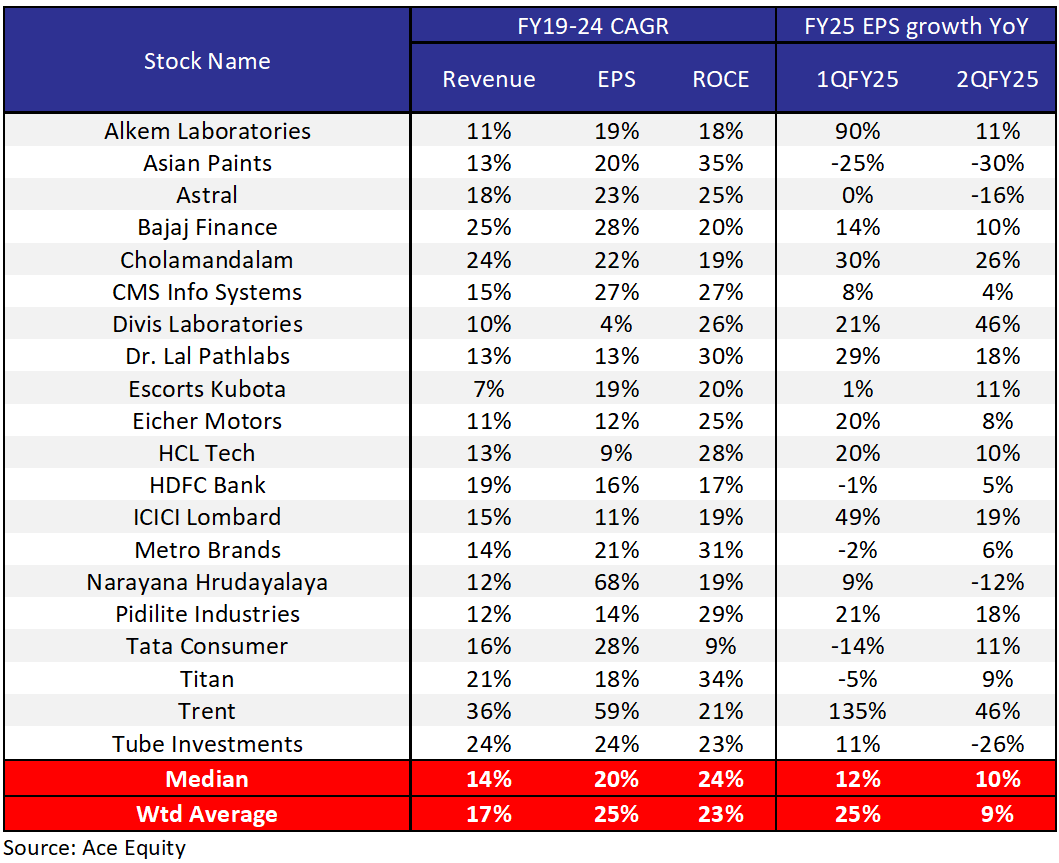
PAT growth for Nifty50 Index stands at 4% for 2QFY25 and CCP companies have outperformed the broader market on profit growth. CCP’s EPS growth was 25% YoY in Q1 and 9% in Q2 (see table below). Why is this outperformance of profit growth important? – since CCP in the long run is a relatively low churn portfolio and hence reasonably long average holding periods, profit growth is the primary driver of performance of this portfolio over the long term. In that context, it is encouraging to see the healthy profit growth here quarter after quarter, both in absolute terms as well as relative to the broader index.
In the broader economy, we see the co-existence of two polar opposite trends – on the one hand, corporate balance sheets are healthy, but on the other hand, household balance sheets seem to be under some stress, as highlighted in our recent blog on this subject (Why is the Indian Middle-Class Suffering? ). How do we see opportunities for portfolio construction in such an environment? Firstly, the width of the sectoral exposure that we have added to our quality universe over the last 12 months, gives us options to pick up high quality businesses in sectors which are not significantly exposed to the broader consumption slowdown e.g. healthcare (hospitals, pharma, diagnostics), private capex around manufacturing, exports, IT services etc. Secondly, several of our portfolio companies are implementing business initiatives that expand their target markets, add new revenue growth drivers and hence create resilience in their profits – for instance, Tube, Divis, Trent, Eicher etc. Finally, several of our portfolio companies are sitting on surplus cash piles which are likely to get utilised towards incremental organic and inorganic growth opportunities e.g. CMS, Escorts, Dr. Lal Pathlabs, Alkem etc. Companies that are going beyond their core to capture new growth initiatives – we call these ‘enterprising compounders’. We have re-oriented our portfolio towards such businesses over the last 12 months and we expect this re-orientation to generate superior earnings growth and hence portfolio performance relative to the broader markets in future.
Source: Marcellus Investment Managers
Global Compounders (GCP)
November was an eventful month, marked by the outcomes of the US elections. The Republicans secured a majority in the Senate, amplifying the potential impact of President Trump’s policies. The administration’s pro-growth agenda, supported by Congress, includes prolonging the 2017 temporary tax cuts and possibly introducing further reductions. This has led to upward revisions in GDP growth forecasts. While tax cuts and deregulation could fuel higher economic growth, some policies, such as tariffs, pose the risk of stoking inflation.
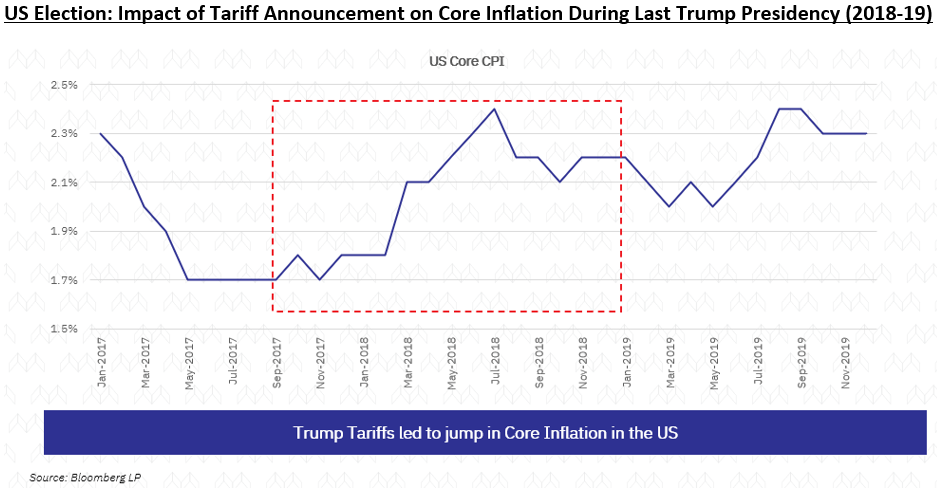
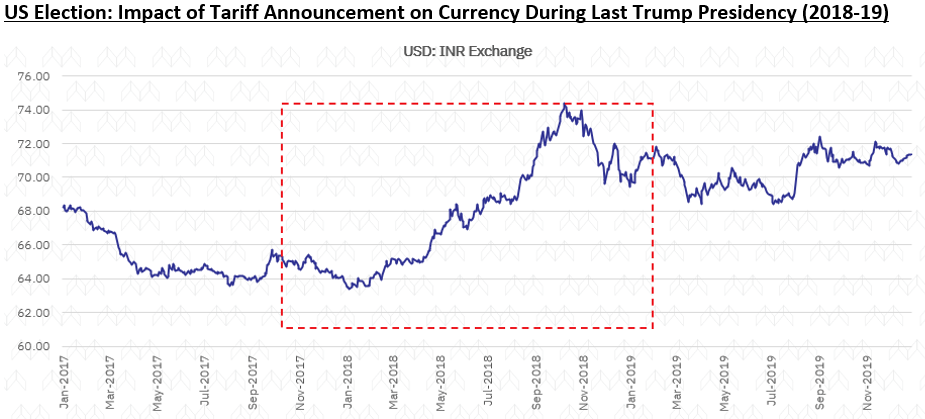
Tariff discussions are escalating, including negotiations with Canada and Mexico. The market impact will depend on how much of these tariffs are implemented. Drawing on precedents from 2017-18, inflation and currency behaviour suggest a modest rise in inflation and a strengthening USD. INR movements could follow suit.
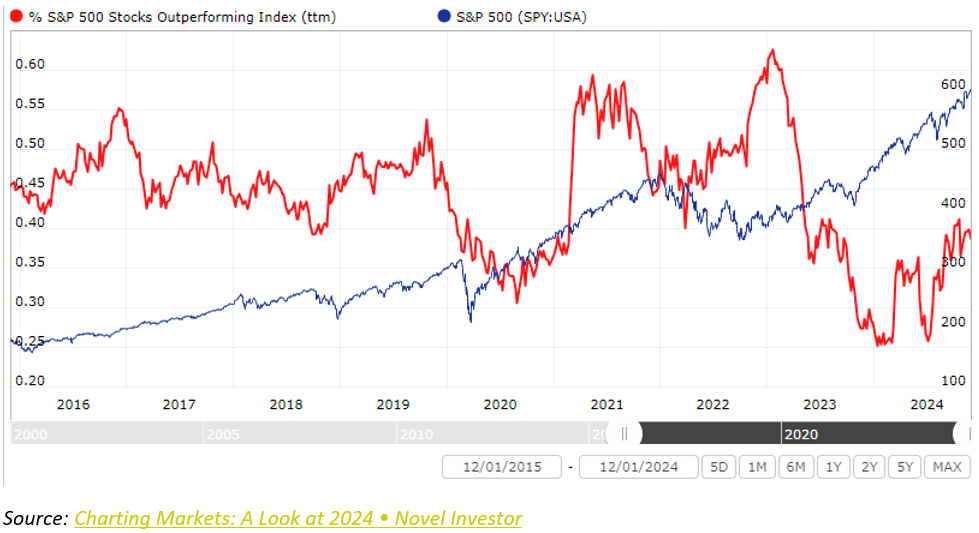
Broadly we have seen Market Broadening In Last Few Months:
Over the past six months, we’ve observed a broadening of the market, creating a favorable environment for active investing. This shift enhances opportunities to differentiate portfolios through selective stock picking.
Portfolio Commentary:
In November, the portfolio delivered a +6% return, slightly outperforming the market’s +5.8% gain. We made a few strategic adjustments to streamline holdings and enhance long-term positioning:
Exits:
We exited Applied Materials and Pool Corp, consolidating positions within the building materials and semiconductor equipment sectors.
New (small) Position Initiated: UnitedHealth: Largest health insurance provider in the US with leading position in Medicare and Commercial insurance. The company also has a leading health services franchise offering primary care, home health, pharmacy benefit manager, speciality pharmacy and data & analytics services. United Health has a long track record of smart decision making and strategic capital allocation. Vertical integration approach allowed the company to expand into healthcare services offering and strengthen its market position while avoiding regulatory scrutiny. The company’s competitive position is driven by its access to large volumes of US healthcare data, allowing for precise insurance risk assessment and underwriting as well as high-performance driven organizational culture. Primary risk is change in regulatory environment and growing scrutiny on acquisitions.
Post-election, the market has rallied, but certain subsectors remain attractively valued. A clear distinction has emerged, with the market rewarding companies delivering on earnings while penalizing those that fall short. Among underperformers, we are identifying cases where challenges are temporary, offering potential for valuation arbitrage.
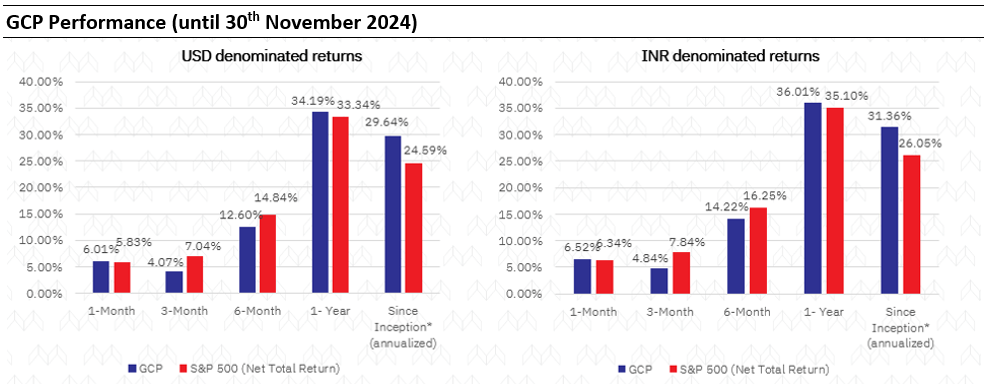
Marcellus performance data shown is gross of taxes and net of fees and expenses charged until the end of last month. Performance fees are charged annually in December. Returns for periods longer than one year are annualized. Marcellus’ GCP USD returns are converted into INR using exchange rate published by RBI. Source: https://www.rbi.org.in/scripts/ReferenceRateArchive.aspx
Since Inception’ performance calculated from 31st Oct 2022. The inception date is 31st October 2022, being the next business day after the account got funded on 28th October 2022. S&P 500 net total return is calculated by considering both capital appreciation and dividend payouts.
The calculation or presentation of performance results in this publication has NOT been approved or reviewed by the IFSCA or SEC. Performance is the combined performance of RI and NRI strategies.
Kings of Capital Portfolio (KCP)
Q2FY25 results for lenders clearly reflect that the benign asset quality environment seems to have turned around decisively. We see clear signs of stress in certain sub-segments of lending. Microfinance and low-ticket unsecured lenders have been the first casualties, whilst secured products like housing finance continue to see solid asset quality. We remain vigilant about the potential for asset quality stress to spread to other lending sub-segments, although it currently appears to be a product- or customer-segment-specific issue.
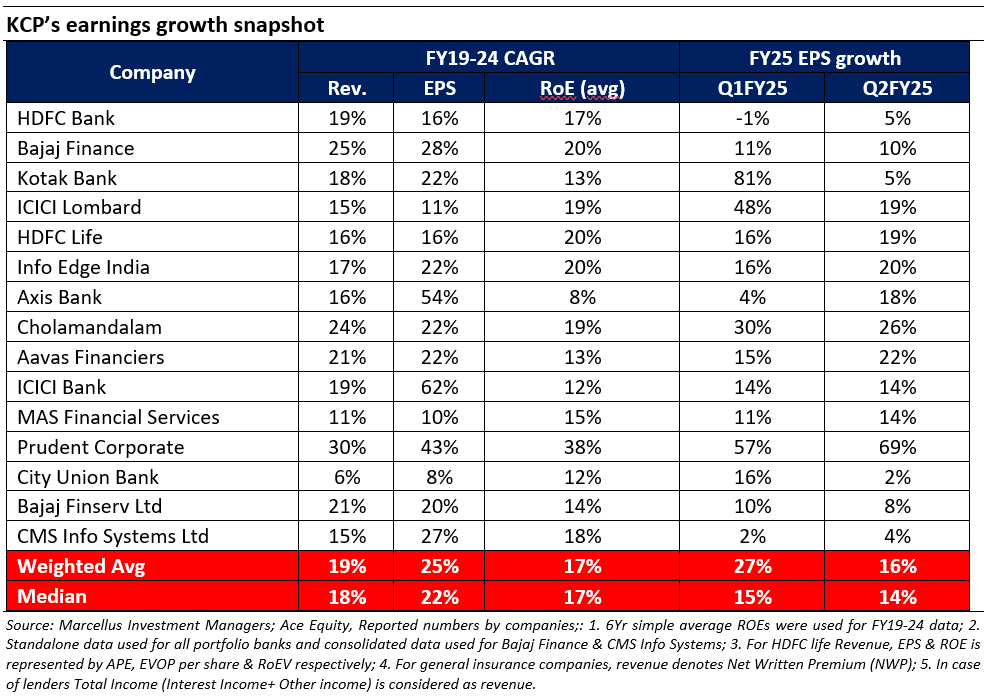
During Q2FY25, the enthusiasm for growth, particularly in retail lending, has waned as most lenders have adopted a cautious stance, a trend likely to persist in the near term. In contrast to the past three years, investors’ discussions with lenders are now largely around asset quality outcomes rather than growth or margins. We believe KCP lenders are well-positioned to benefit in such an environment, given their significantly lower stress levels compared to the broader system.
Large private sector banks and regional banks have maintained strong asset quality, even as delinquencies normalize from cyclical lows, primarily in unsecured credit. Growth calibration in large banks is aligning with the system, and we remain confident in their ability to deliver better asset quality outcomes compared to the sector. Notably, in Q2, the gross slippages ratio declined YoY for both HDFC Bank and ICICI Bank.
Within NBFCs, the pain was higher than large private banks but was well contained. In an environment when unsecured loans are seeing sharp increase in delinquencies across the system, Bajaj Finance witnessed stress creation decline in Q2 QoQ. While it is too early to draw definitive conclusions, early stress indicators suggest that Bajaj Finance’s asset quality in unsecured should turn out to be head and shoulders above the rest of the industry. We will not be surprised if some of the fringe players report large holes in their unsecured book over the next 2-4 quarters.
Also, our investments in in the insurance sector are better positioned as they are insulated from asset quality issues of the banking sector -> think flight to safety. However, the tailwinds that benefited the general insurance sector over the past 12-15 months, such as growing new motor sales and improved pricing discipline, appear to be reversing, as evidenced by declining premiums in commercial lines due to aggressive pricing. This could pose growth challenges for the general insurance sector over the next 2 quarters.
Additionally, we have reduced exposure to capital market plays given punchy valuations and a possibility of earning downgrades if equity markets continue to remain tepid. Following a run-away 20% rally in BSE 500 in H1, the index has cooled-off 5% from September end, posing risk of earnings downgrades to a segment that has been re-rated sharply by the market in the last 1 year.
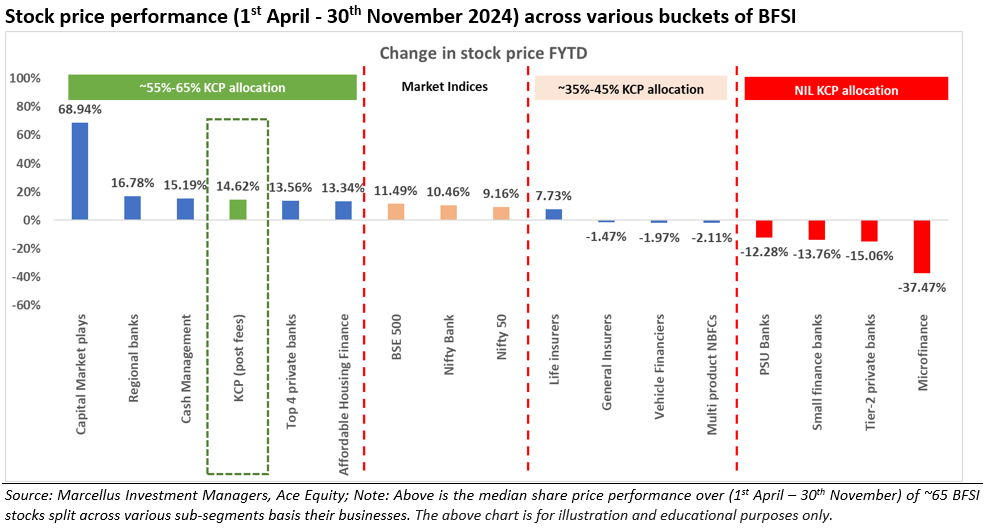
Way forward: Time and again we have witnessed during economic slowdowns, weaker lenders experience asset quality and significant stock price declines. In such times, stronger lenders not only gain market share but also get re-rated as market starts to reward certainty over mindless growth. FY25TD has been no different, and KCP’s conservative positioning in high-risk segments (NIL presence) has helped the portfolio to deliver both fundamental and share price performance materially better than the benchmark (see chart below). We continue to monitor stocks which have experienced sharp price correction and hunt for suitable opportunities, if our risk-reward framework permits.
Below chart gives a gist of the stock price drawdown across various sub-segments of the BFSI sector during FYTD. KCP’s outperformance is driven both by avoiding riskier segments (segments highlighted in red in the chart below) and selecting better quality players within each of the sub-segments. Basis our reading of the asset quality situation on ground and share price performance of the stocks, we continue to make suitable changes in the portfolio to navigate through this tough environment.
As we have been highlighting in the previous newsletters, LCP and RGP portfolios continue on their path of turnaround in performance delivering net returns of 17.66% and 22.92% respectively from April 1, 2024 to November 30, 2024. This is attributable to:
- After witnessing declining YoY earnings trend over FY24, in 2QFY25 the LCP portfolio delivered YoY earnings growth of 9% on median basis and 21% on allocation weighted basis.
- Similarly, the RGP portfolio witnessed earnings growth of 10% YoY on median basis and 14% YoY on allocation weighted basis.
- Having said that, the earnings growth could have been better but for margin pressure coming from reasons such as increased freight costs (geopolitical reasons), continued pressure on realisations/demand specially for the chemical companies (though we have reduced the exposure here significantly) and tepid demand environment for some of the portfolio stocks. The topline growth for both the portfolios exceeded the net earnings growth.
- the IRRs have come down significantly below the acceptable thresholds; and/or
- where the earnings are expected to weak for extended periods of time.
- In the LCP portfolio with an aim to create more portfolio diversity and discovery; and
- In the RGP portfolio, we have recently titled the portfolio more towards smaller market cap names where we see better valuation and scope for making higher IRRs than some of the large cap incumbents (which we have exited or trimmed positions in).
We see massive opportunities in building construction coming up over the next 3-5 years, led by multiple sub-segments, including railway station redevelopment, airport terminals, hospitals, educational institutions, private residential real estate, commercial real estate etc.
ACIL is very well placed to take advantage of these opportunities, given its pre-qualifications, bidding and execution experience and strong balance sheet. In a sector with low entry barriers, every cycle sees a churn in the key players in the market, with many old stars dying and new ones entering. However, ACIL has survived multiple cycles and for most of its history maintained pretty good ROCEs (10-year average of 24.9%) and a debt-free balance sheet, the latter being rare in this sector.
They have achieved this through:
- A conservative approach to bidding;
- Limited adventures in capital allocation; and
- Focus on execution, with a high degree of the promoters’ direct involvement.
Source: Marcellus Investment Managers, Company’s annual filings.
Key risks: Significant slippages in execution, political developments which impact Government functioning (Government accounts for significant portfolio of order book/revenues).
Exit from the Rising Giants PMS portfolio (as of November 30, 2024)
Eureka Forbes
During the course of recent channel checks on the water purifier industry in general and Eureka Forbes in particular, the investment teams came across the following challenges:
- From 2-3 players’ dominated market around 5 years back, the playing field has now expanded to about 6-8 credible players – fighting for a limited shelf space and providing a lot of options for the customers to choose from.
- A. O. Smith and PureIT (earlier part of HUL) merger can be a potent force combining the product innovations of A.O. Smith with network of PureIT.
- Retailers are now pushing their own AMC at the point of Sale which includes tying up with service providers like Onsite Go, Reliance ResQ etc. To add to the woes, we found that whilst earlier these third party service providers were sourcing critical components like filters (part of AMC) from the respective brand company (like Aquaguard), it is now also being sourced from third parties. Hence, Eureka is increasingly getting stripped off of this critical component of revenue. The only saving grace is that those customers who DON’T opt for the extended AMC (usually ~80% of total WP buyers) at the point of sale are generally tapped by Eureka at the end of 12 months of free warranty.
- Whilst the management has been taking actions to improve the service quality/experience (app, turnaround time, campaign around genuine service/filters), we continue to receive feedback regarding scope for improvement in service (eg: the turnaround time).
Additions to the Little Champs PMS portfolio (as of November 30, 2024)
Clean Science & Technology
Clean Science and Technology Ltd. (CSTL) is a leading manufacturer of chemicals for polymer, packaged food, pharma and cosmetics industry. It is the global market leader in the manufacturing of MEHQ, which is a polymerization inhibitor and also in manufacturing of BHA & Ascorbyl Palmitate which are used as antioxidants in edible oil and packaged food industries. CSTL’S advantage lies in its proprietary catalytic manufacturing processes which have alternate starting points compared to conventional processes used by peers and which have higher yields and lower waste / effluent generation. The Company has also done forward and backward integration for its core products which has allowed it to have better control on its cost structures and also to drive better value from its portfolio. In addition to the products which have global leadership (in terms of market share), CSTL has been building its product portfolio very aggressively by getting into adjacencies where the addressable market size is multi-folds larger than core products, and which are more technically complex – for instance the recent foray into Hindered Amine Light Stabilisers (HALS) where Clean is the only domestic manufacturer of the product. This provides both – greater moats and longer growth runway for the company. In the last five years, company has delivered revenue CAGR of 15% and PAT CAGR of 20% with average ROCE (pre-tax) of 43%.
Key risks: Any significant volatility in the input prices, increased competition from other Indian suppliers who are able to match or better the pricing offered by Clean Science.
Eureka Forbes
Please refer the rationale mentioned under the RGP section above.
Team Marcellus


