
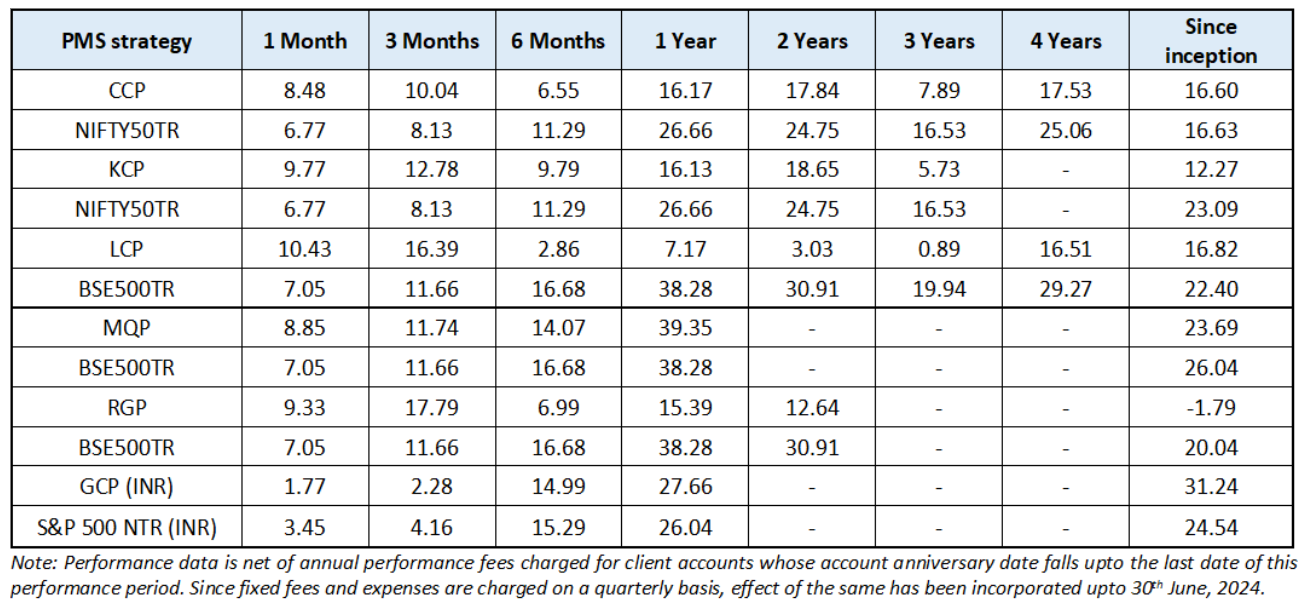
*For relative performance of particular Investment Approach to other Portfolio Managers within the selected strategy, please refer https://www.apmiindia.org/apmi/WSIAConsolidateReport.htm?action=showReportMenu Under PMS Provider Name please select Marcellus Investment Managers Private Limited and select your Investment Approach Name for viewing the stated disclosure
Consistent Compounders Portfolio (CCP)
Businesses with strong competitive advantages (and hence high ROCEs), can be categorized into different types based on their capital allocation decisions (see table below).
- Bucket 1 – ‘Cash generators’ with low reinvestment rates : These businesses are highly cash generative, at times with ROCEs exceeding 100%! They do not reinvest capital meaningfully either because of fewer avenues of growth (restricted by high market share in a slow growth industry or by competition / disruption) or because of lethargy around capital allocation. Typical examples include the likes of Colgate Palmolive or Castrol. These businesses might offer great longevity, but are expected to deliver weak profit growth in the long term. We have always avoided exposure to such deeply moated companies with low capital reinvestment rates.
- Bucket 2 – ‘Linear compounders’ – High reinvestment rate, predominantly focused towards driving growth in the core and peripheral businesses : Moats for these companies are as strong as those in Bucket 1 (‘cash generators’). These companies deliver linear business progression with capital allocation in existing core products and services driving growth through market share gains. New revenue growth initiatives for these businesses are in peripheral areas – i.e. products / geographies / customers very closely associated with the existing core business. Typically the reinvestment rate of such businesses hovers around 50% with ROCEs of 40%, thereby delivering around 20% CAGR in profits. New disruptive businesses that are seeded by these companies would typically become meaningful in their size of profits only after another 5-7 years. Until FY23, over 80% of Marcellus’ CCP portfolio had been invested in such businesses (e.g. Asian Paints, HDFC Bank, Dr. Lal Pathlabs).
- Bucket 3 – ‘Enterprising compounders’ – High reinvestment rate, significantly focused on addition of new growth drivers whilst also driving growth in their core businesses : These companies actively and consistently pursue non-core capital allocation, in addition to the strong moats and prudent core capital allocation of companies in Bucket 2 (‘linear compounders’). These ‘enterprising compounders’ incubate or invest in new businesses initiatives which are reasonably unrelated to their existing core business. The new initiatives feed off some of the competitive advantages of the core business to build differentiation. Reinvestment rates of companies in bucket 3 are 90%-100% with ROCEs of 25% typically i.e. they reinvest almost entirely, the cash generated from their existing businesses. New business initiatives are pursued in a manner such that they become significant contributors to the consolidated financials of the Bucket 3 companies (‘enterprising compounders’) over no longer than a 3-5 year time horizon. As these new business initiatives scale up, they are likely to help sustain consolidated profit CAGR above 20% – closer to 25% typically. Till FY23, no more than 15%-20% of Marcellus’ CCP portfolio (e.g. Bajaj Finance, Titan) was allocated towards such companies.
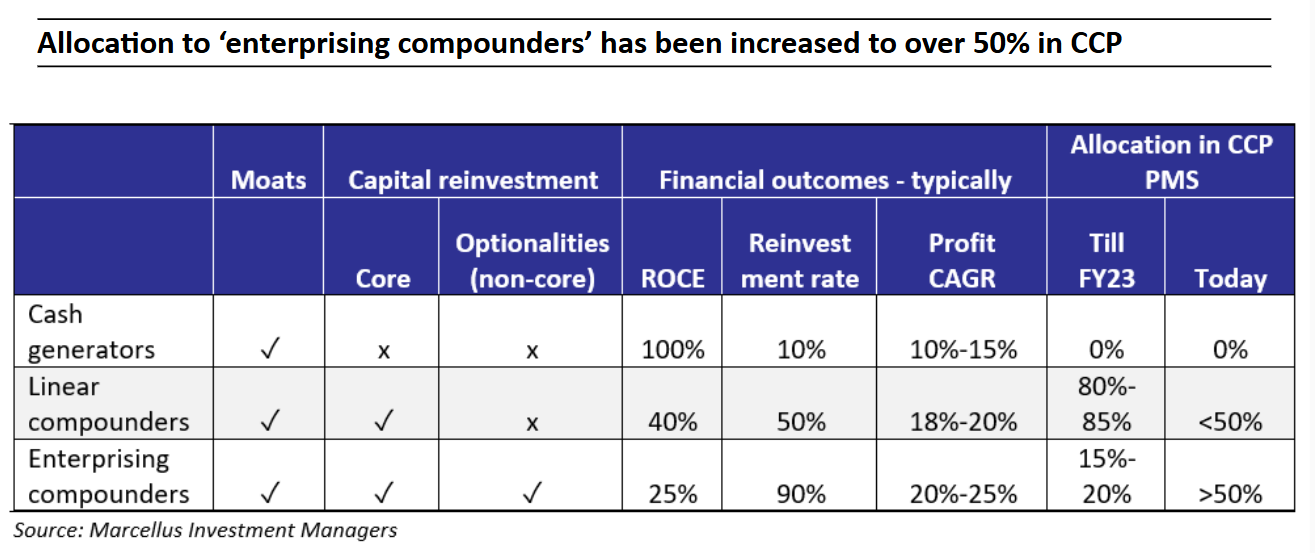
Over the past 12 months, the allocation of Marcellus’ CCP to ‘enterprising compounders’ (Bucket 3) has been increased to well above 50% (e.g. Trent, Tube), thereby leading to a change in the weighted average ROCE and reinvestment rate of the CCP portfolio from 35%-40% ROCE and 50%-55% reinvestment rate previously, to 25-30% ROCE and 80% reinvestment rate now.
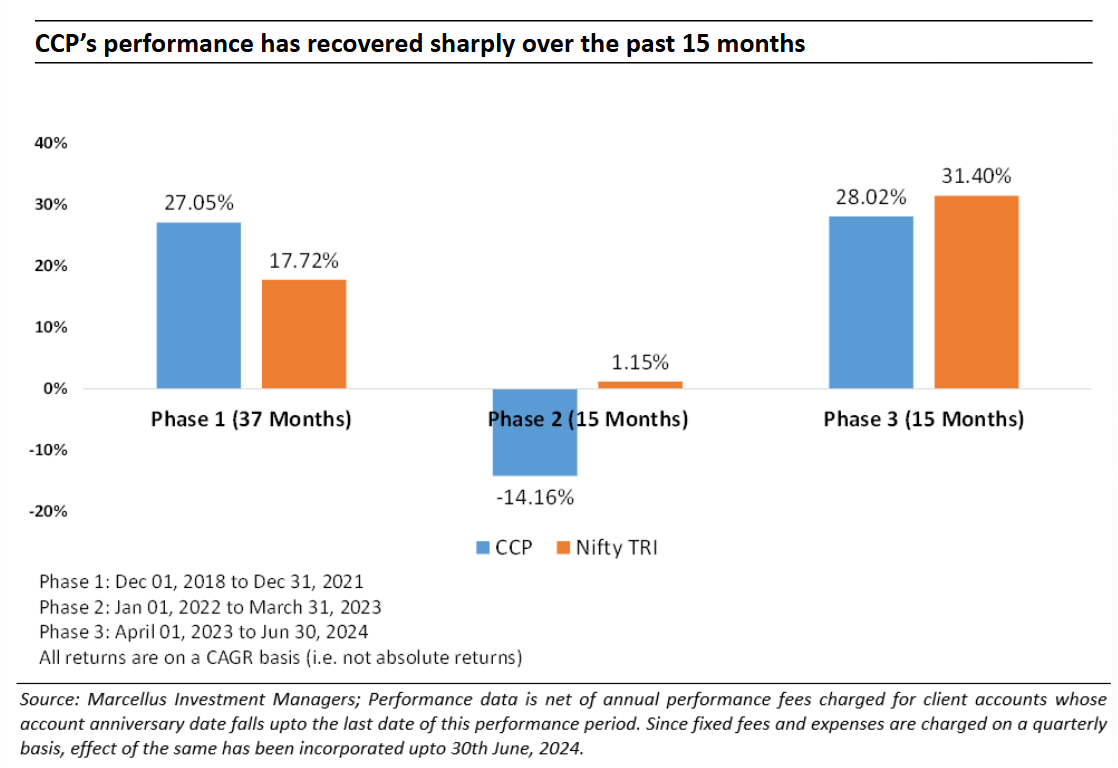
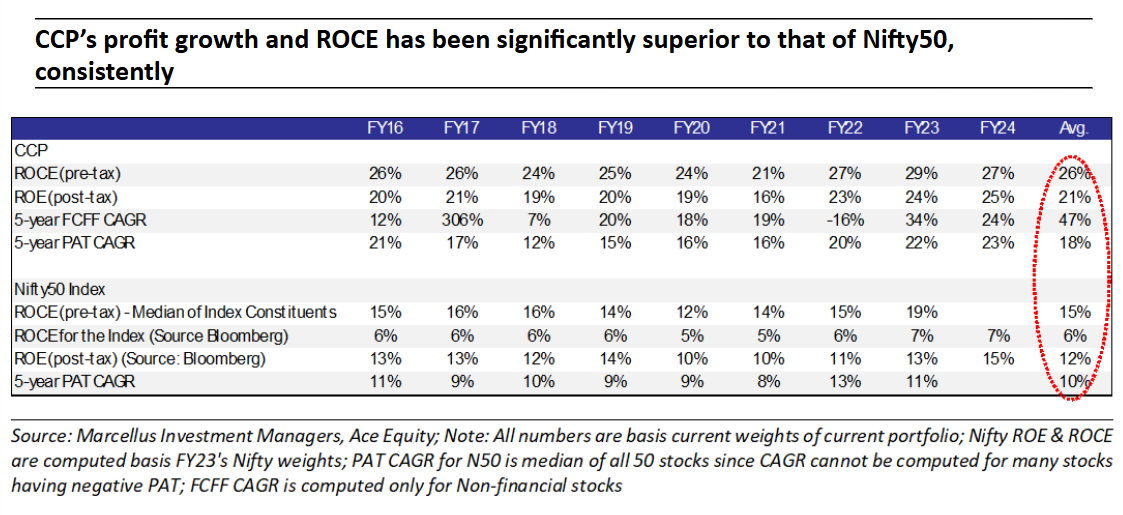
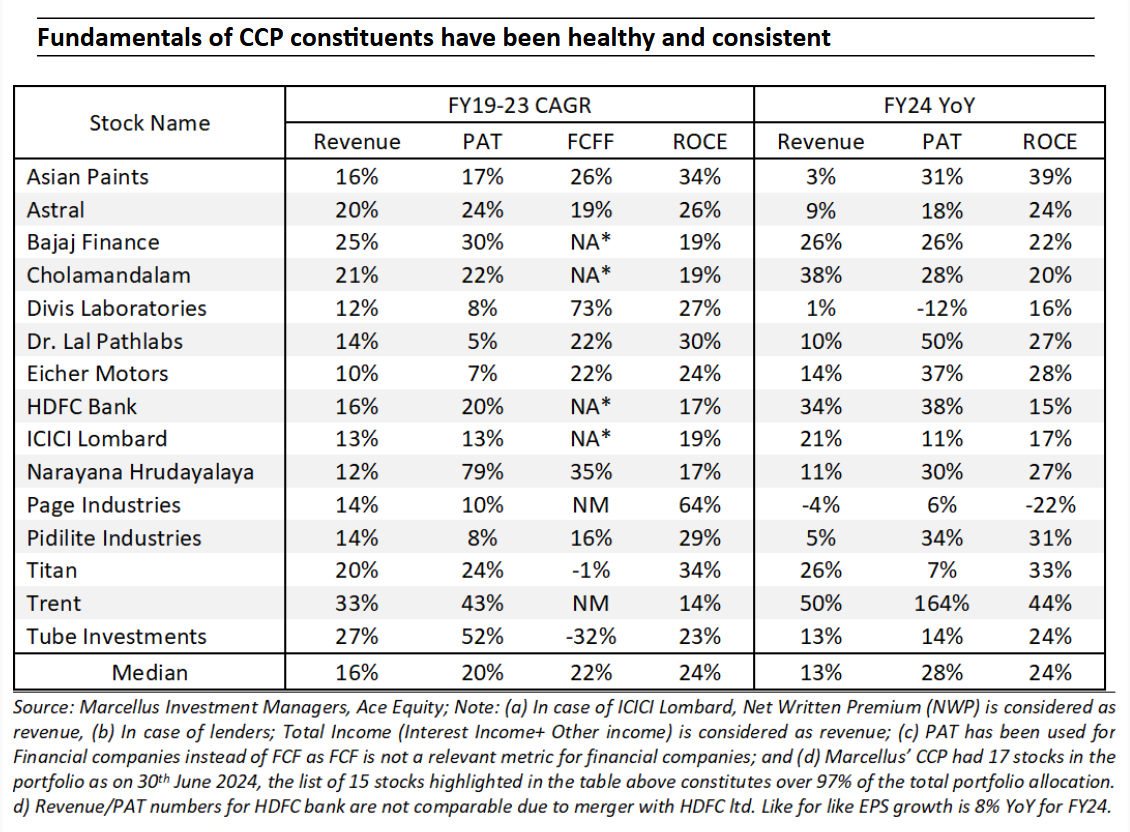
CCP continues to deliver healthy and consistent fundamentals, significantly superior to the Nifty50. With CCP’s valuation premium to the Nifty50 at a five year low, a catchup of share prices of the investee companies with their fundamentals is underway.
Why have we increased allocation of Bucket 3 (‘Enterprising Compounders’) at the expense of Bucket 2?
As highlighted in our blogs over the past year, the nature of the Indian economy has changed post-Covid. A combination of superior physical and digital infrastructure, the benefits of economic integration in the wake of GST and a structural drop of the cost of capital (as 100mn+ Indian families shifted their savings from physical to financial assets) resulted in two different effects kicking-in: (a) smaller companies started pushing aggressively into the territory hitherto dominated by larger players eg. Astral Poly entering the paints industry; and (b) well-managed large companies realised that it is time to spread their wings and enter new industries eg. Tube entering the EV space, Trent entering the value apparel space. Exhibit 1 from our 25th June blog (“Creative Destruction on an Epic Scale in India Inc”) explains these two effects in more detail.
As we saw these changes take place in the Indian economy, we realised that by increasing allocation to ‘Enterprising Compounders’, CCP could benefit from the shape-shifting of the Indian economy.
Global Compounders Portfolio (GCP)
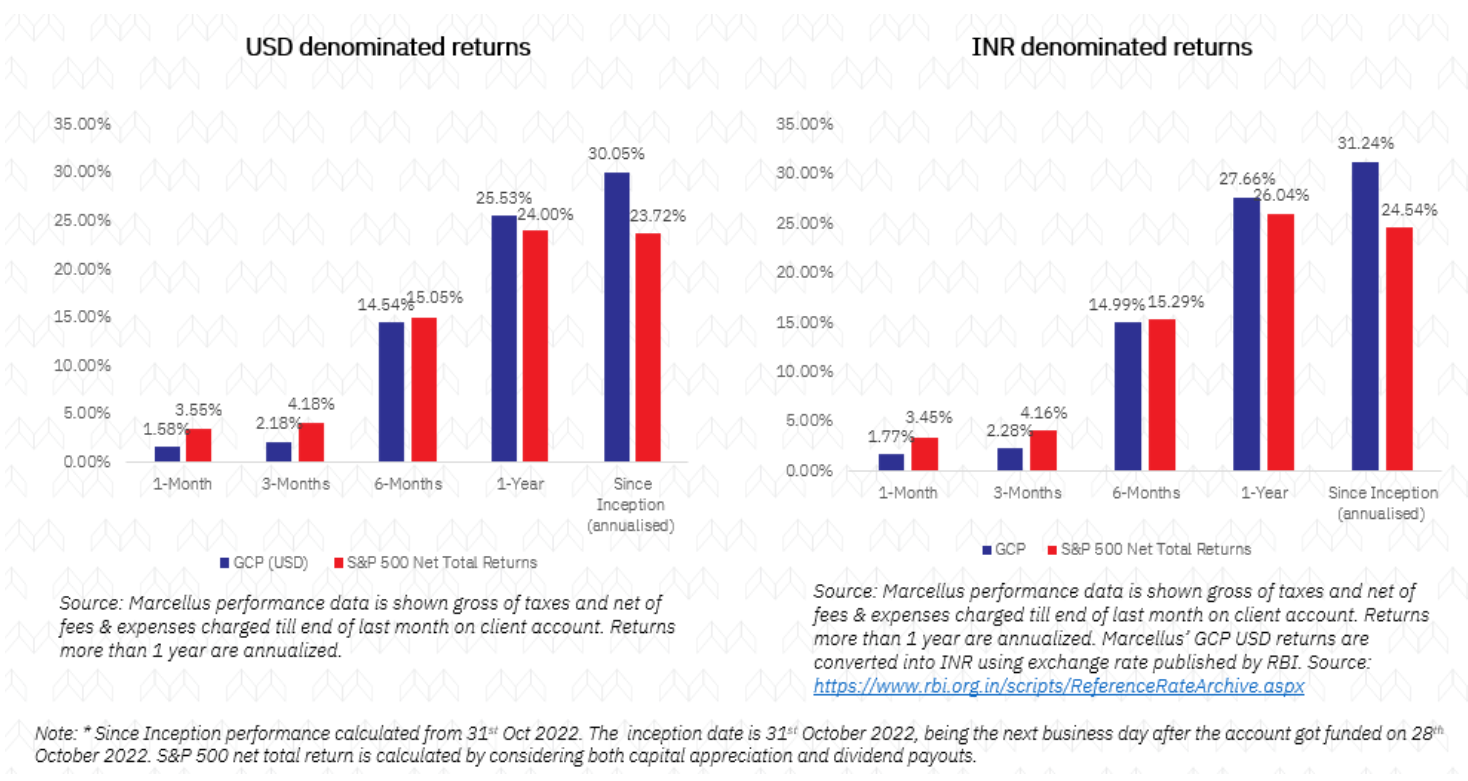
June proved to be a little challenging month for the Global Compounders Portfolio (GCP) relative to the benchmark, delivering a ~1.6% return compared to the S&P 500’s 3.6%. Interestingly, the S&P 500 Equal Weighted Index, which equally weights 500 stocks instead of using market capitalization, declined by 0.5%. Notable large-cap stocks in the benchmark, such as Apple (6-7% of the benchmark) and Nvidia (~6-7% of the market), posted impressive returns of 9.6% and 12.7%, respectively. These largely explain GCP’s underperformance relative to the benchmark for June.
As investors may recall, we exited our position in Apple during January and early February due to valuation concerns, which we believe remain valid. While momentum rallies can push a select few stocks to unprecedented valuation levels, it is crucial to remain vigilant about valuations during such times. Consequently, we adjusted our portfolio, reducing its relative valuation to 1.4x compared to the S&P 500 (relative EV/EBITDA) while maintaining strong fundamental compounding. Our decision to exit Costco and Intuitive Surgical last month reflects this valuation discipline. Although these steps may impact our relative performance in the very near term amid ongoing momentum-driven rallies, we think this is the right thing to do for medium to long horizon investors.
US Market Valuations
We often receive questions about the valuation of the US stock market. The US market currently displays a classic valuation dichotomy, indicative of mixed near-term outlooks. The S&P 500’s one-year forward PE is approximately 21.5x, higher than the 25-year average of around 17x but still below the dot-com bubble peak of over 25x in 2000. However, excluding the top 10 companies by market cap, the S&P 500 trades at its long-term average of about 17x, suggesting that the elevated index-level valuation is primarily driven by a few heavyweights.
Several factors contribute to the high valuations of the top 10 stocks, which trade at over 30x forward PE. Firstly, these stocks have delivered superior compounding returns. Secondly, they offer better near-term earnings growth and positive earnings surprises compared to most other stocks. Examples include Nvidia, Eli Lilly, and other major tech companies. Additionally, with potential risk-off trades ahead of the November elections, the market is currently driven by momentum, with a few stocks, not limited to technology but also including names like Costco and Eli Lilly, driving much of the broad index returns. Consequently, some of these stocks have become extremely expensive.
Narrow, momentum-driven rallies often conclude when undervalued sectors begin to recover. Currently, these sectors include Consumer, Housing, Biotech, and Traditional Industrials. Triggers for a bottoming process could include interest rate cuts or elections. We believe that interest rate cuts are more a matter of “when” rather than “if.”
Given this valuation divergence, it is prudent to identify potential investment opportunities in “out of favour” sectors. We are already identifying several promising opportunities in these areas and are positioning accordingly. Additionally, we have taken passive risk-neutral positions in a couple of index heavyweights, utilizing some of the freed-up capacity from exiting Apple and Costco.
Few Notable Names where we have built “new” Active Positions:
Waste Connections: Best in class owner-operator in waste management industry. It is a differentiated business strategy of targeting secondary & rural markets with long-term exclusive contracts and vertically integrated business model. Strong performance track with 4% organic CAGR and 10% in-organic CAGR. Enjoys highest profitability and cash generation among peers. It has a history of sound capital allocation with opportunistic acquisitions during periods of downturn. Performs several small acquisitions with few large deals each year. Acquisitions helped to strengthen company’s market position in the US, expand operations in Canada and gave exposure to E&P waste management. Has acquisition runway for next 10-15 years. Strong organizational culture driven by “servant-leadership” approach. De-centralized organizational model enabled to deliver strong operational performance. Management led by CEO and Founder (Ronald Mittelstaedt) with over 25 years in the industry. We expect a 12-14% FCF/share CAGR expectation over long-term, with a point of dividend on top of it – for this recession resistant business.
Diamondback Energy: Diamondback Energy is a shale oil & gas exploration and production company focused on Permian basin. Diamondback is a low-cost operator resulting in healthy cash generation. The company was established in 2012 to tap on to shale oil boom, it achieved massive 85% volume CAGR between 2012-19 driven by aggressive acquisiton and organic growth. Post covid, the approach changed towards capital return with low double digit volume growth driven mainly through acquisitions. Announced a large $29bn acquisiton of Endeavour Energy in Feb’24, the acquisition will increase production by ~75% and reserves by ~70%. It will further position the combined entity among the top-5 players in Permian basin. Diamondback is run by long-standing management with extensive experience of operating in the Permian basin region. Management has a good track record of capital allocation, performing acquisitions during downturn and avoiding large deals during periods of uptrend. Management is also incentivized to run operations in a low cost, capital efficient and cash generative way. Long-term incentive is mainly driven by TSR. We expect Diamondback to deliver 12-13% FCF/share CAGR over next 3-years as it closes Endeavour acquisition, integrates the business and realizes synergies. Trading at ~6x EV/EBITDA, It adds to the cyclical exposure of the portfolio.
Overall, we believe these changes will position us more favorably as economic uncertainty and potential rate cuts begin to subside.
Kings of Capital Portfolio (KCP)
The quarter ending June 2024 saw the portfolio do well on the back of renewed interest in banks while capital market plays continued to do well. Bank Nifty and Nifty Financial Services Index outperformed the broader Nifty50 Index during the quarter after a tepid FY24 for the financial services sector as evidenced by the fact that Nifty Financial Services Index delivered 16% returns during FY24 vs 30% for the Nifty50 Index.
The pre-quarter updates by banks suggests that the deposit environment continues to remain challenging. Large lenders such as HDFC Bank, PNB and Bank of Baroda’s disclosures suggest no/ insignificant sequential deposit growth. Given the elevated credit to deposit ratio of the sector, this implies a slowdown in credit growth for the sector unless deposit growth improves materially. In this backdrop, Bajaj Finance acquired a stellar 4.5Mn customers during the quarter ending Jun, 2024 and 31% YoY AUM growth. While we remain watchful of stress in retail lending, we believe Bajaj and Chola’s growth will standout during the year as banks continue to struggle with low deposit growth and elevated CD ratios.
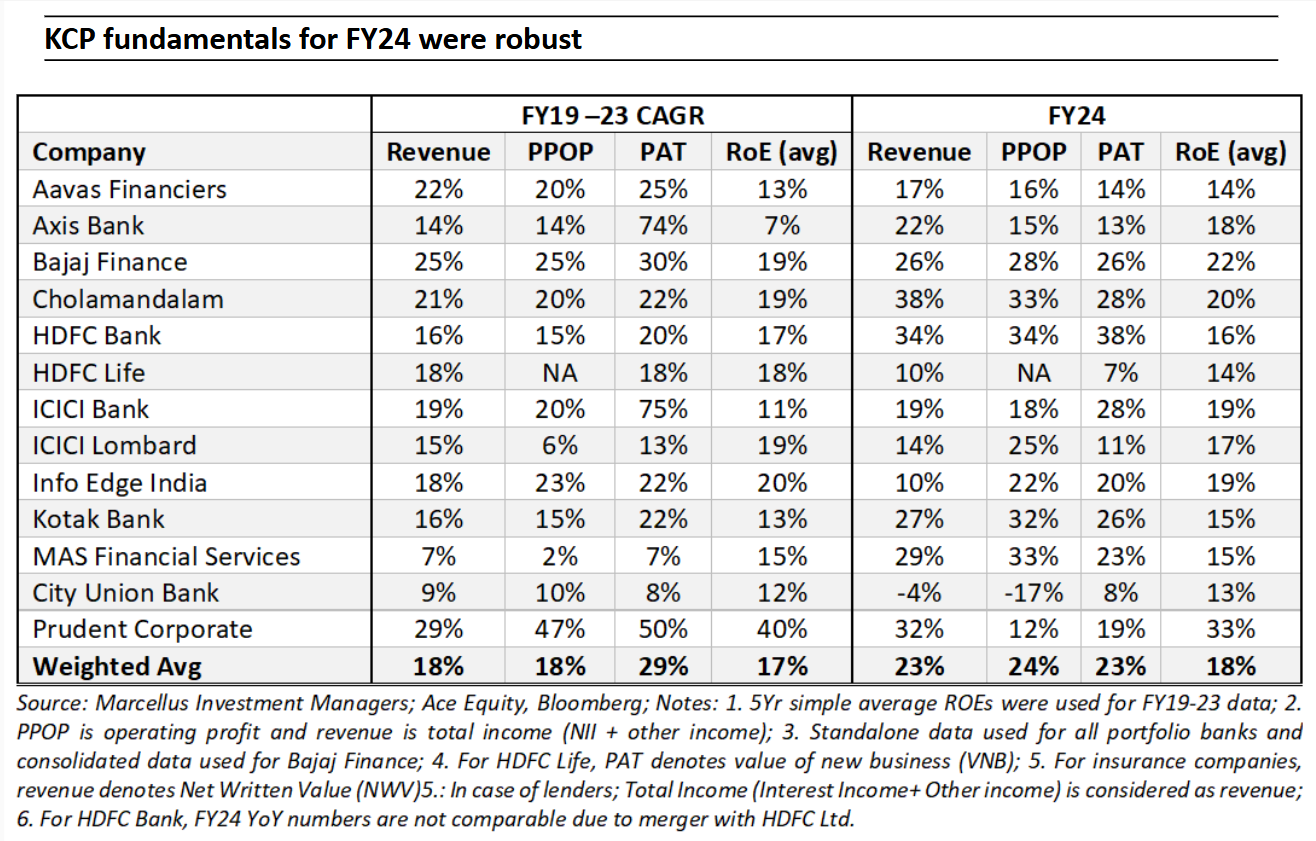
Other parts of the portfolio – life insurance, general insurance and capital markets are well placed and are likely to see robust profit growth during the year. However, we remain watchful of elevated valuations in these segments. We are therefore maintaining a balance between our allocation to banks which are trading at reasonable valuations but have a not so exciting near term outlook vs our allocation to capital markets, NBFCs and insurers which have more pricier valuations but good visibility for FY25. The portfolio’s allocation of ~45% to banks, NBFCs at ~25%, insurers at ~10-15% and asset managers at ~10-15% has resulted in delivering PAT growth of 20%+ consistently across time periods.
We believe the portfolio is well positioned to deliver healthy earnings growth albeit at a pace lower than what we saw during FY23 and FY24 as credit costs for lenders normalise and banking sector loan growth reverts to 12-13%. On the other hand, capital markets and general insurance continue to do well which is why we have increased our allocation to these two segments.
Changes to the portfolio:
We exited from Motilal Oswal in June as we had entered the stock at ~12x FY25e operating PAT with a view that industry tailwinds should offer healthy earnings growth whilst a rebound in their AMC’s fund performance could help bridge the gap on valuations relative to its peers. Since our purchase, the stock had re-rated meaningfully in a short period of time. Given the relatively more attractive valuations available in other names within the portfolio, we exited from the stock during the month.
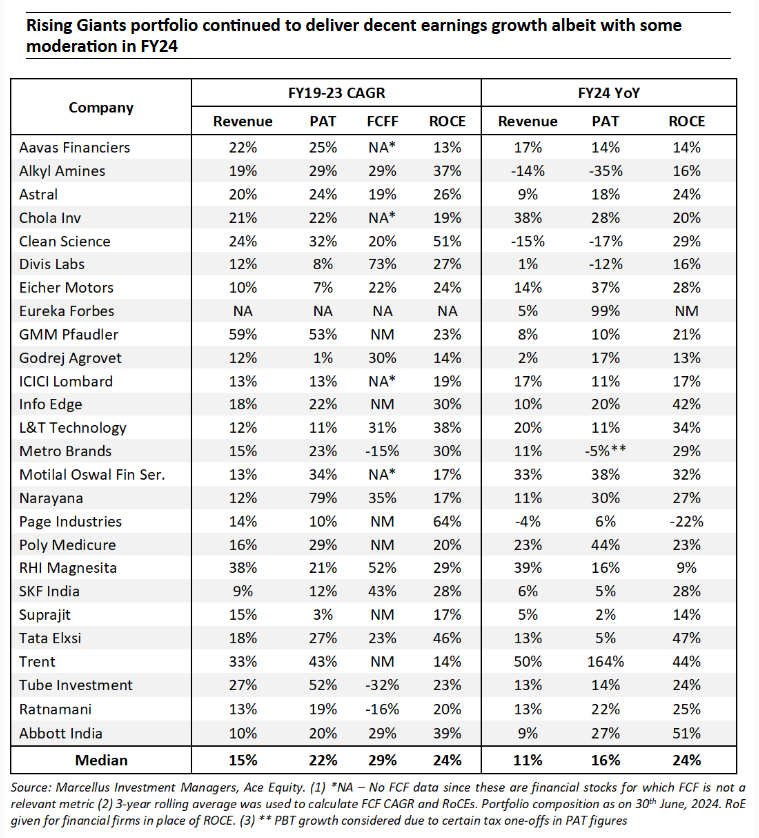
Little Champs portfolio (LCP) and Rising Giants portfolio (RGP)
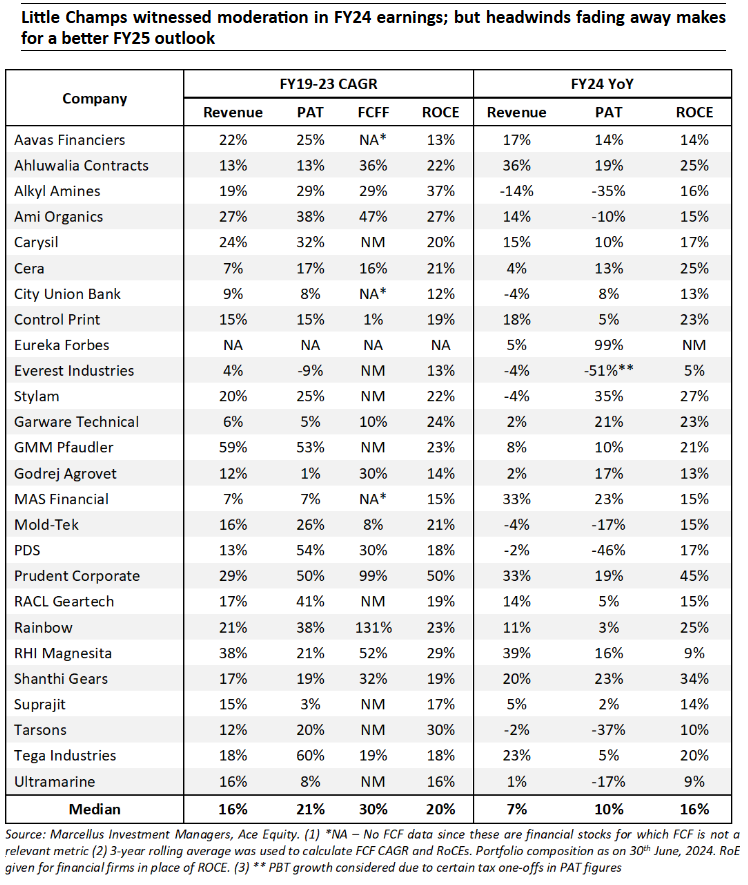
As highlighted in our last month’s newsletter, FY24 turned out to be a year of moderation in earnings for the LCP and RGP portfolio companies. As we have discussed in our earlier communications, reason for aforementioned deceleration is related to higher exposure to the export-oriented companies that’ve witnessed muted earnings due to unfavourable demand-supply dynamics impacting the volumes as well as the realization and profits.
As we head into FY25, the portfolio earnings would also benefit from the following reasons:
- A favourable base of FY24;
- A bottoming out of destocking cycle which impacted the earnings particularly for the export oriented companies in the recent quarters;
- Portfolio changes through additions of stocks where the earnings outlook appear sanguine and getting out of the stocks where the earnings outlooks is not encouraging.
Changes to the Little Champs PMS model portfolio (as at June 30, 2024)
Additions to the portfolio:
Stylam Industries Limited
Stylam is the second largest exporter of laminates from India (behind Greenlam) and derives nearly 70% of its revenues from the exports. The exports franchise is underpinned by a strong focus, long-standing distributor relationships and cost advantages (over regional players). We see enough headroom for the Company to grow in the export markets. The Company employs a very frugal set-up. Hence, despite earning lower gross margin than peers (due to pricing its products competitively in the domestic market), it is able to earn industry-leading EBITDA margin (due to lower fixed costs particularly the employee costs). In the past five years, it has outpaced industry growth, with its revenue/EBITDA/PAT growing at 15/18/27% CAGRs over FY19-24. The pre-tax RoCE averaged 27% over FY20-24.
Exit from the portfolio:
Fine Organic Industries
Fine Organic Industries’ share price has witnessed run-up in the last few days/weeks. Given the run-up, the expected IRRs on these stocks have come off sharply warranting an exit from the portfolio. The investment team also doesn’t foresee any scope for earnings upgrades in the stock given the muted demand scenario, coupled with capacity constraints which is unlikely to be addressed over the next 12-18 months. In view of this, it was decided to exit from the stock.
Changes to the Rising Giants PMS model portfolio (as at June 30, 2024)
Additions to the portfolio:
Ratnamani Metals & Tubes Ltd.
Ratnamani Metals & Tubes Ltd (RMTL) was founded in 1983 by Prakash Sanghvi (Joint-MD); Jayanti Sanghvi (Joint-MD) and Shanti Sanghvi in Ahmedabad, Gujarat. It is mainly into the manufacture of Carbon Steel (CS) & Stainless Steel (SS) Seamless & Welded Pipes & tubes along with certain niche areas like Nickel Alloy Seamless, Titanium Welded Tubes, Exotic Pipes like Incoloy tubes. The wide application for these pipes is in the Oil & Gas sector, Water Distribution, Power sector, Infrastructure sector, City Gas Distribution, Pharma, Chemical, Aerospace, Defence & Fertiliser sector.
The company has 3 manufacturing capacities in Gujarat at Indrad (SS pipes division), Gandhinagar (CS Submerged Arc Welding pipes division) & Kutch (CS Electric Resistant Welding division). The company derives 76% revenue from India and remaining 24% from exports to countries like UAE, Saudi Arabia, Kuwait, USA, Italy, Germany, France among others. The company counts RIL, HPCL, BPCL, IOCL, ONGC, GAIL, GSPL, Nuclear Power Corporation of India, BHEL, Siemens, Adani Power, L&T, Godrej, GSFC, GNFC, ISRO, BARC, DRDO among others as its clients.
The company possesses deep Institutional knowledge which helps to get good yields (92%+), which is critical because stainless steel costs 6-7x of regular steel and wastage hurts hard. So far, just 2 players have managed to crack the seamless stainless steel tubes market – Sandvik and Ratnamani. There is also a Stringent Approval process – a 5-year window is required to get qualified with most relevant customers. And finally, we like the fact that there is a Capex barrier – Rs1,000-1500 crs capital employed is necessary for a plant of reasonable size. While not a large sum, it has kept new entrants in check.
Abbott India Ltd is engaged in pharma formulation manufacturing and distribution primarily in India. The company caters to needs of patients in multiple segments – anti-diabetic, gastro-intestinal, hormone management, women’s health, etc. Company has a suite of very strong and popular brands in India market (Udiliv, Thyronorm, Digene, Duphalac, etc.) which enjoy a very high level of brand recall with patients and trust with prescriber community. Its partnership with Novo Nordisk also gives it distribution rights to many patented and globally best in class diabetes and obesity management products.MNC parentage has meant that the India strategy is controlled at global level and there is reduced key man risk in India operations. Company has also differentiated itself vs other MNC and domestic peers by opting for asset light model of business and relying on third party contract manufactures for large number of its products. As a result, company has always maintained a very healthy returns and cash flow profile.
In terms of financial performance, in last 10 years (FY14-FY24), company has grown its topline at CAGR of ~ 10%. Its EBITDA has grown at CAGR of 18.5% and PAT has grown at 19.8% CAGR. Average post tax ROCE in last 10 years has been 27.7%.
On the other hand, we exited from Page Industries Limited and Grindwell Norton Limited during the month of June 2024. Both these stocks have witnessed significant run-up in their share prices in the last few days/weeks. Given the run-up, the expected IRRs on these stocks have come off sharply warranting an exit from the portfolio.
Team MarcellusIf you want to read our other published material, please visit https://marcellus.in/

