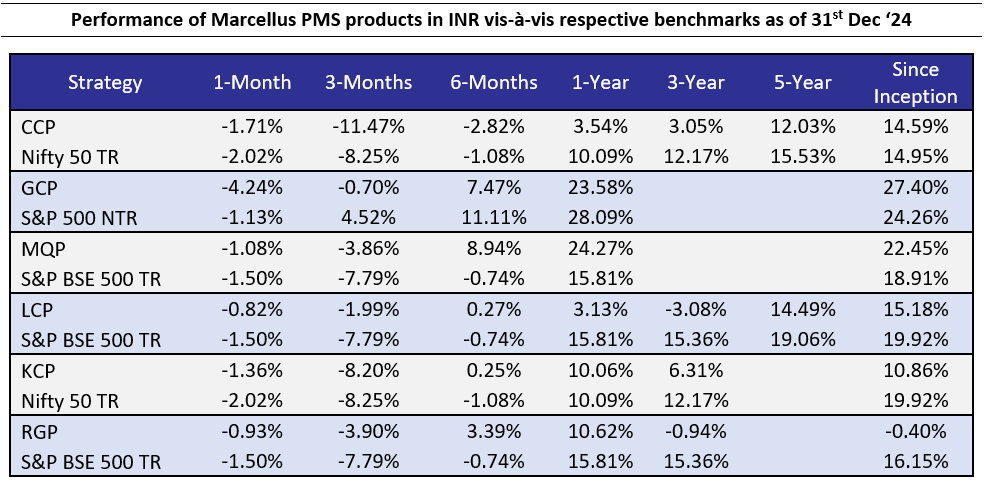
Note: For all strategies except GCP, Performance data shown is net of fixed fees and expenses charged till December 31st, 2024 and is net of annual performance fees (Except for Little Champs Portfolio) charged for client accounts whose account anniversary/performance calculation date falls upto the last date of this performance period. Since, for Little Champs Portfolio, performances fees are charged on cumulative gains at the third anniversary, of the respective client account, the effect of the same has been incorporated for client accounts whose third account anniversary falls upto the last date of this performance period. Performance data is not verified either by Securities and Exchange Board of India or U.S. Securities and Exchange Commission.
*For relative performance of particular Investment Approach to other Portfolio Managers within the selected strategy, please refer https://www.apmiindia.org/apmi/WSIAConsolidateReport.htm?action=showReportMenu Under PMS Provider Name please select Marcellus Investment Managers Private Limited and select your Investment Approach Name for viewing the stated disclosure.
Note: APMI provides performance data of Portfolio Managers managing domestic strategies only. Hence, GCP is excluded.
For GCP, performance data is shown gross of taxes and net of fees & expenses charged till end of last month on client account. . Performance fees are charged annually in December. Returns more than 1 year are annualized. GCP USD returns are converted into INR using exchange rate published by RBI.
Source: https://www.rbi.org.in/scripts/ReferenceRateArchive.aspx
The calculation or presentation of performance results in this publication has NOT been approved or reviewed by the IFSCA or US SEC. Performance is the combined performance of RI and NRI strategies.
Consistent Compounders Portfolio (CCP)
CY2024 was a year of transition. On the one hand the external environment saw a transition in terms of the pace of economic growth, government spending, leadership of the stock market etc. On the other hand, Marcellus’ CCP portfolio saw a transition in terms of sectoral exposure (addition of hospitals, domestic pharma, manufacturing, autos etc), a tilt towards enterprising compounders (i.e. companies with higher average rate of reinvestment of capital), and also an increase in the number of stocks in the portfolio (from 15 to 20 – reflecting the widening of our coverage universe in an environment where disruptions and changes in competitive intensity have become more frequent).
These changes to our portfolio constituents prepare us well as we enter 2025 with the co-existence of two polar opposite trends in the broader economy – healthy corporate balance sheets, but stressed household balance sheets. The width of the sectoral exposure that we have added to our quality universe over the last 12 months, gives us options to pick up high quality businesses in sectors which are not significantly exposed to the broader consumption slowdown e.g. healthcare (hospitals, pharma, diagnostics), private capex around manufacturing, exports, IT services etc. Moreover, several of our portfolio companies are implementing business initiatives that expand their target markets, add new revenue growth drivers and hence create resilience in their profits – for instance, Tube, Divis, Trent, Eicher etc. Several of our portfolio companies are also sitting on surplus cash piles which are likely to get utilised towards incremental organic and inorganic growth opportunities e.g. CMS, Escorts, Dr. Lal Pathlabs, Alkem etc. Hence, despite economic headwinds, in 2025 we expect healthy earnings growth of our portfolio companies, higher than that of the Nifty50 Index.
Global Compounders (GCP)
December proved to be challenging for the GCP portfolio, which underperformed its benchmark index by approximately 250–300 basis points at the gross level. This underperformance was driven largely by market polarization, with the “Magnificent 7” (plus Broadcom) – representing big tech – capturing favorable price action. These eight companies, now comprising 35% of the benchmark index, delivered returns of +2%, while the rest of the market declined by 6%. Our emphasis on mid-cap stocks weighed heavily on our relative performance.
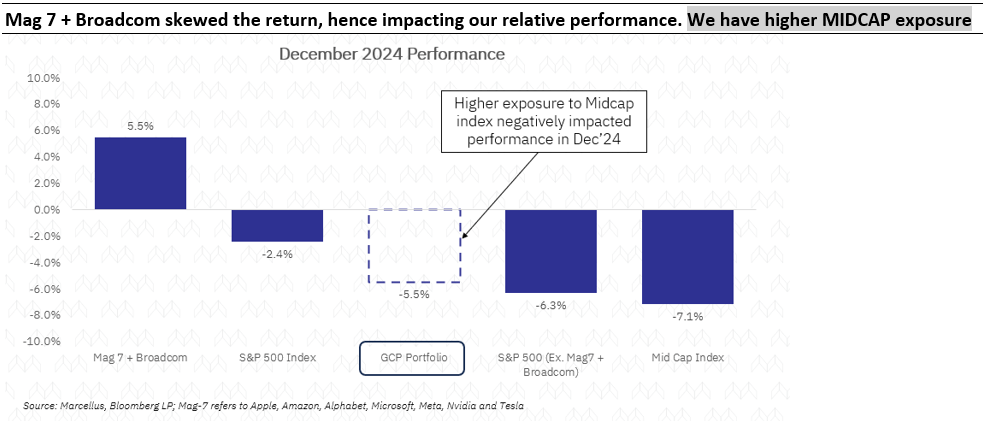
For example, Tesla (TSLA), one of the index’s larger weights, has been on a remarkable rally, amplified by its perceived momentum since Mr. Trump’s resurgence as a political contender. While we deeply respect Elon Musk’s visionary leadership, it’s challenging to justify Tesla’s valuation at over 10x Price-to-Sales – multiples typically reserved for high-growth, high-margin businesses. While Tesla has the potential to evolve into a high-margin software services business, such transformations come with significant risks and leave little margin of safety.
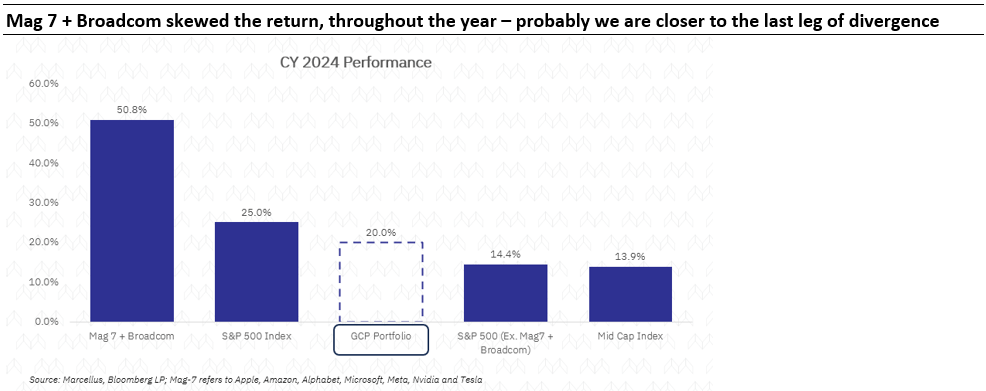
Having said that, this divergence in performance has been a recurring theme for the year. The Equal-Weighted S&P 500 (which assigns equal weights to all constituents) has returned 13%, compared to the Market-Cap-Weighted S&P 500’s return of 25%.
The market’s concentration in a few stocks is not without reason – only a handful of companies, including those in our portfolio, have demonstrated forward EPS growth over the past two years. However, we expect this gap to narrow over time …
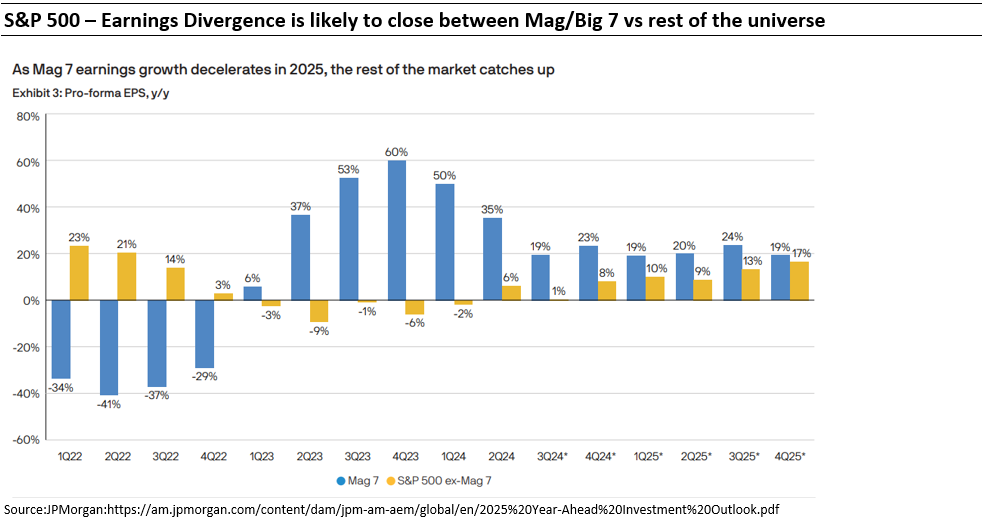
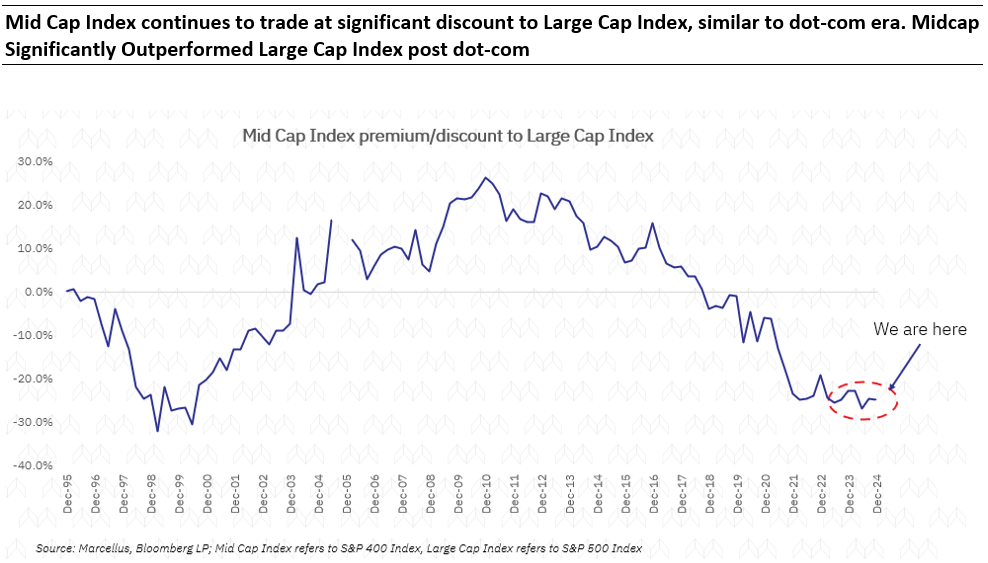
…particularly as valuation differentials between large- and mid-cap indices are currently near historical highs. S&P 500 is trading at a PE which is close to its all-time high. As earnings growth between these segments begins to converge, we anticipate a gradual rebalancing in market dynamics…
Portfolio Commentary:
We made no changes to the portfolio in December. Two of our portfolio companies reported results during the month:
Heico: Heico closed fiscal 2024 on a strong note, with 30% revenue growth and 27% net income growth. Organic growth contributed 6% to revenues, with the remainder coming from acquisitions. For FY25, organic growth is expected to accelerate, driven by improved defense outlays and continued strength in the aerospace aftermarket, as approximately 30% of aircraft fleets are expected to exit warranty. Heico’s balance sheet has significantly deleveraged, and its M&A engine is ready to reignite following the integration of its largest acquisition, Wencor. The recent selloff in Heico shares appears to be profit-taking rather than a reflection of fundamental concerns. Valuation-wise, Heico is trading at the lower end of its historical premium relative to the market. We anticipate 15%+ USD EPS and capital return compounding over the next 3–5 years.
Cintas: Cintas reported Q2 results with 8% revenue growth, 18% operating profit growth, and 20% net income growth. The resilience of Cintas’ uniform rental business is noteworthy, consistently compounding organic growth at 7–8%, supported by mid-single-digit pricing increases. While we have been cautious about Cintas’ valuation and have trimmed our position over the past year, the company’s fundamentals remain robust. Its strong balance sheet positions it well for potential acquisitions, which we are closely monitoring. The recent correction in Cintas shares, like Heico’s, was likely profit-taking after a strong rally. We remain positive on Cintas’ long-term setup.
Broadly, we continue to see opportunities in select subsectors where valuations remain attractive. A clear distinction has emerged, with the market rewarding companies that deliver on earnings while penalizing those that fall short. Among underperformers, we are identifying cases where challenges are transitory, presenting potential valuation arbitrage opportunities.
While this disciplined approach to relative valuation may mean sacrificing some near-term relative returns (the other way could have been churning the portfolio more, which would have tax implications for our investors) – which has been the case for last 6 months, we are confident in its long-term benefits. Our focus remains on maintaining a balanced and resilient portfolio, positioning us well for the year ahead.
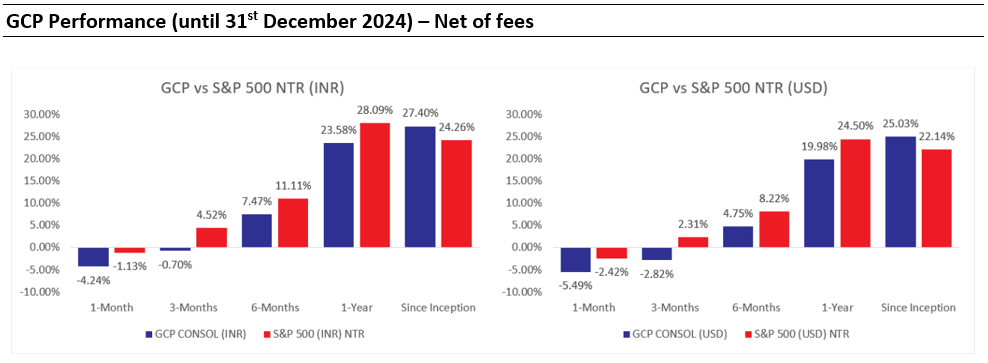
Marcellus performance data is shown gross of taxes and net of fees and expenses charged until the end of last month. Performance fees are charged annually in December. Returns for periods longer than one year are annualized. Marcellus’ GCP USD returns are converted into INR using exchange rate published by RBI. Source: https://www.rbi.org.in/scripts/ReferenceRateArchive.aspx
Since Inception’ performance calculated from 31st Oct 2022. The inception date is 31st October 2022, being the next business day after the account got funded on 28th October 2022. S&P 500 net total return is calculated by considering both capital appreciation and dividend payouts.
The calculation or presentation of performance results in this publication has NOT been approved or reviewed by the IFSCA or SEC. Performance is the combined performance of RI and NRI strategies.
Kings of Capital Portfolio (KCP)
The broader market corrected in December with Nifty 50 and Nifty Bank declining 2% and 2.3% respectively, KCP (post fees) corrected lower by only 1.4% during the month. Over the past 6, 12 and 24 months, the Kings of Capital portfolio has outperformed the Bank Nifty Index as the euphoria and investor interest in public sector banks, tier-II private banks has subsided over the past couple of quarters.
One of the attributes of KCP’s outperformance has been the resilience in earnings delivered by portfolio companies. Consensus estimates print (from Bloomberg) for KCP (weighted average position size basis) suggests that KCP’s FY25E EPS estimates have been broadly upgraded by ~1% since the beginning of the financial year (1st Apr’24) vs. decline of 2.3% for Nifty 50.
Whilst we continue to see EPS downgrades in the broader markets, large banks have bucked the trend, leading to reduced earnings growth gap between banks and the market. Meanwhile, large banks continue to trade at a discount to the benchmark, driving margin of safety. December month also marked another positive for banks driven the regulator’s action of 50 bps cut in CRR (cash reserve ratio – money which banks need to keep with RBI and get 0% return on the same). This policy action further builds on the change in stance by the RBI earlier in October from ‘withdrawal of accommodation’ to ‘neutral’.
With Nifty 50 and Nifty Bank declining ~9-10% from their peak and some stocks having corrected more has allowed us to buy them again at a cheaper price. One such instance of the same is HFFC (details below) – a company we sold earlier owing to valuation concerns.
Changes to the Kings of Capital portfolio
Addition of Home First Finance
In the month of Dec’24, a large block by the promoters led to sharp cuts in the stock price of Home First leading to valuations correcting to ~2.7x 1-yr forward BVPS (incl. expected fund raise). We took this as an opportunity to buy into a great franchise, which continues to do well on all parameters (leading within the affordable housing finance space) and consistently posting RoEs of ~16-17%. In the current environment, asset quality risks are not visible in housing finance as of now (across players), this is perhaps the last segment to get hit in an asset quality downturn. Historically too, we have NOT seen asset quality risks play out in housing. We would expect the same to follow this time too. HFFC also has the lowest share of LAP book (~14%) within peers and has seen calibrated growth there, hence risks are low.
Source: Marcellus Investment Managers, annual filings of respective companies
Little Champs portfolio (LCP) and Rising Giants portfolio (RGP)
After growing handsomely over FY24, the wheels of the broader corporate earnings seem to have come off in the last 2 quarters with BSE500 weighted average PAT growth moderating to single digit in 2QFY25. While there could be many reasons for the same – we believe the two key factors are:
- Decline in consumption, particularly the urban consumption, brought upon by weakened financial position of the Indian Middle Class. A key reason for this is the job losses coming from technology replacing human jobs, cyclical downturn in the economy. The household balance sheets appear to be in the worst shape since nearly 50 years – for instance the level of household savings is at a 50-year low. As a result, we are seeing a broad consumption slowdown across categories ranging from staples to passenger cars.
- Another reason for the earnings conking off in the recent quarters is the substantial slowdown in the Government capex which infact had helped the relevant companies deliver strong earnings in the earlier quarters. The YTD FY2025 (April – November 2024) government capex is down 12% YoY. With diminishing tax/revenue receipts – there are emerging concerns around whether the Government would be able to meet the budgetary allocations made for FY25.
We think the corporate earnings slowdown cycle which seems to have kicked in the last 2 quarters are likely to last for some time now.
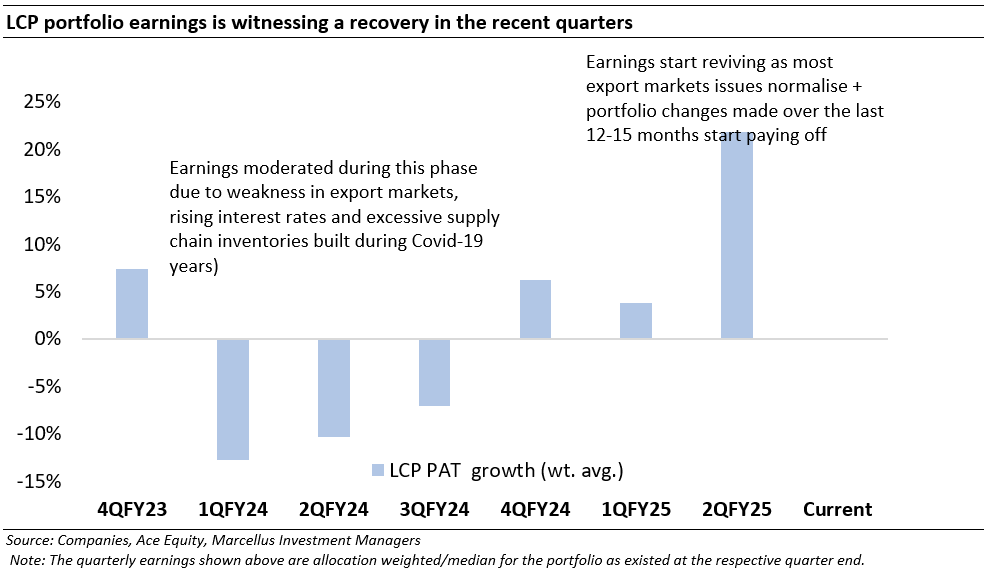
On the other hand, however, we are seeing the reverse in our LCP and RGP portfolios. LCP portfolio earnings, after witnessing declining trends through FY24, has staged a strong comeback. For instance, for the most recent quarter (2QFY25), Little Champs witnessed 22% growth in the allocation weighted earnings.
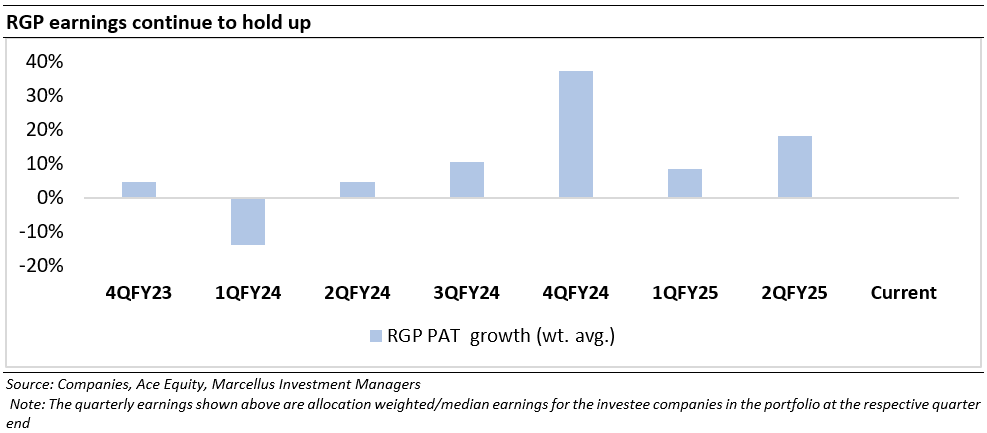
Similarly, Rising Giants portfolio, which never witnessed sharp drawdown as Little Champs saw in FY24, continued to witness healthy earnings of 18% in the allocation weighted earnings.
Now what is driving Little Champs and Rising Giants to outperform the broader corporate earnings:
We attribute it to the following factors:
- Green shoots in the Export markets: Export markets which served as Achilles heel for the both portfolios in FY24 have come to the rescue when the domestic macro is not looking good. Most of the Exports oriented companies in both the portfolios have recorded strong double digit growth in 2QFY25.
- Rural oriented stocks holding up well: Dodla Dairy, Godrej Agrovet have done well. We have also recently bought Escorts as we expect tractor volumes to witness a revival in from 2HFY25.
We remain sanguine about the relative prospects of the LCP and RGP portfolios driven by our confidence around the earnings outlook, healthy balance sheets and management quality of our portfolio stocks which has historically helped them exhibit high degree of resilience during periods of market drawdowns.
Additions to the Rising Giants PMS portfolio (as of December 31, 2024)
1. Berger Paints
Berger Paints, the second largest paints players in India, is currently going through a challenging phase (2QFY25 revenues flat YoY and EBITDA down 8%) due to weak paint industry volumes in the recent times. Besides the weak volumes, there are concerns in the paint industry surrounding the rise in the competitive intensity brought upon by the entry of Birla Opus (Grasim/Aditya Birla Group). Despite these adverse factors, we have decided to include Berger Paints in the portfolio due to following reasons:
Berger continues to hold on to its market share (for context – Berger’s 1HFY25 revenues were 1.2% YoY whereas 4% de-growth for Asian Paints) as it continues to build its distribution muscle. Some of the reasons for the outperformance for Berger vs Asian Paints are:
· Asian Paints derives 65% revenues from premium products whereas the corresponding number for Berger is 45-50%;
· Asian has greater market share in larger cities (slowdown in urban consumption is impacting this the most) vs Berger; and
· Also, Asian Paints is more skewed towards south and west India vs Berger which is more skewed towards north and east. This also feeds into the rural vs urban split. The south and west orientation was also the reason for greater impact on Asian from floods etc in 2Q FY25 vs Berger.
Valuation comfort:
· Berger’s share price has compounded at only 2% CAGR over the last 5 years (FY19-24); whereas the 5 years earnings CAGR over FY19-24 works out to 19% (1HFY25 PAT is down 4%). This implies significant de-rating in the valuation multiples over the last 5 years.
Whilst there is an acknowledgement regarding the current concerns in the industry and a lack of immediate positive catalysts, the current price provides good return opportunity from a 2 years’ perspective given the historical track record of the franchise in dealing with the competition and our expectation of healthy structural volume growth story for the paint industry.
2. Eris Lifesciences
Eris Lifesciences was founded in 2007 by Mr. Amit Indubhushan Bakshi. Previously, Mr. Bakshi had 12+ years of experience in across companies like Torrent, Eli Lilly and Intas. Rapid market growth in the cardiac (~12% CAGR) and anti-diabetic (~19% CAGR) segments over FY13- 17 was a key driver of Eris’ revenue growth during this period and allowed it to emerge as the fastest growing company in chronic categories among the top 25 companies in India. In the recent years, the Company has, through inorganic route, expanded into newer therapeutic areas like:
· Central Nervous System; Vitamins & Minerals (through acquisition of Strides Shasun’s India formulations business in 2017);
· Dermatology and Gynaecology through the purchase of the purchase of Oaknet Healthcare in 2022;
· Nephrology through the acquisition of Biocon’s unit in 2023;
· Injectibles capability through acquisition of Biocon’s India formulation business.
Additionally, the acquisition of Zomelis (Vildagliptin) brand from Novartis in 2020, formation of JV with MJ BioPharma (70:30) in 2021 has further strengthened the anti-diabetic portfolio of Eris.
What we like about the Company:
· Focus on the chronic segment (chronic and sub-chronic therapy segments account for 82% of its FY24 revenues). Chronic portfolios generally deliver superior gross and operating profit margins compared to acute therapies, making this a financially advantageous focus;
· Focus on brand building in the Indian Pharma market: The company has a focused portfolio with its Top 20 mother brands accounting for 63% of its domestic branded formulations revenue. 15 of these brands rank among Top 5 in their respective segments. Across prescription categories, Eris ranks in the Top 5 across diabetes care, cardiac care, derma and neuro. This unique positioning in Indian chronic and sub-chronic segment enables Eris to achieve higher margins at both the gross profit and operating profit levels
· M&A track record: Eris’ management has identified dermatology, injectables, nephrology, oncology and biosimilars as key focus areas with high growth potential and have made acquisitions to acquire brands and technologies in these spaces.
· Full spectrum manufacturing capabilities: Over the years, the company has strategically developed and acquired a comprehensive suite of manufacturing capabilities, covering oral solid dosages (tablets, capsules, sachets, soft gels), oral liquids, injectables, biologics, dermatology and insulin capacities, among others. This evolution in manufacturing capacity has significantly strengthened Eris’s ability to meet diverse therapeutic needs across both large and small molecule spaces, setting it apart from competitors of similar size.
Key risks:
i. Leveraged Balance Sheet: As of March 31st 2024, the company had ~INR 3000 crore of net-debt (3.5x Net-Debt to EBITDA ratio) which has been reduced to ~2500 by the end of Q2FY25 (ahead of the target of ~INR 2600 for this period). By FY26, the management aims to bring down its net-debt levels to ~INR 2000 (1.6x Net-Debt to EBITDA ratio). The significant leverage on the balance sheet raises concerns about Eris’s ability to grow its acquired businesses to their full potential. High debt levels may constrain the company’s capacity to allocate adequate resources for scaling operations, driving innovation, and supporting post-acquisition integration.
ii. Core Portfolio Challenges: Trailing IPM Growth Eris has been trailing the IPM in terms of both volume and value growth in its core portfolio. This underperformance is driven by several structural and competitive challenges. Historically, Eris’s core product base has relied on oral solid dosages (OSDs), particularly in the anti-diabetic segment, which is now facing saturation and heightened competition. The broader industry segments where Eris operates, such as diabetes, have experienced slower growth, and the company’s initial denial of this trend delayed its strategic response.
iii. Overreliance on Amit Bakshi Eris’ success and strategic direction have been heavily influenced by its founder, MD and Chairman, Amit Bakshi. Bakshi is the driving force behind the company and has played a pivotal role in shaping Eris’s vision, and overall growth strategy, while operational execution is supported by its COO, Krishnakumar V.
3. Home First Finance
Home First’s business continues to do really well on all parameters (leading within the Affordable Housing Finance Company space) and consistently posting RoEs of ~16-17% leading us to raise EPS estimates over the last 1 year. Stock valuations now have corrected to ~2.7x 1-yr forward. We believe this is a great opportunity to buy into the weakness. Overall, asset quality risks are not visible in housing finance as of now (across players), this is perhaps the last segment to get hit in an asset quality downturn. Historically too, we have NOT seen asset quality risks play out in housing. We would expect the same to follow this time too. HFFC also has the lowest share of LAP book (~14%) within peers and has seen calibrated growth there, hence risks are not very high in this book. Expect ~24% PAT and ~21% EPS (lower due to dilution) growth over FY25-30.
Source: Marcellus Investment Managers, annual filings of respective companies
Additions to the Little Champs PMS portfolio (as of December 31, 2024)
Addition of Berger Paints, Eris Lifesciences and Home First Finance to the portfolio. Please find the rationale under the RGP section above.
Regards,
Team Marcellus
If you want to read our other published material, please visit https://marcellus.in/
Please refer to the following link for our Responsible Investing Policy, our ESG Integration Framework and Results of ESG scoring: https://marcellus.in/responsible-investing


