|
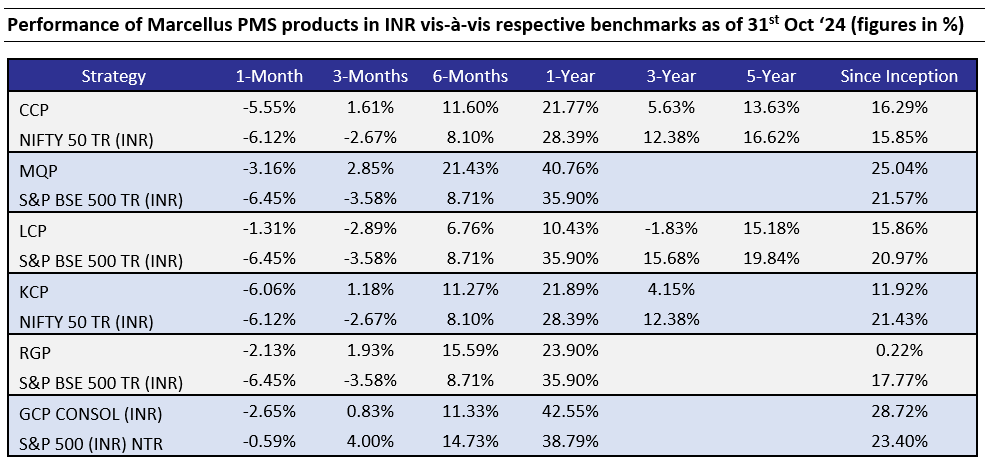
Note: For all strategies except GCP, Performance data shown is net of fixed fees and expenses charged till September 30th, 2024 and is net of annual performance fees (Except for Little Champs Portfolio) charged for client accounts whose account anniversary/performance calculation date falls upto the last date of this performance period. Since, for Little Champs Portfolio, performances fees are charged on cumulative gains at the third anniversary, of the respective client account, the effect of the same has been incorporated for client accounts whose third account anniversary falls upto the last date of this performance period. Performance data is not verified either by Securities and Exchange Board of India or U.S. Securities and Exchange Commission. For GCP, performance data is shown gross of taxes and net of fees & expenses charged till end of last month on client account. Returns more than 1 year are annualized. GCP USD returns are converted into INR using exchange rate published by RBI. Source: https://www.rbi.org.in/scripts/ReferenceRateArchive.aspx The calculation or presentation of performance results in this publication has NOT been approved or reviewed by the IFSCA or SEC. Performance is the combined performance of RI and NRI strategies. *For relative performance of particular Investment Approach to other Portfolio Managers within the selected strategy, please refer https://www.apmiindia.org/apmi/WSIAConsolidateReport.htm?action=showReportMenu Under PMS Provider Name please select Marcellus Investment Managers Private Limited and select your Investment Approach Name for viewing the stated disclosure. Note: APMI provides performance data of Portfolio Managers managing domestic strategies only. Hence, GCP is excluded. |
|
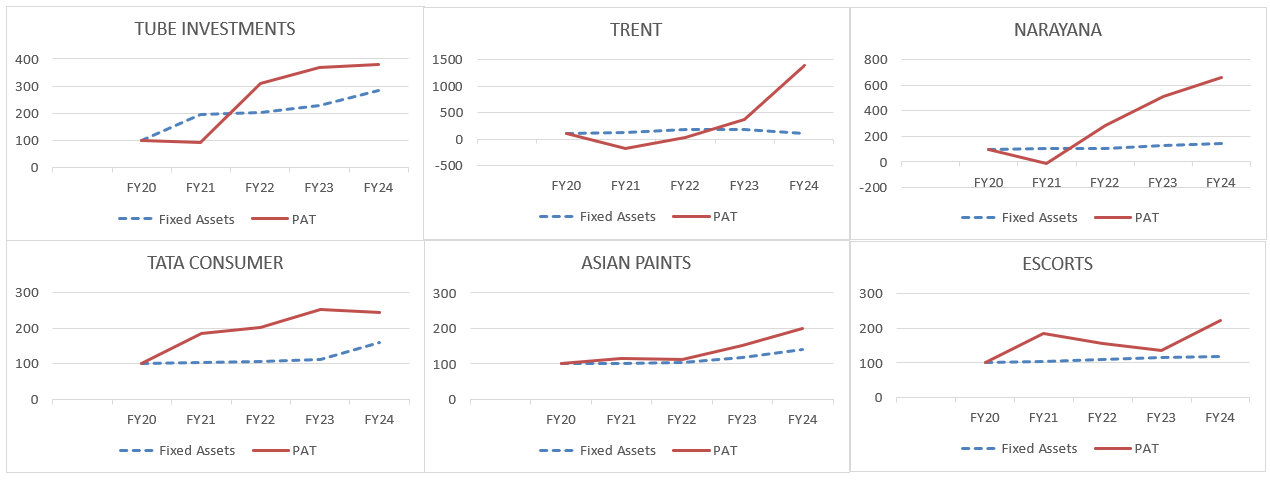
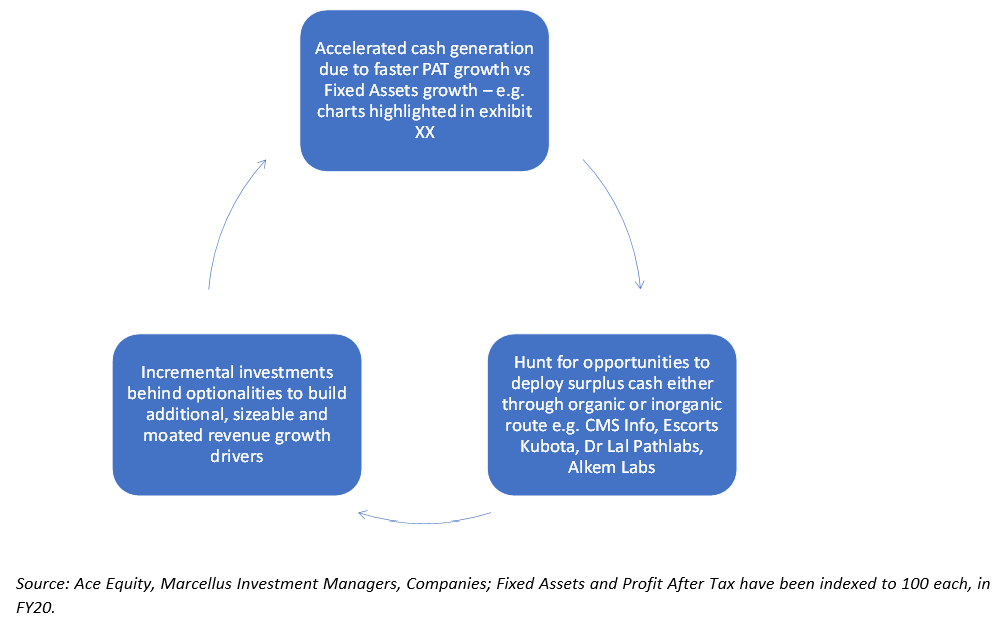
Consistent Compounders Portfolio (CCP) 2QFY25 results for the broader Indian stock market suggest a broad-based slowdown in the Indian economy. 34 Nifty-50 companies reported results in the month of October and their net income increased by only -1% YoY. Amidst this slowdown in broader corporate earnings growth, we expect healthy earnings growth from CCP portfolio companies, which should continue to reflect in their share price performance in future. From a long term perspective, ‘capitalism without capital’, i.e., the growing prominence of companies who are plays on intellectual rather than physical assets, is now increasingly prominent amongst Indian companies. Marcellus’ CCP portfolio is actively participating in this theme – over the past 5 years, profits of companies in our current CCP portfolio have grown at a significantly faster pace (31% PAT CAGR) compared to their fixed assets (16% Fixed Asset CAGR) on a weighted average basis. Intangible or intellectual assets provide advantages around: a) ‘Scale’ – e.g. Narayana’s tech stack; b) Spillovers – e.g. Trent’s differentiated procurement architecture that was built for Westside, but was leveraged by Zudio; and c) Synergies – e.g. CMS Infosystem’s multiple intangible assets collectively produce even higher returns than what they would produce individually. Finally, faster profit growth compared to fixed asset growth leads to accelerated cash flow generation, which is reinvested by enterprising compounders to build optionalities, thereby augmenting overall revenue growth in future. |
|
Exhibit: Over the past 5 years, profits of companies in our current CCP portfolio have grown at a significantly faster pace compared to their fixed assets |

Global Compounders (GCP)
We have not made any changes in the portfolio since June this year. October was a busy month, with significant U.S. election news and a wave of earnings reports. This drove some volatility, as the market anticipated earnings while attempting to predict the election outcome. Betting markets fluctuated, and it’s likely the election results are clear by the time this newsletter reaches you.
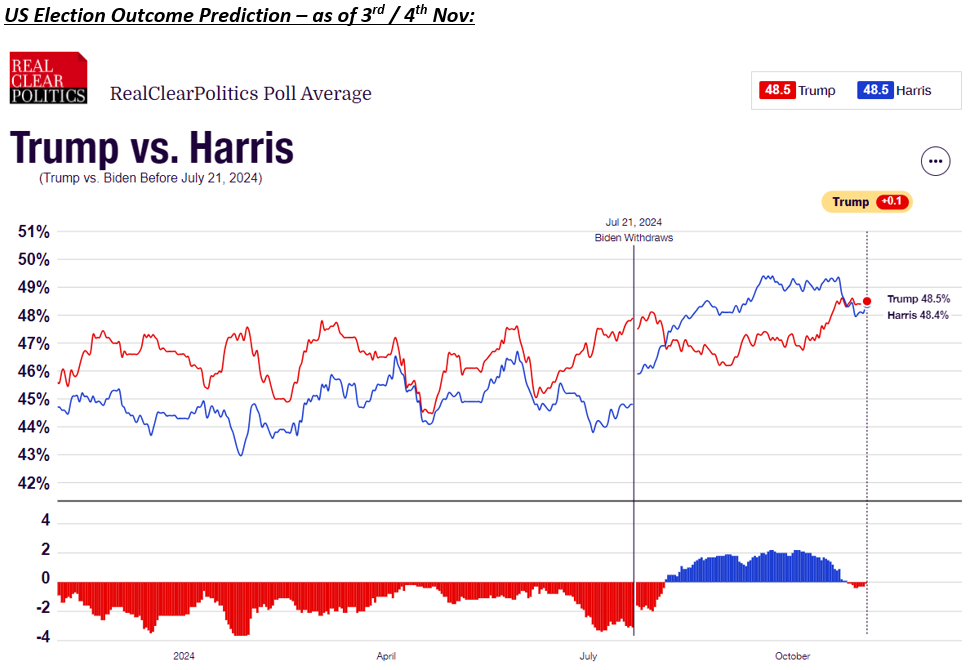
Source: 2024 National: Trump vs. Harris | RealClearPolling
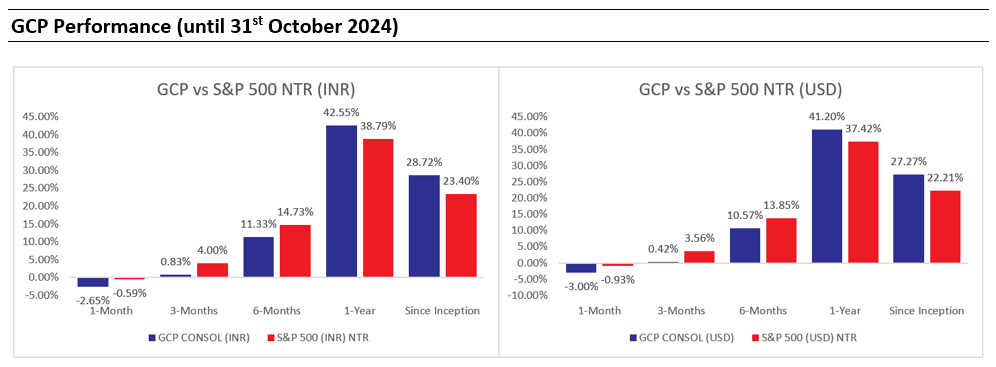
In terms of performance, GCP underperformed the index by ~200bps for October, largely due to our limited exposure to Nvidia and disappointing earnings from a few holdings. This level of volatility is not uncommon during earnings season and major events like the U.S. election.
It might be worth highlighting few of the portfolio company earnings that were big movers around and post earnings – it was a mixed bag:
Taiwan Semiconductor (TSMC): Very positive set of numbers, TSMC’s Q3 FY24 results underscored its dominance, with $23.5 billion in revenue (up 36% year-over-year), driven by high-performance computing (51% of revenue) and smartphones (34%). With a ~58% gross margin, TSMC achieved $13.6 billion in gross profit, resulting in an operating profit of $11.2 billion (47%+ margin) and a net profit of $10.1 billion (~43% margin). TSMC kept expenses tightly controlled, investing $1.6 billion in R&D and $2.4 billion in operations, reinforcing its commitment to innovation and leadership. Leading 3nm and 5nm production, TSMC has captured major AI, HPC, and automotive market share, leaving Intel and Samsung trailing as they grapple with delays and yield issues. With fully ramped 3nm production and a clear 2nm roadmap by 2025, TSMC has solidified its position as the frontrunner in a tech-driven race where speed and precision are key. It is our largest position in the semiconductor space – hence it was comforting to see the thesis in place.
ASML: ASML’s quarterly results were fine, but the outlook was challenging – unlike that of TSMC’s. ASML’s Q3 results showed robust revenue of EUR 7.5 billion, up 20% sequentially and 12% year-over-year, with EBIT, EPS, and gross margins exceeding expectations. However, bookings missed by 51%, and management has revised its FY25 outlook, lowering net sales from €35 billion to €32.5 billion at midpoint, driven by fewer EUV orders and reduced sales in China. Gross margin guidance also dropped from 55% to 52%, reflecting a less favorable revenue mix and lower EUV sales. Despite these adjustments, ASML’s long-term outlook remains strong, with EUV expected to comprise most system sales in the coming years, up from 36% today. Although the recovery in non-AI segments will extend into 2025, ASML’s €36 billion order backlog highlights its market dominance and revenue visibility, exceeding the entire FY25 sales forecast. While we remain confident in ASML’s leadership in EUV lithography and long-term growth prospects, we were concerned on the cyclical downturn in ex AI exposure and potential order headwind from China (reflected in position sizing), ASML’s guidance was even below our lowered expectations. But the valuation looks compelling, and if there is some visibility around bottoming of orders/revenue expectations, this can be an interesting opportunity to add more.
IDEXX Laboratories: Broadly weak set of numbers and outlook. IDEXX reported a 6.6% YoY revenue growth in Q3 2024 (6.1% organic), affected by a decline in same-store clinical visits and pricing pressures. U.S. CAG Diagnostic growth was modest at 4.6%, with wellness visits down 3.4%, while international diagnostics grew 9% organically. Sales gains were mainly driven by ~5% price increases, though weaker U.S. pricing stemmed from contract renewals with large clients. However, IDEXX reduced its Q4 and FY guidance, citing weaker clinical visits and hurricane impacts. High inflation is reducing clinic visits, with diagnostic frequency and utilization unable to offset this trend. Reflecting on IDEXX’s outlook, we see room for improvement; our data checks with veterinarians indicated that staffing issues were resolving, yet we underestimated consumers’ discretionary approach to pet care spending amid stretched budgets. We’ll monitor shifts in spending behavior closely, but it’s clear we could have been more cautious in our projections.
AMETEK: Returned to its beat-and-raise form after a couple of underwhelming quarters. The company reported Q3 adjusted EPS of $1.66, surpassing both internal and Street estimates of $1.62, supported by strong segment operating profit. While EIG sales were relatively flat, EMG sales grew 18% with continued double-digit order growth. AMETEK’s free cash flow remained robust, and the company increased FY24 guidance to an EPS range of $6.77–6.82, above the Street’s estimate of $6.76. Additionally, AMETEK’s acquisition of Virtek Vision, a laser-based projection and inspection systems company, reflects its confidence in sustained growth and positions it for further expansion in its niche markets.
Reflecting on 2 Years of GCP
October also marks the GCP portfolio’s two-year anniversary. It’s been an eventful but rewarding journey, with the portfolio achieving an absolute CAGR of ~28% net of fees in INR terms, outperforming the benchmark by over 500bps. This is particularly notable given the highly concentrated nature of the U.S. market over the past two years, where a handful of mega-cap tech giants delivered the majority of returns, and we maintained limited exposure to this group. While it was challenging to miss out on Nvidia, our strong performance relative to the benchmark underscores the value of our strategy and the diligent work of our team.
The past two years have been filled with valuable lessons, and we’ve identified several areas for improvement that we will prioritize moving forward. We view this as an ongoing process as we continue to refine our approach and deliver on our commitment to investors.
Thank you, as always, for your continued trust in us!
|
Marcellus performance data is shown gross of taxes and net of fees and expenses charged until the end of last month. Performance fees are charged annually in December. Returns for periods longer than one year are annualized. Marcellus’ GCP USD returns are converted into INR using exchange rate published by RBI. Source: https://www.rbi.org.in/scripts/ReferenceRateArchive.aspx ‘Since Inception’ performance calculated from 31st Oct 2022. The inception date is 31st October 2022, being the next business day after the account got funded on 28th October 2022. S&P 500 net total return is calculated by considering both capital appreciation and dividend payouts. The calculation or presentation of performance results in this publication has NOT been approved or reviewed by the IFSCA or SEC. Performance is the combined performance of RI and NRI strategies. |
|
Kings of Capital Portfolio (KCP) As Q2FY25 results for most large lenders have been reported in the past month, we can see slowdown in loan growth and signs of stress especially across microfinance and unsecured lending. The exuberance around growth and especially retail lending is appearing to die down as most lenders have sounded caution. For the first time post Covid, discussion has shifted from growth and margins to asset quality and risks. We believe KCP lenders stand to benefit in such an environment as the stress build up in KCP lenders has been significantly lower than the rest of the system. While we will discuss Q2FY25 earnings in greater detail in next months’ update, basis the results already published KCP portfolio earnings growth has held up better than the broader market. Specifically versus the lending universe, asset quality of KCP lenders has also been significantly better. This is visible in how the markets have penalised poor quality lenders over the past 3 to 6 months: Nifty PSU Banks Index has corrected 13% from their peak Various types of SFBs have corrected 35% from their peak On the other hand, the big four private banks (all four large private banks are KCP holdings) and regional banks (City Union Bank is a KCP portfolio company) have held up well. As the market starts to further differentiate between lenders with high quality risk management and lower quality lenders, we believe KCP lenders will be a big beneficiary. Also, our investments in in the insurance sector are better positioned as they are insulated from asset quality issues and a slowdown in loan growth for the banking sector. Further, we have reduced exposure to capital market plays given punchy valuations and a possibility of steep earning downgrades if the current market drawdown continues. Given the current valuations of quality private sector lenders and the macro backdrop, we believe the KCP portfolio is well positioned for market share gains and continued outperformance versus the broader market. |
|
Little Champs portfolio (LCP) and Rising Giants portfolio (RGP) LCP and RGP portfolios continue on their path of turnaround in performance delivering net returns of 17.51% and 24.02% respectively from April 1, 2024 to October 31, 2024. This is attributable to:
Whilst there has been some concern building around the performance of small-mid cap portfolios in the recent months, we remain sanguine about the relative prospects of the LCP and RGP portfolios driven by our confidence around the earnings outlook, healthy balance sheets and management quality of our portfolio stocks which has historically helped them exhibit high degree of resilience during periods of market drawdowns. We saw this playing out to some extent in the month of October 2024 where both the LCP and RGP portfolios outperformed their benchmarks amidst a weak return environment. We continue to make suitable changes in the portfolio:
Additions to the Rising Giants PMS portfolio (as of October 31, 2024) 1. Grauer & Weil (India) Ltd. G&W has also developed a strong moat in the niche paints applications through R&D and is the No.1 player in the Oil & Gas Pipes segment and No.2 in the water pipes segment. In the Malls business, company has a unique locational advantage in the western suburbs of Kandivali (east) which lacks meaningful competition (though we could see some upcoming competition from a new Oberoi Mall). While the Electroplating chemicals business is expected to grow in line with automotive/manufacturing industries, Paints business is expected to continue to grow at a faster pace. The Company is setting up a large R&D centre in Vasai which can help G&W to enter into newer segments and gain market share. 2. LT Foods Ltd.
All of the above has culminated into a strong brand presence and market share across geographies with Industry leading revenue growth, margin and return ratios in the last 5 years. We see further growth drivers for the business from: · Rising consumption of Basmati given its health benefits (low glycaemic index) and premium positioning. · Continual market share gains, especially in India (as channels formalise; shift from loose to packaged rice) and Europe (new greenfield in UK). · Opportunity in the Middle East market through SALIC as a strategic investor. · Opportunity in health and convenience segment. 3. Ultramarine & Pigments Ltd. 4. MAS Financial Services Ltd. 5. Carysil Ltd. Quartz has been taking share from Stainless Steel sinks due to better aesthetics. We expect Quartz sink market to grow in double digits as it continues to take market share from Steel. Carysil makes quartz sinks through “Schock” technology. Globally there are only 4 companies which have this technology viz. Schock in Germany, Blanco in US, Franke in Switzerland, and Carysil in Asia. Schock technology and know-how serves as a strong moat for the company and acts as an entry barrier. Furthermore, out of the 4 players who have Schock technology, all except Carysil have plants in US or Europe and hence are at a cost disadvantage compared to Carysil. Overtime, the firm has expanded into adjacencies like premium stainless-steel sinks, quartz surface tops, kitchen appliances (hobs, wine chillers), sanitaryware & bath fittings. Carysil has history of doing M&A to enter new geographies or new categories in UK & USA at attractive valuations. Revenue & PAT has grown at 22% CAGR and 27% CAGR over FY19-24. On the other hand, we have exited from Info Edge (India) Ltd- InfoEdge share price has run-up by 82% in the twelve months ending 31st October 2024) – which meant that IRR expected on the stock has come down significantly. As a result, it was decided to exit from the stock. Source: Respective company’s annual filings Additions to the Little Champs PMS portfolio (as of October 31, 2024) 1. Grauer & Weil (India) Ltd. 2. LT Foods Ltd. 3. Narayana Hrudayalaya Ltd. Competitive advantages of NH centres around the following:
Moats in Cayman:
4. Escorts Kubota Ltd.Inspite of the erstwhile promoters losing focus on the tractors business and being at the brink of bankruptcy, Escorts has still maintained its market share, thanks to its strong brand image and turnaround architected by Nikhil Nanda and team. With Kubota now controlling majority of the stake, we believe Escorts is at a cusp of gaining market share in the tractor industry because of the following reasons:
Apart from the domestic market, Kubota intends to make India an export hub and export tractors to Africa, US and Europe markets. Driven by market share gains and consequent operating leverage driven margin improvement. we expect the company to clock healthy earning growth over the next 5 years. Source: Respective company’s annual filings |


