
Indian banks are often criticized for maintaining higher net interest margins (NIMs) compared to their global peers. However, despite higher NIMs, Indian banks’ average RoE of 6.9% over the past decade lags the average RoE of G7 countries’ banks of 9.2%. More importantly, Indian banks have one of the lowest excess return (RoE less 10-year treasury yield) making their RoE profile actually more sustainable than those of G7 banks. Over the past 10 years, global banks made an average 7% spread over their domestic 10-year treasury yield vs a 5% spread for the top 3 Indian banks. This suggests a 13-14% RoE profile (7% spread over India’s 10Y GSEC of ~7%) for Indian banks is required for them to make similar excess returns to their G7 peers. Higher NIMs in India are not symptomatic of supernormal profitability or rent-seeking, but rather a rational response to structurally higher credit costs, operational inefficiencies, and higher domestic cost of capital. We believe regulators should reconsider capital structure regulations and explore mechanisms such as share buybacks — a tool commonly used by developed market banks to optimize capital efficiency without compromising prudential norms.
Concerns that high NIMs and borrowing costs crowd out private capex overlook a broader shift: banks are no longer the dominant source of corporate credit. Over the last 10 years, India’s bond market—particularly in the AAA segment— has grown its market share by 10 percentage points. Today, the bond market accounts for ~60% of total corporate credit offtake, reflecting a structural change in financing channels.
Performance update of the live fund
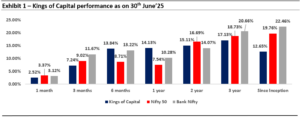
Note: Performance Data shown is net of fixed fees and expenses charged till 30th June 2025 and is net of Performance fees charged for client accounts, whose account anniversary / performance calculation date falls up to the last date of this performance period; since inception & 3 years returns are annualized; other time period returns are absolute. The calculation or presentation of performance results in this publication has NOT been approved or reviewed by the SEC, SEBI or any other regulatory authority.
NIFTY50 TRI is the benchmark index for the investment approach as per the Disclosure Document. Nifty Bank TRI is not the benchmark for the approach and has been provided for reference purposes as the approach invests in banks and financial services sector.
*For the relative performance of particular investment Approach to other Portfolio Managers within the selected strategy, please refer. Under PMS Provider Name please select Marcellus Investment Managers Private Limited and select your Investment Approach Name for APMI (apmiindia.org) the stated disclosure.
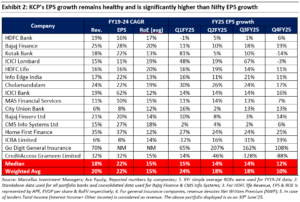
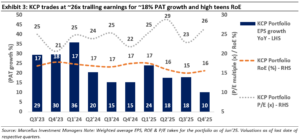
The Portfolio continues to deliver robust fundamentals and trades at reasonable valuations
Margins ≠ Profitability: Debunking the Indian Banking Premium
It is often observed in industry discussions that Indian banks report higher net interest margins (NIMs) compared to many of their global counterparts. This is true. We found NII/average assets for Indian banks materially higher than their global counterparts. However, this is just one facet of a more complex narrative. While elevated NIMs may appear to signal strong profitability, it is important to recognize that Indian banks also operate under significantly higher credit costs and operational expenses.
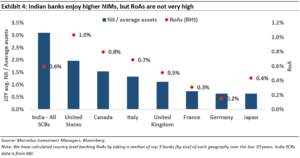
The need to provision for higher non-performing assets (NPAs) and manage a vast branch network across diverse geographies adds considerable pressure to their cost structures. As a result, higher NIMs are not merely a function of market power or inefficiency, but a necessary response to the underlying realities of the Indian banking landscape. Furthermore, the cost of capital in India remains elevated, driven by both regulatory requirements and macroeconomic factors such as higher inflation and higher government bond yields.
While the cost of capital is a multifaceted issue, even a straightforward comparison of risk-free rates—measured by government bond yields—underscores this disparity. Over the past decade, the average yield on 10-year government bonds among G7 countries was 1.6% (with a median of 2%), ranging from a low of 0.3% in Japan to a high of 2.6% in the United States. In contrast, India’s 10-year government bond yield averaged 6.9% during the same period.
Global studies consistently show that countries with higher inflation rates and treasury bill yields tend to exhibit higher NIMs, reflecting the structural challenges faced by their banking sectors. Thus, the higher margins observed in India are closely linked to the unique risk environment and cost dynamics present in the market, rather than an indication of excessive profitability or lack of competition.
If Indian banks were truly charging excessively higher rates, this should have translated into correspondingly higher return on equity (RoEs). However, a comparison of Indian banks’ RoEs with those of G7 countries reveals a different picture. While 2024 saw healthy and cyclical peak RoEs for Indian banks, their cross-cycle average RoE stands at around 7%, compared to the G7 average of approximately 9%. From the cyclical high of about 16% recorded in 2024, it is reasonable to anticipate a decline in RoEs as the temporary benefits of elevated margins and subdued credit costs normalize.
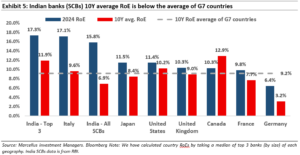
Lastly, the true character and long-term viability of any business are ultimately judged by its ability to consistently generate a return on equity (ROE) that exceeds its cost of equity (COE). For the sake of simplicity, we compare excess returns made by banks in India compared to G7 countries.
Excess returns = 10Y average RoE of banks less average 10 year treasury yields of their respective countries
The analysis shows, excess RoE made by banks in G7 countries stood at 7%, as compared to this, Indian banks barely made any excess RoE over the last decade. In fact, the top 3 banks (by size) also made excess RoEs of 5% (lower than G7 average). This concludes the point that banks in India are NOT making too much on a cross-cycle basis by overcharging the customer usurious rates.
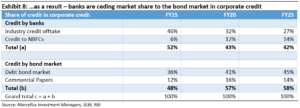
Banks have been losing share to the bond market over the last decade
Banks have been steadily losing market share in corporate credit (i.e credit to large industries and credit to NBFCs) to the bond market, a trend that reflects both global patterns and evolving preferences among Indian corporates. The bond market offers more attractive borrowing rates and fewer restrictions compared to traditional bank loans, making it an appealing alternative for companies seeking efficient capital.
As a result, corporations are increasingly turning to bonds to meet their funding needs, especially for large or long-term projects. This shift is considered to be a good thing, as globally, bond markets are the primary source of corporate financing, accounting for a much larger share of total debt in developed economies.
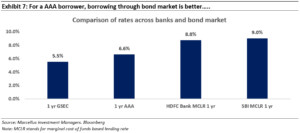
As a result of this shift, for any AAA corporate which wants to borrow money, there are enough avenues to get credit at attractive rates. Hence, for now, interest rates in the economy can’t be a reason for lack of revival in corporate capex.
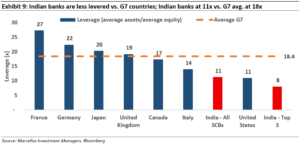
Capital structure of Indian banks is inefficient
The capital structure of Indian banks is often considered inefficient, Indian banks are sitting on the highest ever equity (as % of total assets) and is materially higher than G7 countries. Higher equity leads to lower leverage in the balance sheet (refer exhibit 9 for comparison of India with other G7 countries). High equity base is inefficient because regulatory requirements like a higher Capital to Risk-weighted Assets Ratio (CRAR) (India at 9% vs G7 at 8%) force banks to maintain more capital than global standards, which restricts their ability to leverage and lend more aggressively.
Lower leverage means Indian banks rely more on equity and less on debt, which increases their overall cost of capital and reduces their potential return on equity (ROE), making it harder to generate competitive shareholder returns.
To compensate for lower ROEs resulting from higher capital requirements and lower leverage, banks are compelled to charge higher lending yields (interest rates) to borrowers, which can dampen credit demand and economic growth.
What choices does the regulator have to overcome this issue?
Choice 1: Push banks to cut lending yields and stimulate credit growth-> accelerate banking sector credit growth
By reducing lending yields, banks can stimulate loan demand and inject greater liquidity into the financial system. This approach accelerates asset growth relative to net worth, thereby increasing leverage. As a result, banks can achieve comparable returns on equity (RoEs) even with lower net interest margins (NIMs). We believe this solution might created demand in the short term but can possibly lead to accidents and risk of NPAs in the long term which usually follow after a phase of high credit growth and reckless lending.
Choice 2: Give banks freedom to improve their capital structure by allowing share buybacks
By optimizing their capital structure through share buybacks, banks can increase balance sheet leverage, thereby enhancing returns on equity (RoE). This improved capital efficiency enables banks to selectively reduce lending yields, passing on the benefits of higher RoE to customers through more competitive loan pricing. Given the current banking regulations, large private sector banks have been stuck with excess capital which has resulted in depressed RoEs for these banks. If these banks are allowed to do share buybacks, their capital structure will become much more efficient which will benefit borrowers and the broader economy in the form of more competitive lending rates. We believe this is a much more nuanced and long term sustainable solution for the banking sector.
Do regulators in other G7 countries allow banks to do buy-backs?
Yes, banks in many countries are allowed to conduct share buybacks, but these programs are subject to regulatory approval and oversight. Many banks have reduced their share count thereby improving capital allocation flexibility and improving bank RoEs – the benefits of which flow through to not only shareholders but also to the wider economy in the form of more competitive lending rates. For example – over the past decade JP morgan (US’s largest bank by size) has reduced share count by an astounding 24%! Similar examples come from other geographies – recently major global banks—including Societe Generale (France), ING (Netherlands), Deutsche Bank (Germany), UBS (Switzerland), and Nomura (Japan) — have announced share buyback programs.
From a KCP perspective, where do we go from here?
As highlighted in our previous newsletters, we have been actively broadening our portfolio coverage to reduce over-reliance on the banking sector. Our allocation to banks will continue to vary over time, reflecting shifts in earnings growth expectations and prevailing valuations. Over the past 12 to 18 months, KCP has strategically expanded its investment focus within the financial sector by incorporating a range of asset-light enterprises. These companies are typically market leaders in their respective domains and benefit from operating within favorable industry structures.
KCP’s path ahead and valuation check
Our valuation philosophy is largely relative to the market. It is well understood that the Nifty index, over the long term, delivers ~10% earnings growth and a 12% RoE. Despite superior fundamental (earnings and RoE) performance of KCP, we are committed to maintain valuation discipline, ensuring that our portfolio’s valuation premium over Nifty does not exceed by 20%. This approach is essential for preserving a consistent margin of safety within our portfolio. Given than index trades at 19-21x EPS, we would be comfortable with KCP trading at 23-26x EPS.
As of now, KCP’s valuations are within our tolerance band, hence, we remain comfortable. Additionally, since most of the portfolio companies continues to deliver healthy earnings growth, the portfolio is comfortably placed in the current scenario where growth is scarce in the market.
Regards,
Team Marcellus
If you want to read our other published material, please visit https://marcellus.in/

